| Tissue | Expression Dynamics | Abbreviation |
| Cervix | 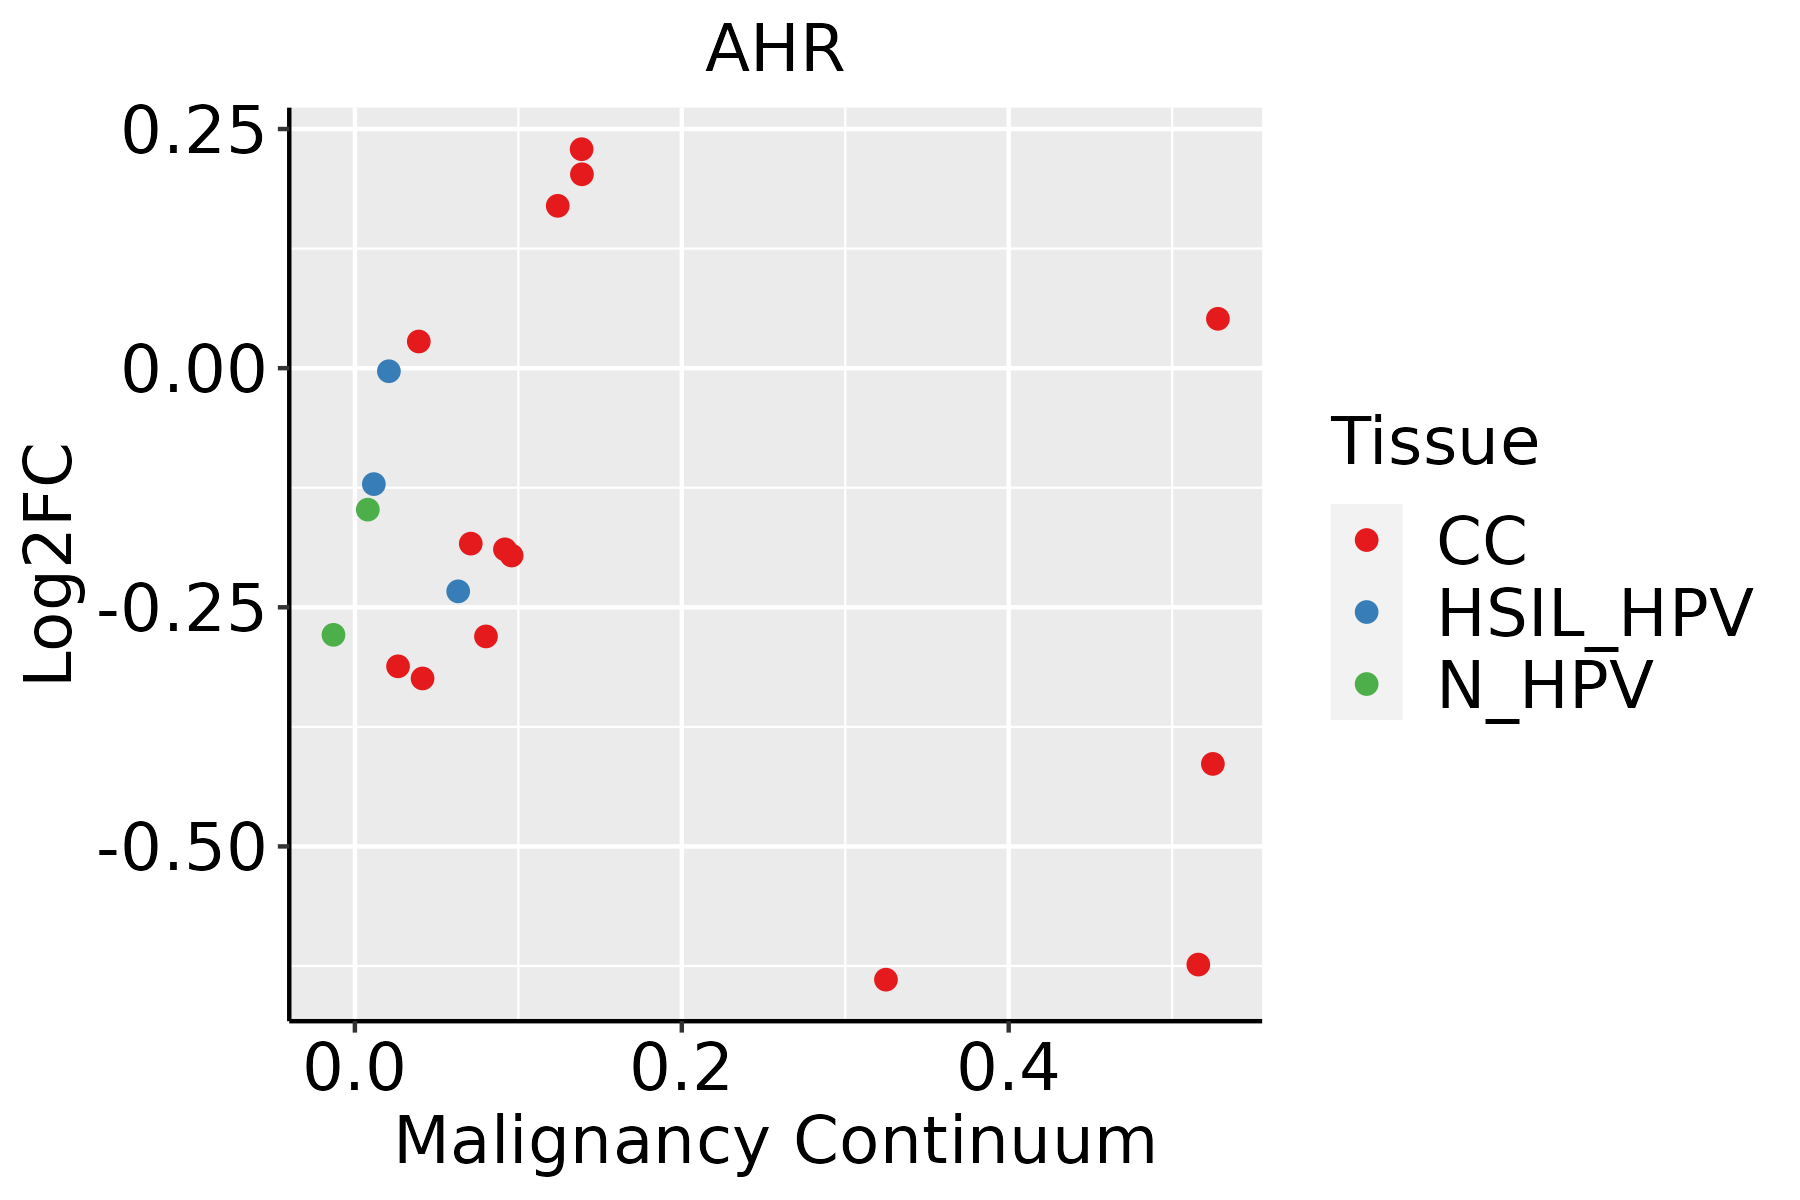 | CC: Cervix cancer |
| HSIL_HPV: HPV-infected high-grade squamous intraepithelial lesions |
| N_HPV: HPV-infected normal cervix |
| Endometrium | 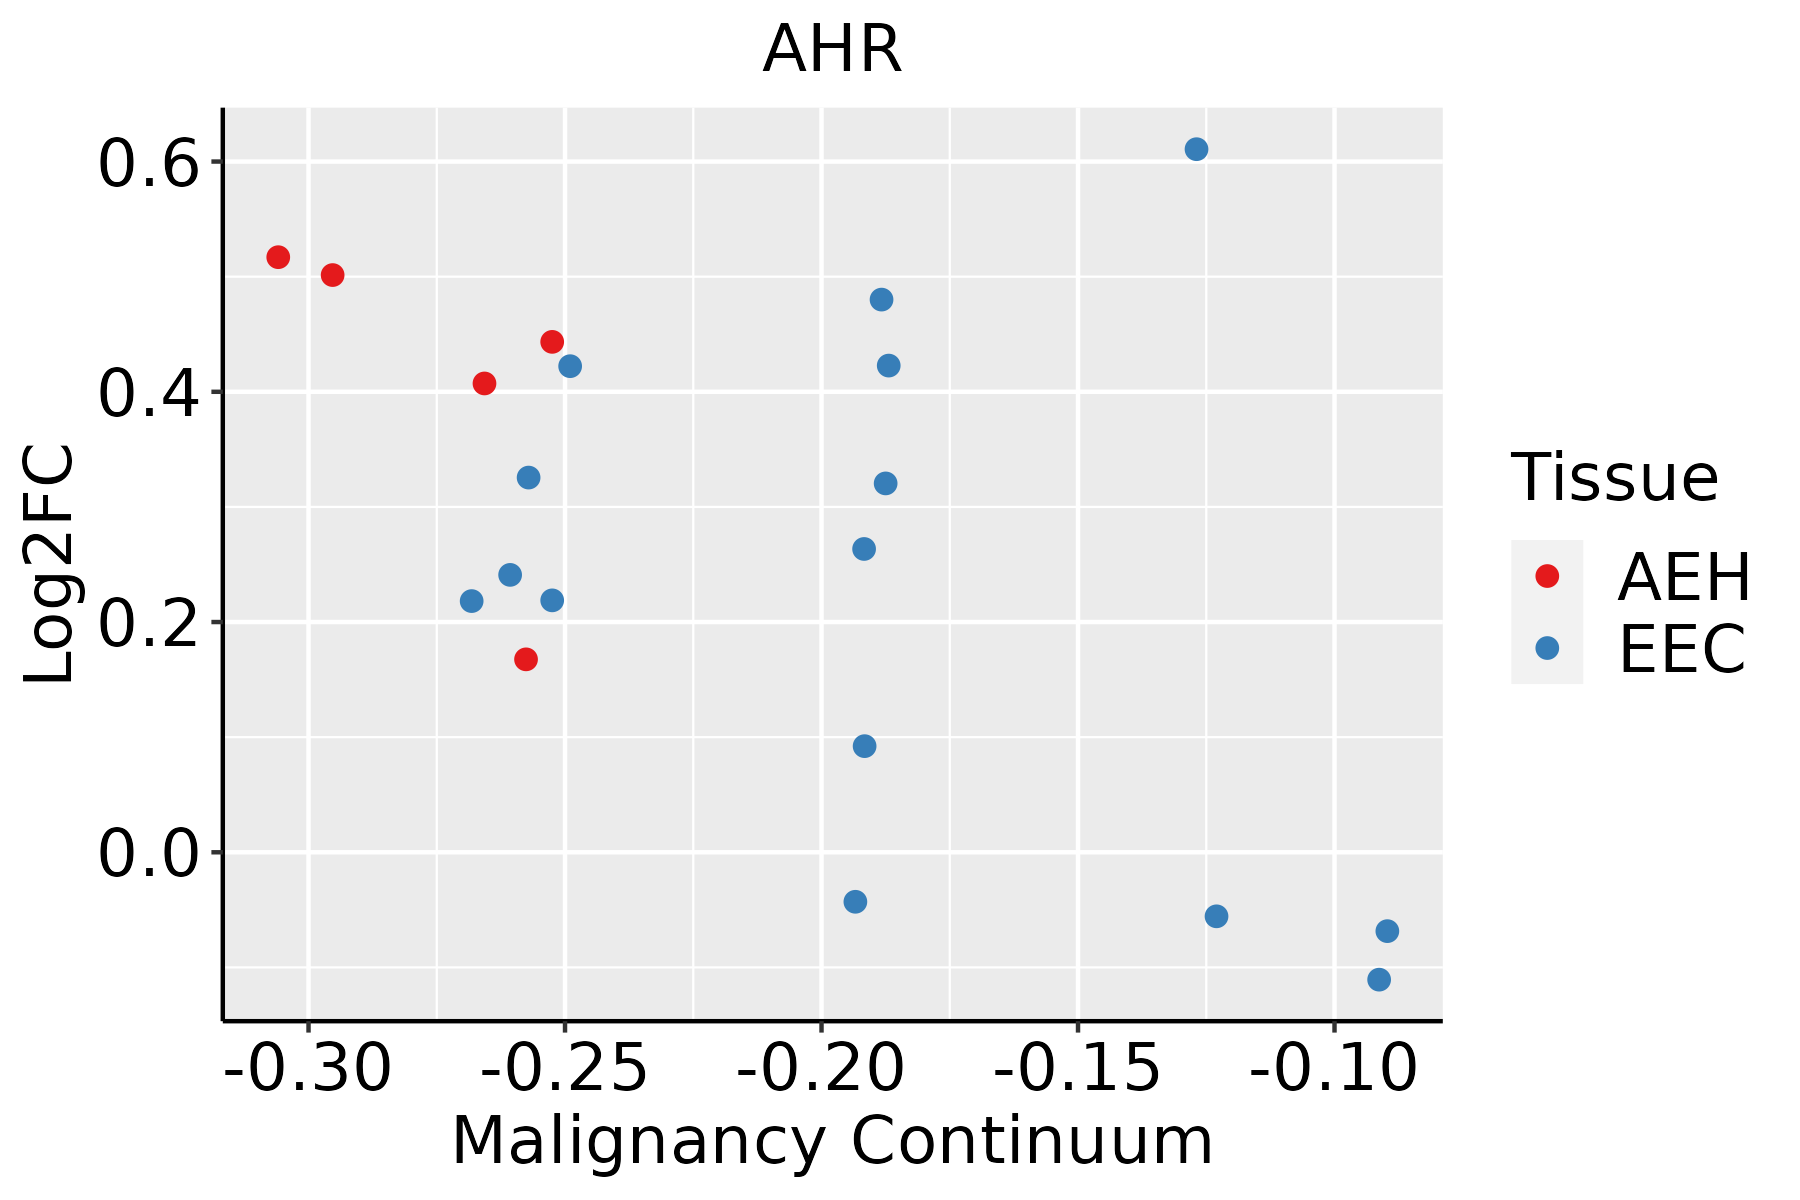 | AEH: Atypical endometrial hyperplasia |
| EEC: Endometrioid Cancer |
| Esophagus |  | ESCC: Esophageal squamous cell carcinoma |
| HGIN: High-grade intraepithelial neoplasias |
| LGIN: Low-grade intraepithelial neoplasias |
| Liver | 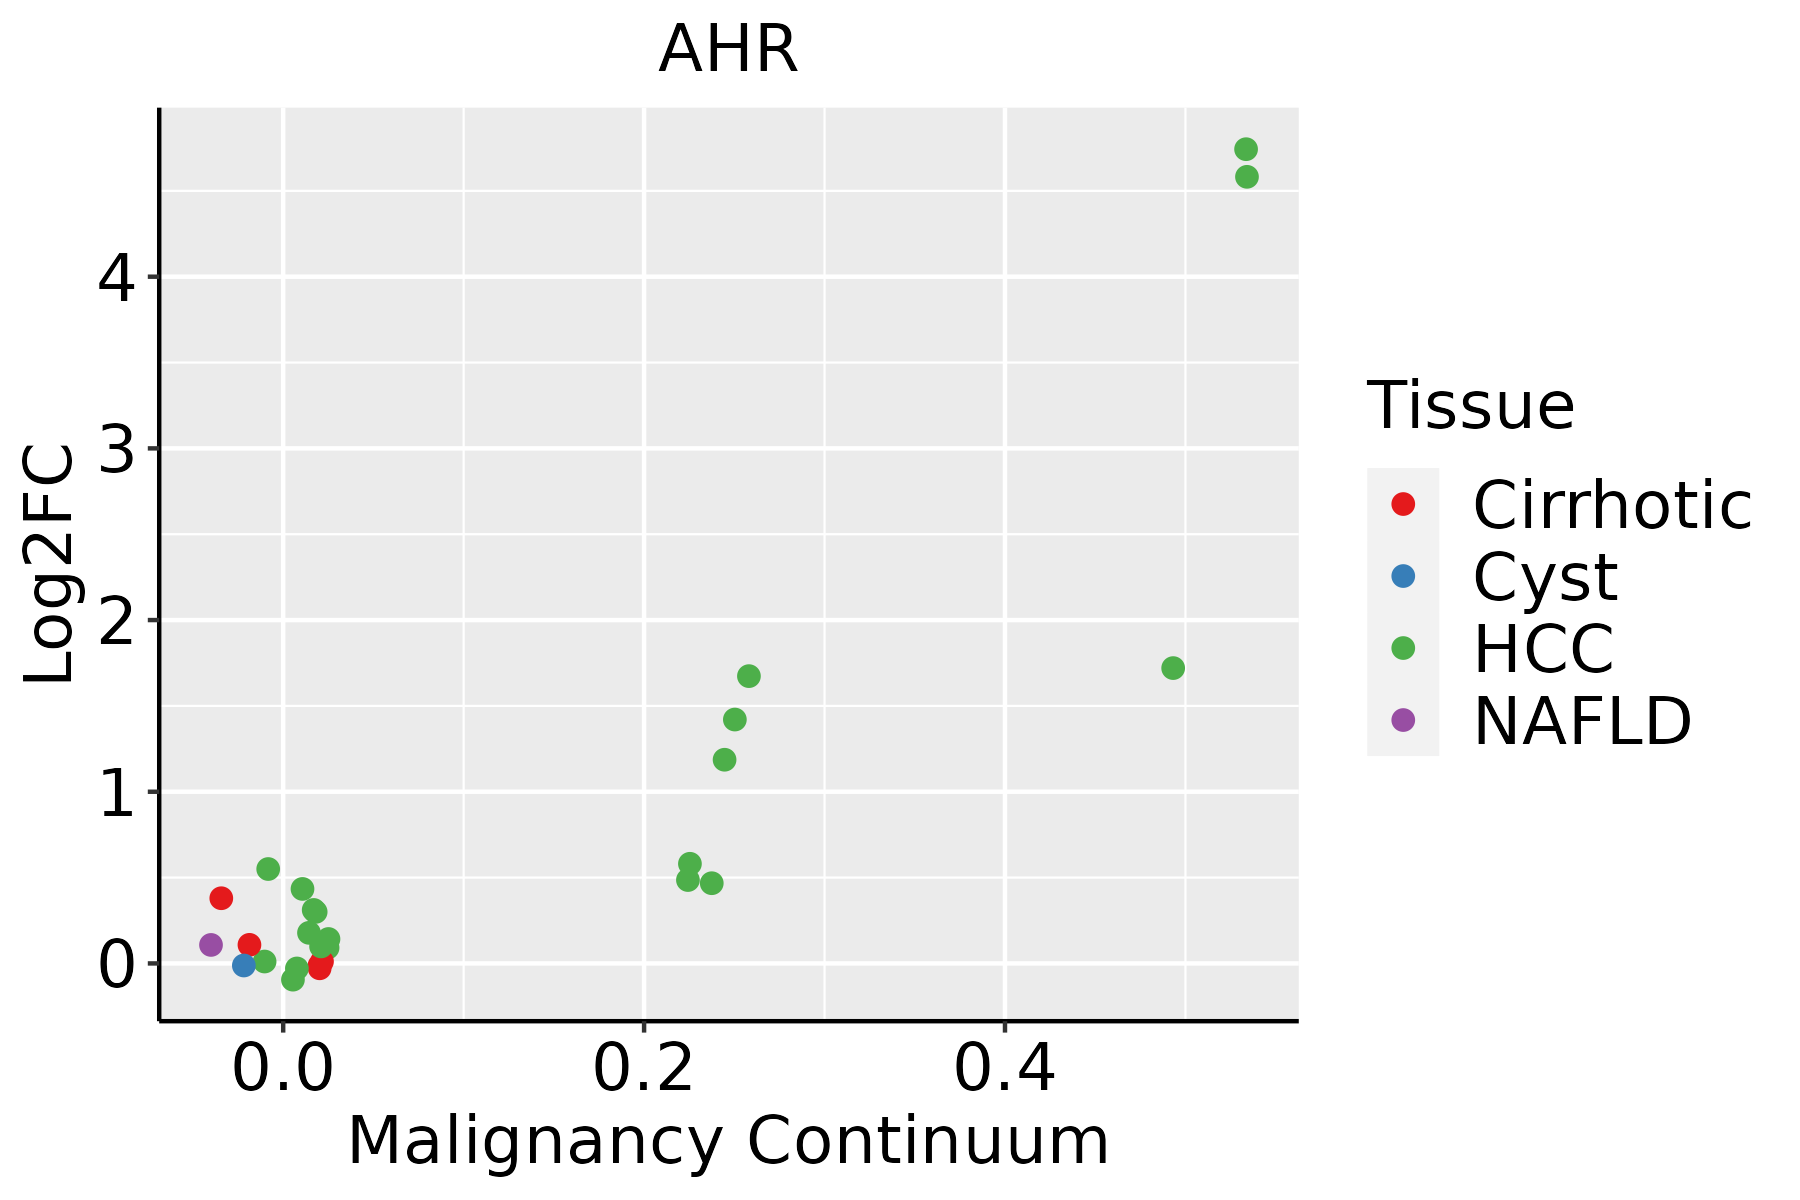 | HCC: Hepatocellular carcinoma |
| NAFLD: Non-alcoholic fatty liver disease |
| Lung |  | AAH: Atypical adenomatous hyperplasia |
| AIS: Adenocarcinoma in situ |
| IAC: Invasive lung adenocarcinoma |
| MIA: Minimally invasive adenocarcinoma |
| Oral Cavity | 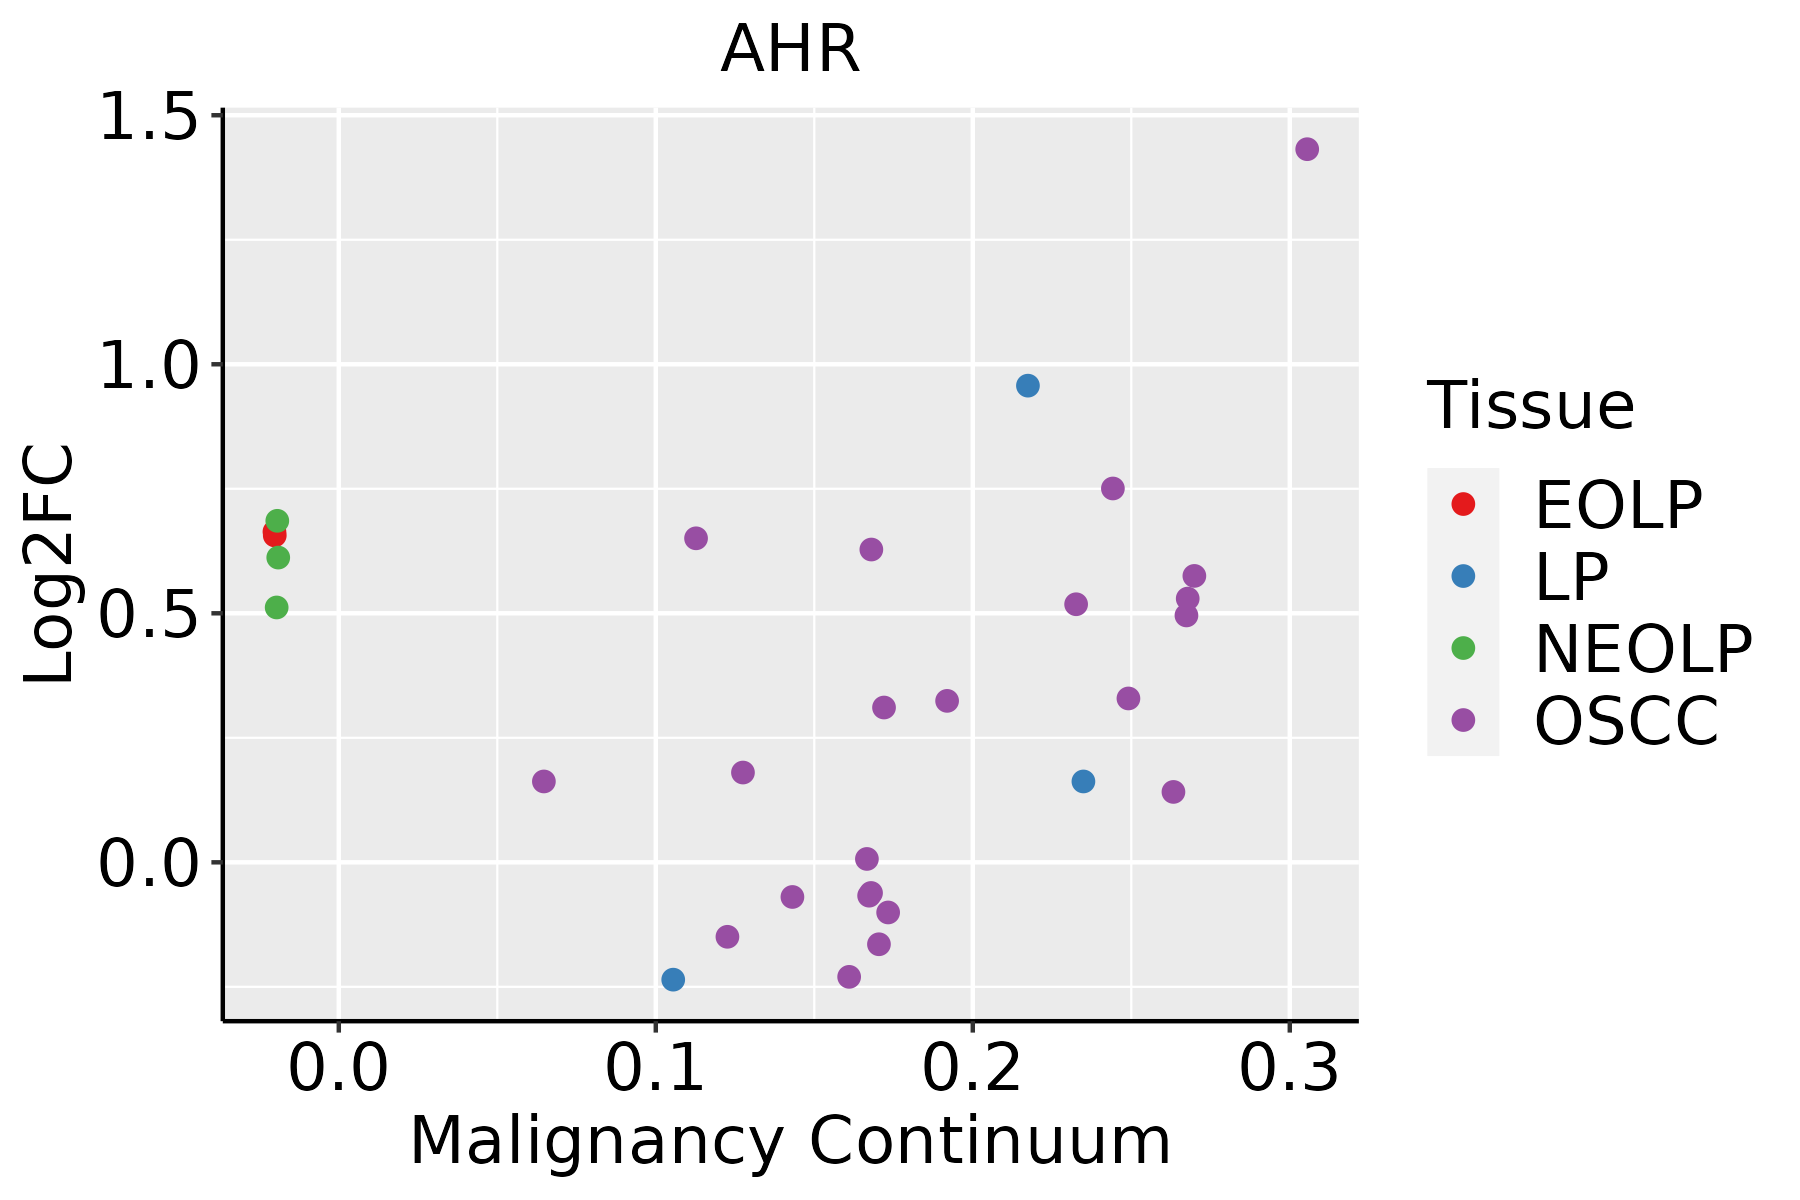 | EOLP: Erosive Oral lichen planus |
| LP: leukoplakia |
| NEOLP: Non-erosive oral lichen planus |
| OSCC: Oral squamous cell carcinoma |
| Prostate | 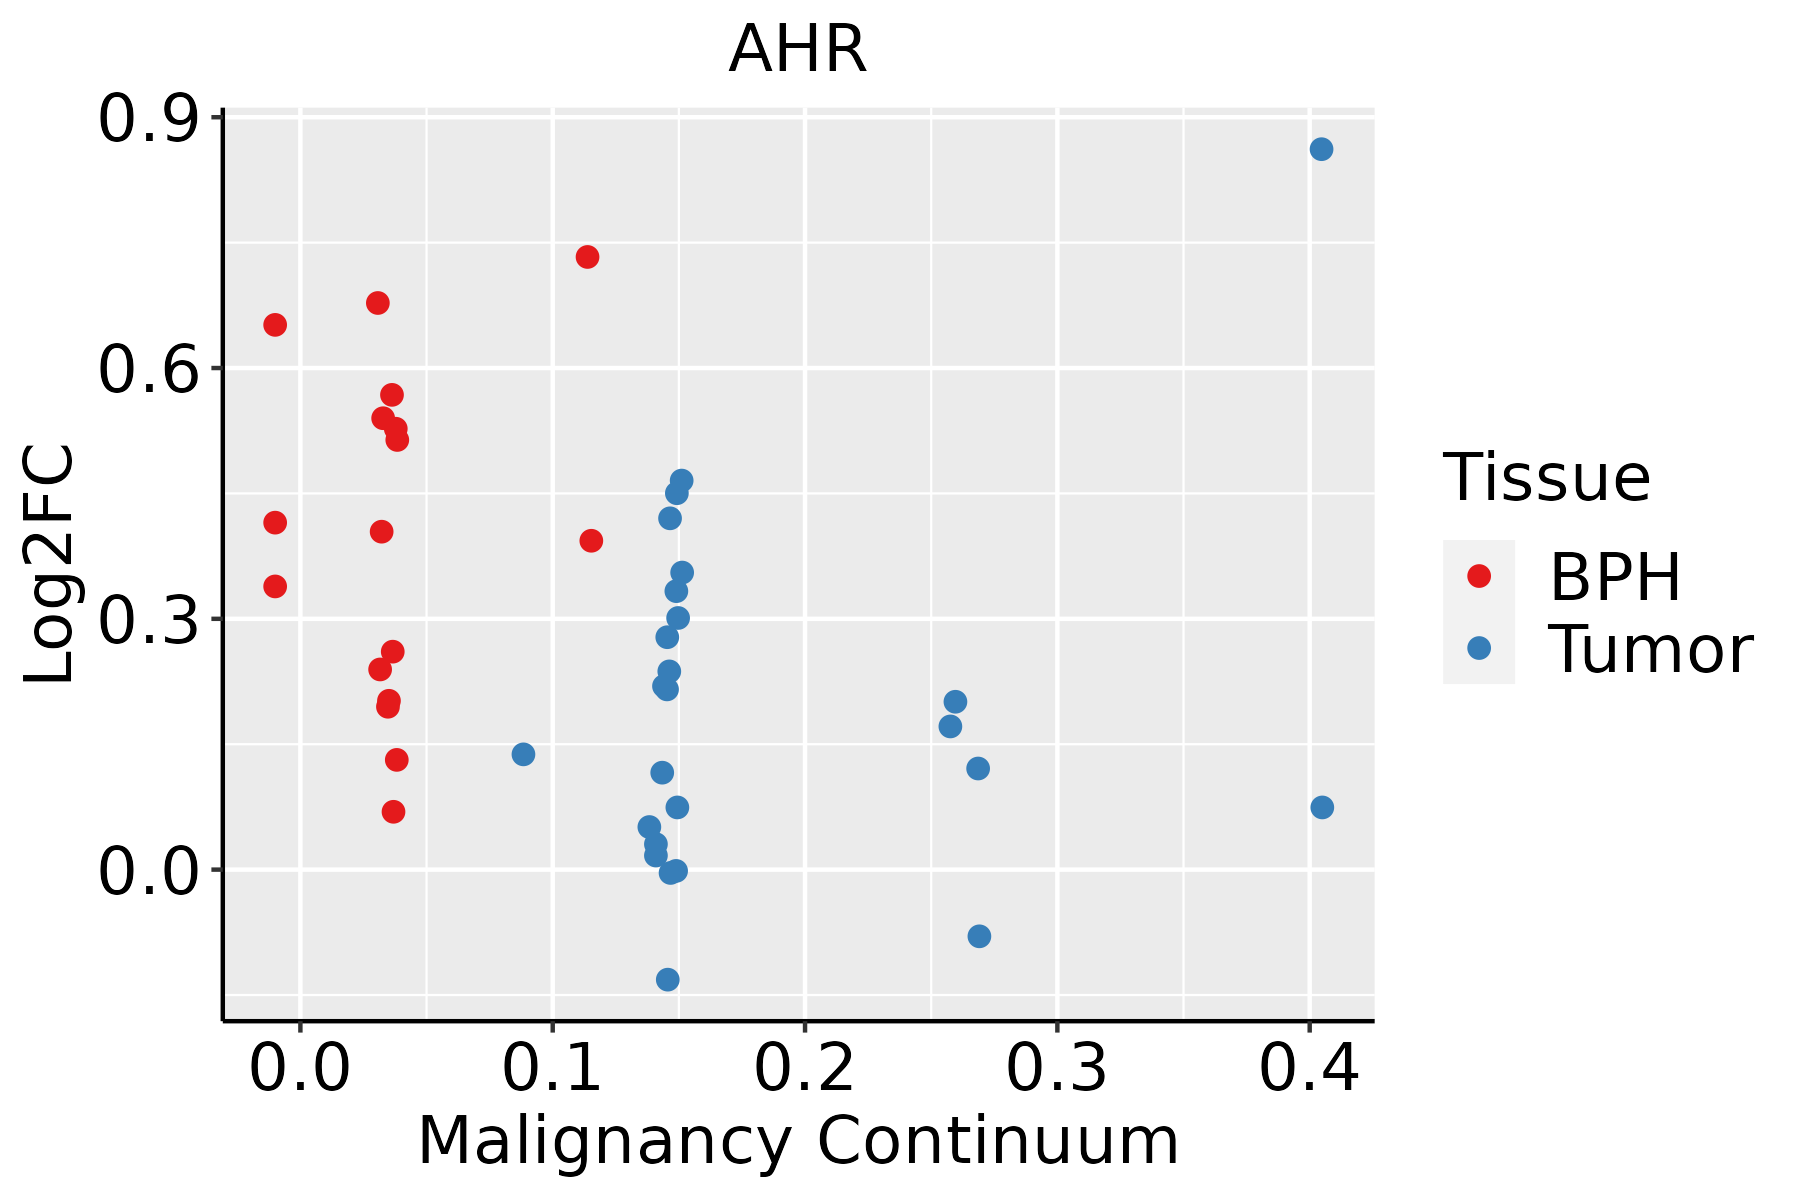 | BPH: Benign Prostatic Hyperplasia |
| Skin | 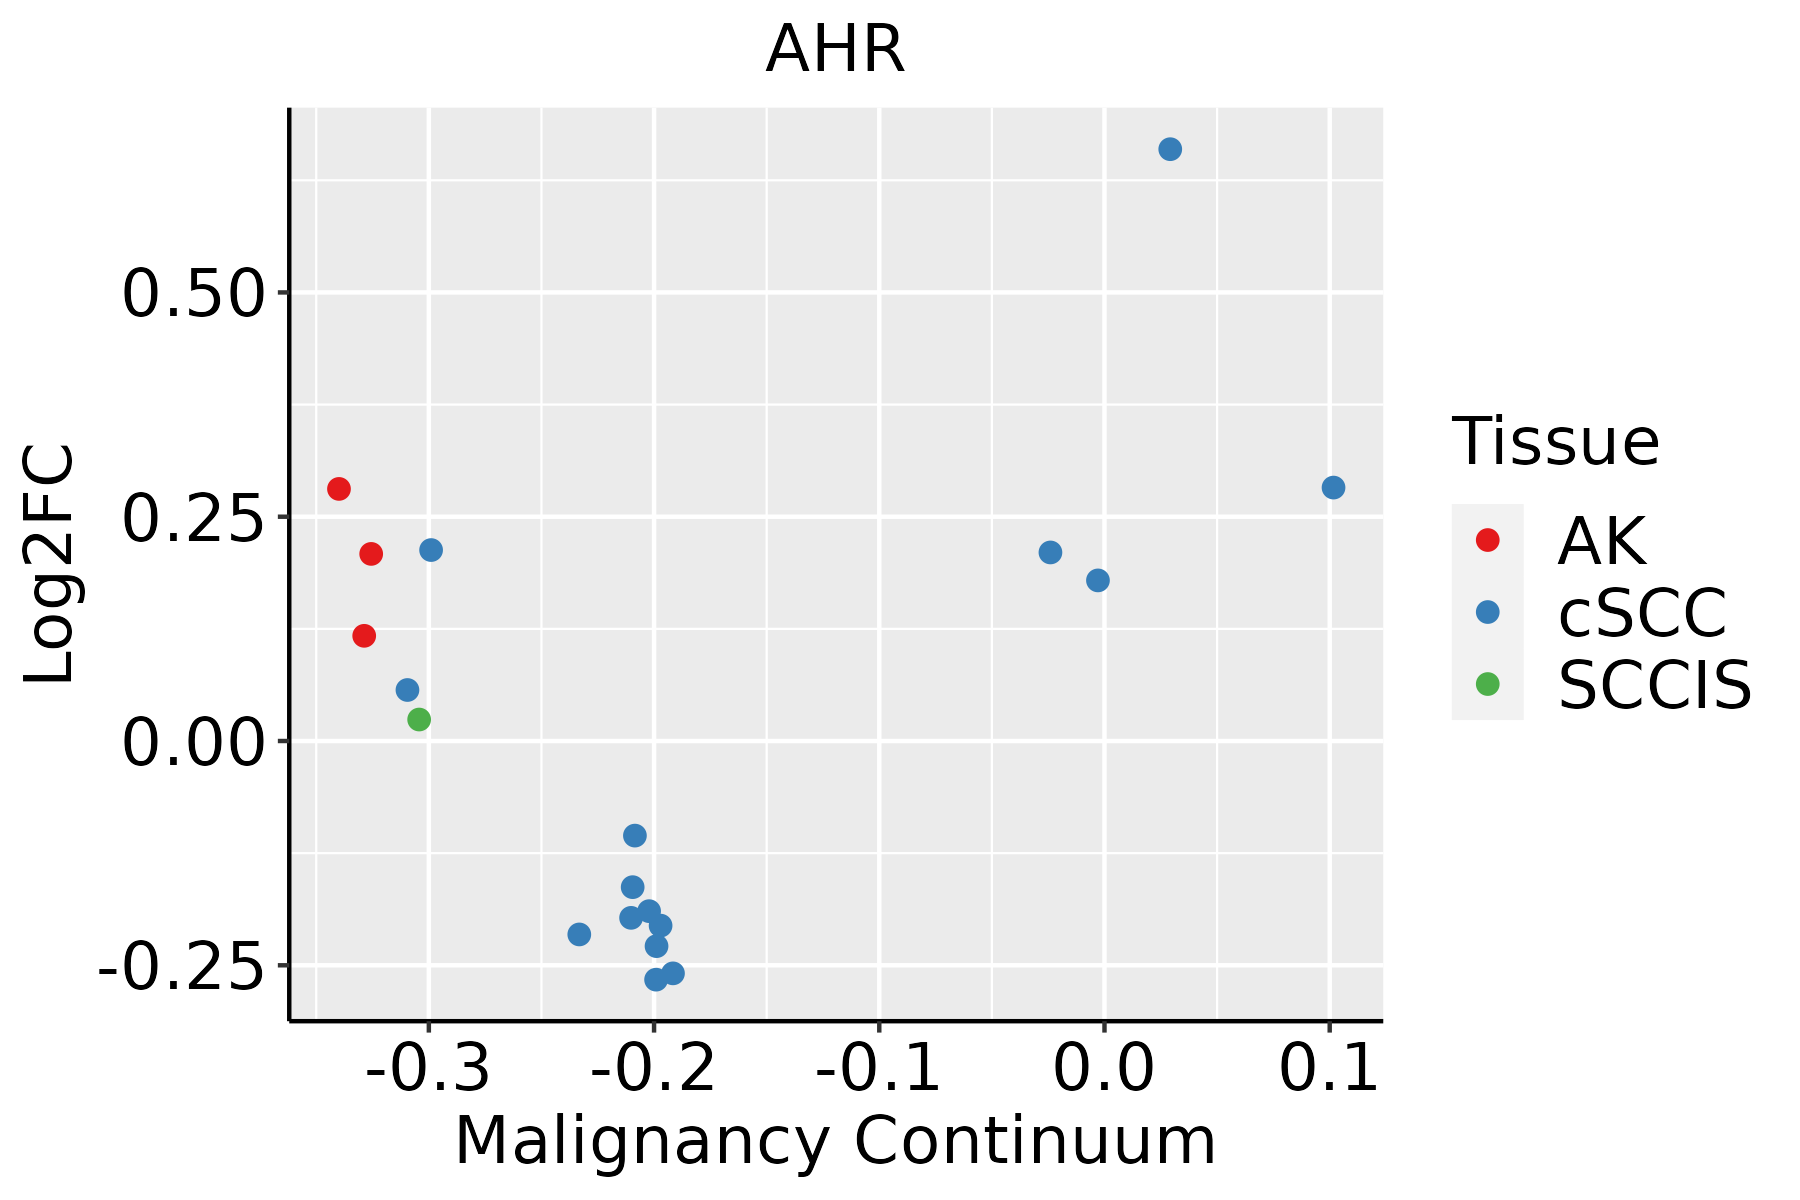 | AK: Actinic keratosis |
| cSCC: Cutaneous squamous cell carcinoma |
| SCCIS:squamous cell carcinoma in situ |
| Thyroid | 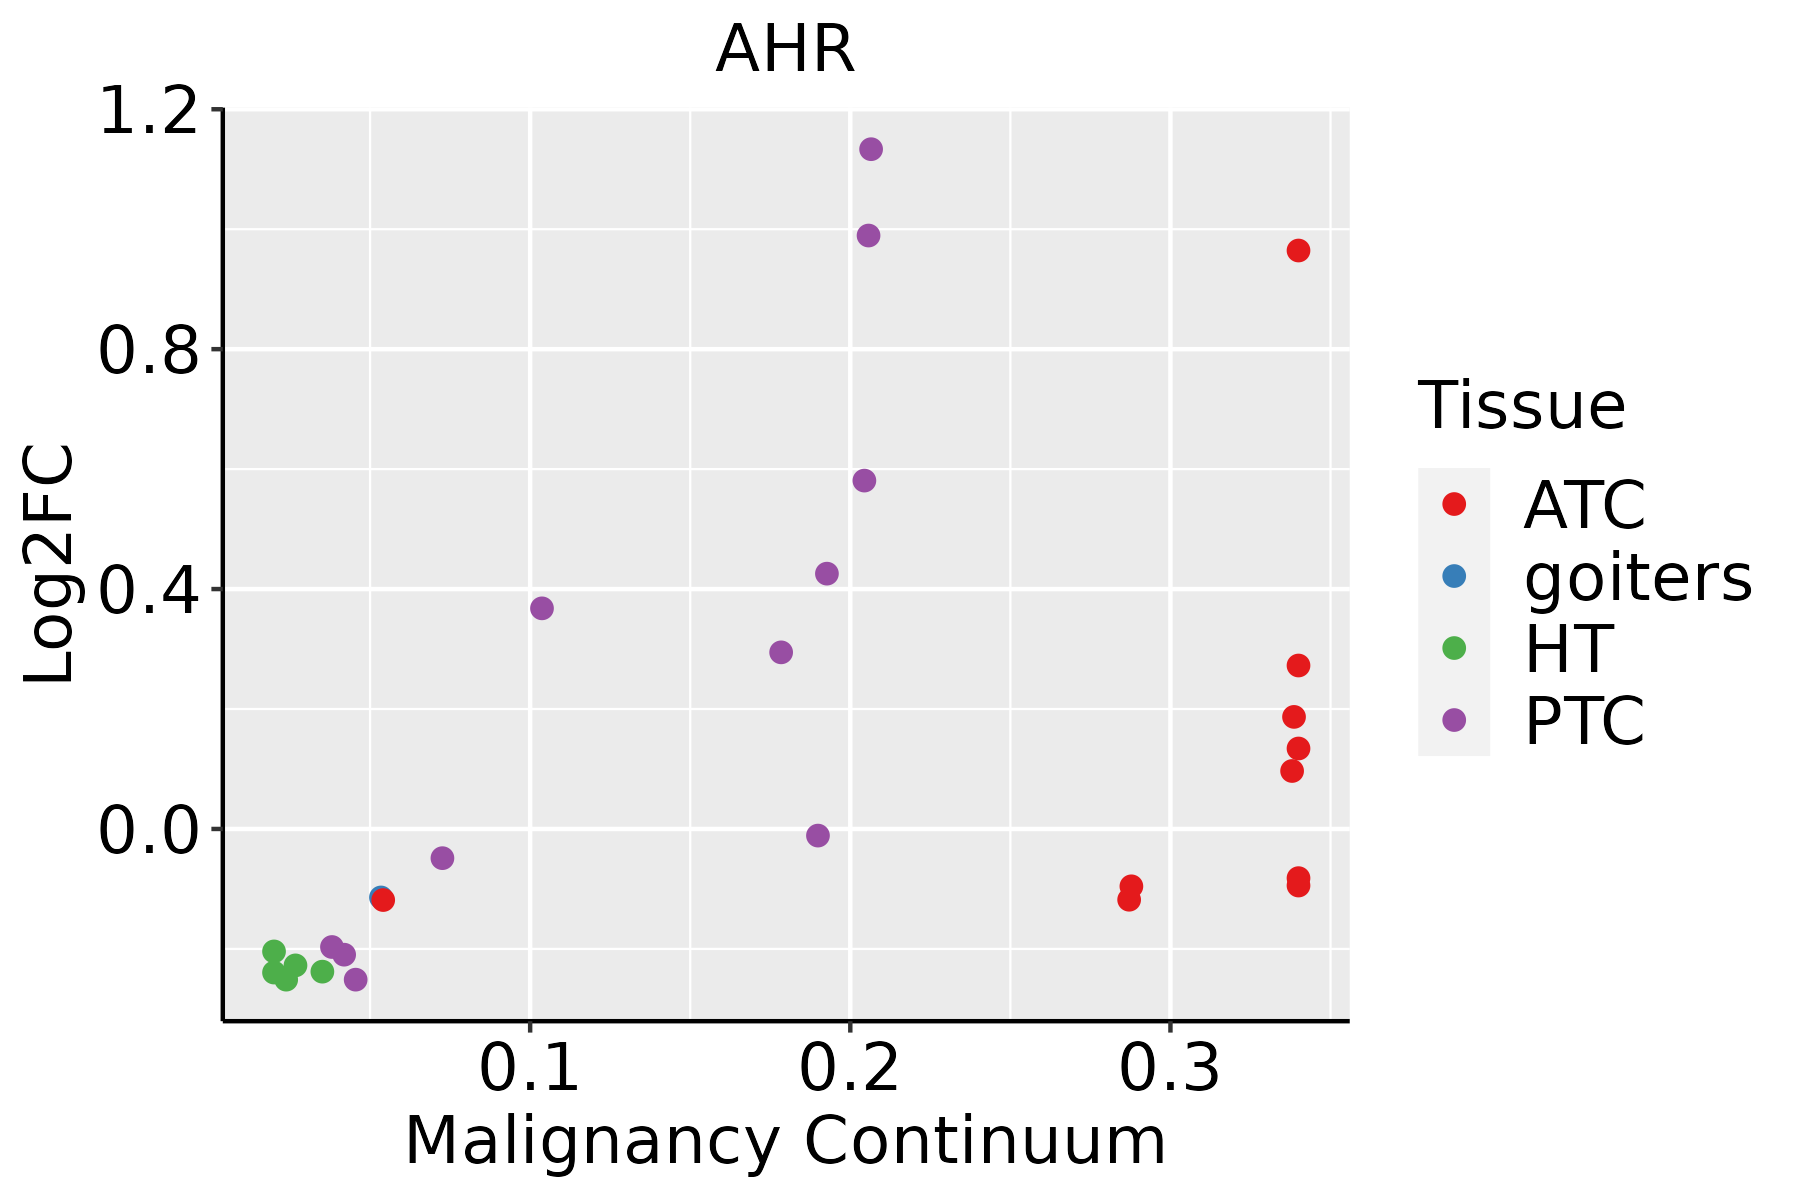 | ATC: Anaplastic thyroid cancer |
| HT: Hashimoto's thyroiditis |
| PTC: Papillary thyroid cancer |
| GO ID | Tissue | Disease Stage | Description | Gene Ratio | Bg Ratio | pvalue | p.adjust | Count |
| GO:00026837 | Cervix | CC | negative regulation of immune system process | 94/2311 | 434/18723 | 2.63e-08 | 1.87e-06 | 94 |
| GO:00305229 | Cervix | CC | intracellular receptor signaling pathway | 60/2311 | 265/18723 | 1.89e-06 | 5.97e-05 | 60 |
| GO:00485118 | Cervix | CC | rhythmic process | 65/2311 | 298/18723 | 2.79e-06 | 8.04e-05 | 65 |
| GO:00706637 | Cervix | CC | regulation of leukocyte proliferation | 55/2311 | 245/18723 | 6.51e-06 | 1.56e-04 | 55 |
| GO:00506705 | Cervix | CC | regulation of lymphocyte proliferation | 51/2311 | 225/18723 | 1.05e-05 | 2.32e-04 | 51 |
| GO:00329444 | Cervix | CC | regulation of mononuclear cell proliferation | 51/2311 | 227/18723 | 1.36e-05 | 2.73e-04 | 51 |
| GO:00028315 | Cervix | CC | regulation of response to biotic stimulus | 67/2311 | 327/18723 | 1.79e-05 | 3.36e-04 | 67 |
| GO:190165410 | Cervix | CC | response to ketone | 45/2311 | 194/18723 | 1.83e-05 | 3.44e-04 | 45 |
| GO:00706617 | Cervix | CC | leukocyte proliferation | 65/2311 | 318/18723 | 2.56e-05 | 4.32e-04 | 65 |
| GO:00466516 | Cervix | CC | lymphocyte proliferation | 59/2311 | 288/18723 | 5.53e-05 | 8.10e-04 | 59 |
| GO:00076238 | Cervix | CC | circadian rhythm | 46/2311 | 210/18723 | 6.76e-05 | 9.60e-04 | 46 |
| GO:00329435 | Cervix | CC | mononuclear cell proliferation | 59/2311 | 291/18723 | 7.51e-05 | 1.03e-03 | 59 |
| GO:00028322 | Cervix | CC | negative regulation of response to biotic stimulus | 27/2311 | 108/18723 | 2.27e-04 | 2.55e-03 | 27 |
| GO:00096369 | Cervix | CC | response to toxic substance | 52/2311 | 262/18723 | 3.34e-04 | 3.52e-03 | 52 |
| GO:00507773 | Cervix | CC | negative regulation of immune response | 41/2311 | 194/18723 | 3.63e-04 | 3.76e-03 | 41 |
| GO:00024564 | Cervix | CC | T cell mediated immunity | 26/2311 | 109/18723 | 6.39e-04 | 5.97e-03 | 26 |
| GO:00026983 | Cervix | CC | negative regulation of immune effector process | 26/2311 | 110/18723 | 7.40e-04 | 6.63e-03 | 26 |
| GO:00026973 | Cervix | CC | regulation of immune effector process | 62/2311 | 339/18723 | 9.25e-04 | 7.84e-03 | 62 |
| GO:00329226 | Cervix | CC | circadian regulation of gene expression | 18/2311 | 68/18723 | 1.18e-03 | 9.56e-03 | 18 |
| GO:00094109 | Cervix | CC | response to xenobiotic stimulus | 78/2311 | 462/18723 | 2.39e-03 | 1.70e-02 | 78 |
| Pathway ID | Tissue | Disease Stage | Description | Gene Ratio | Bg Ratio | pvalue | p.adjust | qvalue | Count |
| hsa0520826 | Endometrium | AEH | Chemical carcinogenesis - reactive oxygen species | 91/1197 | 223/8465 | 3.28e-23 | 1.33e-21 | 9.76e-22 | 91 |
| hsa05208112 | Endometrium | AEH | Chemical carcinogenesis - reactive oxygen species | 91/1197 | 223/8465 | 3.28e-23 | 1.33e-21 | 9.76e-22 | 91 |
| hsa0520827 | Endometrium | EEC | Chemical carcinogenesis - reactive oxygen species | 94/1237 | 223/8465 | 4.11e-24 | 1.93e-22 | 1.44e-22 | 94 |
| hsa0520836 | Endometrium | EEC | Chemical carcinogenesis - reactive oxygen species | 94/1237 | 223/8465 | 4.11e-24 | 1.93e-22 | 1.44e-22 | 94 |
| hsa05208211 | Esophagus | ESCC | Chemical carcinogenesis - reactive oxygen species | 168/4205 | 223/8465 | 1.83e-15 | 6.81e-14 | 3.49e-14 | 168 |
| hsa05208310 | Esophagus | ESCC | Chemical carcinogenesis - reactive oxygen species | 168/4205 | 223/8465 | 1.83e-15 | 6.81e-14 | 3.49e-14 | 168 |
| hsa0520842 | Liver | HCC | Chemical carcinogenesis - reactive oxygen species | 167/4020 | 223/8465 | 2.85e-17 | 1.91e-15 | 1.06e-15 | 167 |
| hsa0520852 | Liver | HCC | Chemical carcinogenesis - reactive oxygen species | 167/4020 | 223/8465 | 2.85e-17 | 1.91e-15 | 1.06e-15 | 167 |
| hsa0520823 | Lung | AIS | Chemical carcinogenesis - reactive oxygen species | 47/961 | 223/8465 | 1.63e-05 | 3.77e-04 | 2.41e-04 | 47 |
| hsa0520833 | Lung | AIS | Chemical carcinogenesis - reactive oxygen species | 47/961 | 223/8465 | 1.63e-05 | 3.77e-04 | 2.41e-04 | 47 |
| hsa046594 | Lung | MIAC | Th17 cell differentiation | 14/507 | 108/8465 | 4.92e-03 | 3.50e-02 | 2.53e-02 | 14 |
| hsa046595 | Lung | MIAC | Th17 cell differentiation | 14/507 | 108/8465 | 4.92e-03 | 3.50e-02 | 2.53e-02 | 14 |
| hsa0520830 | Oral cavity | OSCC | Chemical carcinogenesis - reactive oxygen species | 150/3704 | 223/8465 | 6.45e-13 | 1.20e-11 | 6.11e-12 | 150 |
| hsa046598 | Oral cavity | OSCC | Th17 cell differentiation | 65/3704 | 108/8465 | 4.02e-04 | 1.25e-03 | 6.35e-04 | 65 |
| hsa05208114 | Oral cavity | OSCC | Chemical carcinogenesis - reactive oxygen species | 150/3704 | 223/8465 | 6.45e-13 | 1.20e-11 | 6.11e-12 | 150 |
| hsa0465913 | Oral cavity | OSCC | Th17 cell differentiation | 65/3704 | 108/8465 | 4.02e-04 | 1.25e-03 | 6.35e-04 | 65 |
| hsa0520845 | Oral cavity | EOLP | Chemical carcinogenesis - reactive oxygen species | 66/1218 | 223/8465 | 2.50e-09 | 5.76e-08 | 3.40e-08 | 66 |
| hsa0520855 | Oral cavity | EOLP | Chemical carcinogenesis - reactive oxygen species | 66/1218 | 223/8465 | 2.50e-09 | 5.76e-08 | 3.40e-08 | 66 |
| hsa0520863 | Oral cavity | NEOLP | Chemical carcinogenesis - reactive oxygen species | 68/1112 | 223/8465 | 5.39e-12 | 2.86e-10 | 1.80e-10 | 68 |
| hsa0520873 | Oral cavity | NEOLP | Chemical carcinogenesis - reactive oxygen species | 68/1112 | 223/8465 | 5.39e-12 | 2.86e-10 | 1.80e-10 | 68 |
| Hugo Symbol | Variant Class | Variant Classification | dbSNP RS | HGVSc | HGVSp | HGVSp Short | SWISSPROT | BIOTYPE | SIFT | PolyPhen | Tumor Sample Barcode | Tissue | Histology | Sex | Age | Stage | Therapy Types | Drugs | Outcome |
| AHR | SNV | Missense_Mutation | | c.119G>C | p.Arg40Thr | p.R40T | P35869 | protein_coding | deleterious(0) | probably_damaging(1) | TCGA-A8-A06X-01 | Breast | breast invasive carcinoma | Female | >=65 | I/II | Unknown | Unknown | SD |
| AHR | SNV | Missense_Mutation | | c.1516N>A | p.Asp506Asn | p.D506N | P35869 | protein_coding | tolerated(0.73) | benign(0.006) | TCGA-C8-A26Y-01 | Breast | breast invasive carcinoma | Female | >=65 | I/II | Unknown | Unknown | SD |
| AHR | SNV | Missense_Mutation | novel | c.1973N>G | p.Gln658Arg | p.Q658R | P35869 | protein_coding | tolerated_low_confidence(0.37) | benign(0.001) | TCGA-EW-A6SA-01 | Breast | breast invasive carcinoma | Male | <65 | I/II | Unknown | Unknown | SD |
| AHR | insertion | Nonsense_Mutation | novel | c.1594_1595insTGTCACCTATGCTGGAATGCAGTGGCACAAATGTGGCTCACTG | p.Gln532LeufsTer15 | p.Q532Lfs*15 | P35869 | protein_coding | | | TCGA-AO-A0JB-01 | Breast | breast invasive carcinoma | Female | <65 | III/IV | Chemotherapy | cyclophosphamide | SD |
| AHR | insertion | Frame_Shift_Ins | novel | c.2538_2539insCATAATGTCAGTAACTGCTGTC | p.Phe847HisfsTer24 | p.F847Hfs*24 | P35869 | protein_coding | | | TCGA-B6-A0RG-01 | Breast | breast invasive carcinoma | Female | <65 | I/II | Unknown | Unknown | SD |
| AHR | SNV | Missense_Mutation | novel | c.112C>T | p.Arg38Trp | p.R38W | P35869 | protein_coding | deleterious(0) | probably_damaging(1) | TCGA-C5-A8XH-01 | Cervix | cervical & endocervical cancer | Female | <65 | I/II | Unknown | Unknown | SD |
| AHR | SNV | Missense_Mutation | | c.1379N>G | p.Met460Arg | p.M460R | P35869 | protein_coding | deleterious(0.02) | possibly_damaging(0.52) | TCGA-AA-3715-01 | Colorectum | colon adenocarcinoma | Male | >=65 | I/II | Unknown | Unknown | PD |
| AHR | SNV | Missense_Mutation | rs769847453 | c.914N>A | p.Arg305Lys | p.R305K | P35869 | protein_coding | tolerated(1) | benign(0) | TCGA-AA-3866-01 | Colorectum | colon adenocarcinoma | Female | >=65 | I/II | Unknown | Unknown | SD |
| AHR | SNV | Missense_Mutation | novel | c.1510G>A | p.Gly504Arg | p.G504R | P35869 | protein_coding | deleterious(0.02) | benign(0.053) | TCGA-AA-3939-01 | Colorectum | colon adenocarcinoma | Male | >=65 | I/II | Unknown | Unknown | SD |
| AHR | SNV | Missense_Mutation | novel | c.1172N>T | p.Gly391Val | p.G391V | P35869 | protein_coding | deleterious(0) | probably_damaging(0.994) | TCGA-AZ-4315-01 | Colorectum | colon adenocarcinoma | Male | <65 | I/II | Unknown | Unknown | SD |
| Entrez ID | Symbol | Category | Interaction Types | Drug Claim Name | Drug Name | PMIDs |
| 196 | AHR | NUCLEAR HORMONE RECEPTOR, TRANSCRIPTION FACTOR COMPLEX, TRANSCRIPTION FACTOR, ENZYME, DRUGGABLE GENOME | | 1-NAPHTHYLISOTHIOCYANATE | 1-NAPHTHYLISOTHIOCYANATE | |
| 196 | AHR | NUCLEAR HORMONE RECEPTOR, TRANSCRIPTION FACTOR COMPLEX, TRANSCRIPTION FACTOR, ENZYME, DRUGGABLE GENOME | | CHRYSENE | CHRYSENE | |
| 196 | AHR | NUCLEAR HORMONE RECEPTOR, TRANSCRIPTION FACTOR COMPLEX, TRANSCRIPTION FACTOR, ENZYME, DRUGGABLE GENOME | | methylcholanthrene | | 17481570 |
| 196 | AHR | NUCLEAR HORMONE RECEPTOR, TRANSCRIPTION FACTOR COMPLEX, TRANSCRIPTION FACTOR, ENZYME, DRUGGABLE GENOME | | DICHLON | DICHLON | |
| 196 | AHR | NUCLEAR HORMONE RECEPTOR, TRANSCRIPTION FACTOR COMPLEX, TRANSCRIPTION FACTOR, ENZYME, DRUGGABLE GENOME | | omeprazole | OMEPRAZOLE | 15860653 |
| 196 | AHR | NUCLEAR HORMONE RECEPTOR, TRANSCRIPTION FACTOR COMPLEX, TRANSCRIPTION FACTOR, ENZYME, DRUGGABLE GENOME | | CARBARIL | CARBARIL | |
| 196 | AHR | NUCLEAR HORMONE RECEPTOR, TRANSCRIPTION FACTOR COMPLEX, TRANSCRIPTION FACTOR, ENZYME, DRUGGABLE GENOME | | DESMEDIPHAM | DESMEDIPHAM | |
| 196 | AHR | NUCLEAR HORMONE RECEPTOR, TRANSCRIPTION FACTOR COMPLEX, TRANSCRIPTION FACTOR, ENZYME, DRUGGABLE GENOME | | SALICYLANILIDE | SALICYLANILIDE | |
| 196 | AHR | NUCLEAR HORMONE RECEPTOR, TRANSCRIPTION FACTOR COMPLEX, TRANSCRIPTION FACTOR, ENZYME, DRUGGABLE GENOME | | DIFLUBENZURON | DIFLUBENZURON | |
| 196 | AHR | NUCLEAR HORMONE RECEPTOR, TRANSCRIPTION FACTOR COMPLEX, TRANSCRIPTION FACTOR, ENZYME, DRUGGABLE GENOME | | 2-AMINO-ANTHRAQUINONE | CHEMBL84685 | |


