
|
|||||
|
 | |
| |
| |
| |
| |
| |
|
Gene: AHNAK2 |
Gene summary for AHNAK2 |
| Gene information | Species | Human | Gene symbol | AHNAK2 | Gene ID | 113146 |
| Gene name | AHNAK nucleoprotein 2 | |
| Gene Alias | C14orf78 | |
| Cytomap | 14q32.33 | |
| Gene Type | protein-coding | GO ID | GO:0006139 | UniProtAcc | Q8IVF2 |
Top |
Malignant transformation analysis |
| Identification of the aberrant gene expression in precancerous and cancerous lesions by comparing the gene expression of stem-like cells in diseased tissues with normal stem cells |
| Entrez ID | Symbol | Replicates | Species | Organ | Tissue | Adj P-value | Log2FC | Malignancy |
| 113146 | AHNAK2 | CA_HPV_1 | Human | Cervix | CC | 1.75e-11 | -2.43e-01 | 0.0264 |
| 113146 | AHNAK2 | CA_HPV_2 | Human | Cervix | CC | 4.01e-04 | 3.64e-01 | 0.0391 |
| 113146 | AHNAK2 | CA_HPV_3 | Human | Cervix | CC | 2.53e-05 | 3.23e-01 | 0.0414 |
| 113146 | AHNAK2 | HSIL_HPV_1 | Human | Cervix | HSIL_HPV | 1.15e-02 | -2.26e-01 | 0.0116 |
| 113146 | AHNAK2 | CCI_1 | Human | Cervix | CC | 3.46e-04 | 6.16e-01 | 0.528 |
| 113146 | AHNAK2 | Tumor | Human | Cervix | CC | 1.91e-17 | 5.35e-01 | 0.1241 |
| 113146 | AHNAK2 | sample3 | Human | Cervix | CC | 1.74e-28 | 6.54e-01 | 0.1387 |
| 113146 | AHNAK2 | T3 | Human | Cervix | CC | 1.62e-23 | 6.27e-01 | 0.1389 |
| 113146 | AHNAK2 | LZE4T | Human | Esophagus | ESCC | 8.91e-23 | 1.05e+00 | 0.0811 |
| 113146 | AHNAK2 | LZE5T | Human | Esophagus | ESCC | 3.84e-03 | 3.95e-01 | 0.0514 |
| 113146 | AHNAK2 | LZE20T | Human | Esophagus | ESCC | 7.10e-03 | 4.81e-01 | 0.0662 |
| 113146 | AHNAK2 | P1T-E | Human | Esophagus | ESCC | 3.40e-05 | 4.75e-01 | 0.0875 |
| 113146 | AHNAK2 | P4T-E | Human | Esophagus | ESCC | 5.69e-04 | 8.12e-02 | 0.1323 |
| 113146 | AHNAK2 | P5T-E | Human | Esophagus | ESCC | 2.92e-34 | 6.83e-01 | 0.1327 |
| 113146 | AHNAK2 | P8T-E | Human | Esophagus | ESCC | 7.63e-27 | 5.04e-01 | 0.0889 |
| 113146 | AHNAK2 | P9T-E | Human | Esophagus | ESCC | 6.65e-08 | 2.43e-01 | 0.1131 |
| 113146 | AHNAK2 | P10T-E | Human | Esophagus | ESCC | 3.50e-44 | 9.32e-01 | 0.116 |
| 113146 | AHNAK2 | P11T-E | Human | Esophagus | ESCC | 4.40e-04 | 8.25e-01 | 0.1426 |
| 113146 | AHNAK2 | P12T-E | Human | Esophagus | ESCC | 3.21e-09 | 3.23e-01 | 0.1122 |
| 113146 | AHNAK2 | P15T-E | Human | Esophagus | ESCC | 1.97e-07 | 6.22e-01 | 0.1149 |
| Page: 1 2 3 4 5 6 |
| Tissue | Expression Dynamics | Abbreviation |
| Cervix |  | CC: Cervix cancer |
| HSIL_HPV: HPV-infected high-grade squamous intraepithelial lesions | ||
| N_HPV: HPV-infected normal cervix | ||
| Esophagus |  | ESCC: Esophageal squamous cell carcinoma |
| HGIN: High-grade intraepithelial neoplasias | ||
| LGIN: Low-grade intraepithelial neoplasias | ||
| Liver |  | HCC: Hepatocellular carcinoma |
| NAFLD: Non-alcoholic fatty liver disease | ||
| Oral Cavity | 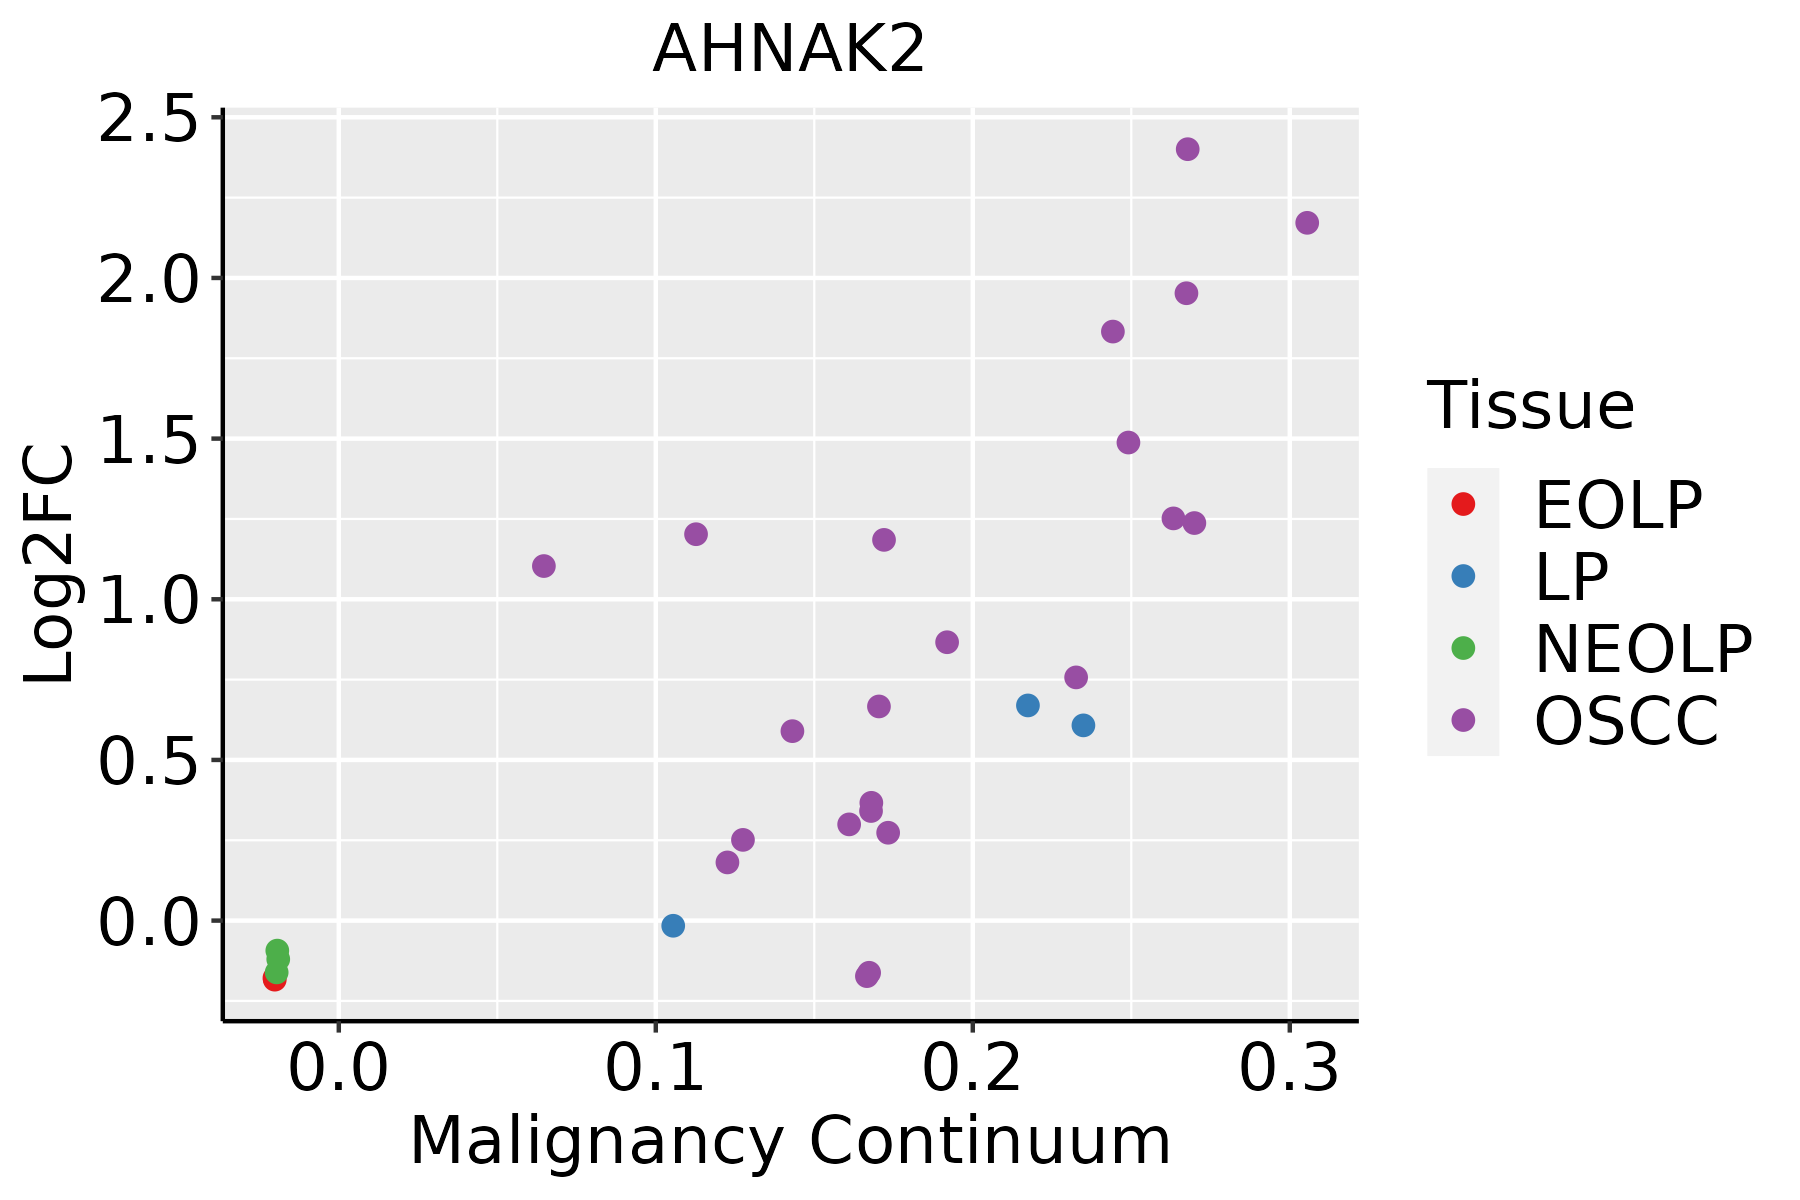 | EOLP: Erosive Oral lichen planus |
| LP: leukoplakia | ||
| NEOLP: Non-erosive oral lichen planus | ||
| OSCC: Oral squamous cell carcinoma | ||
| Skin | 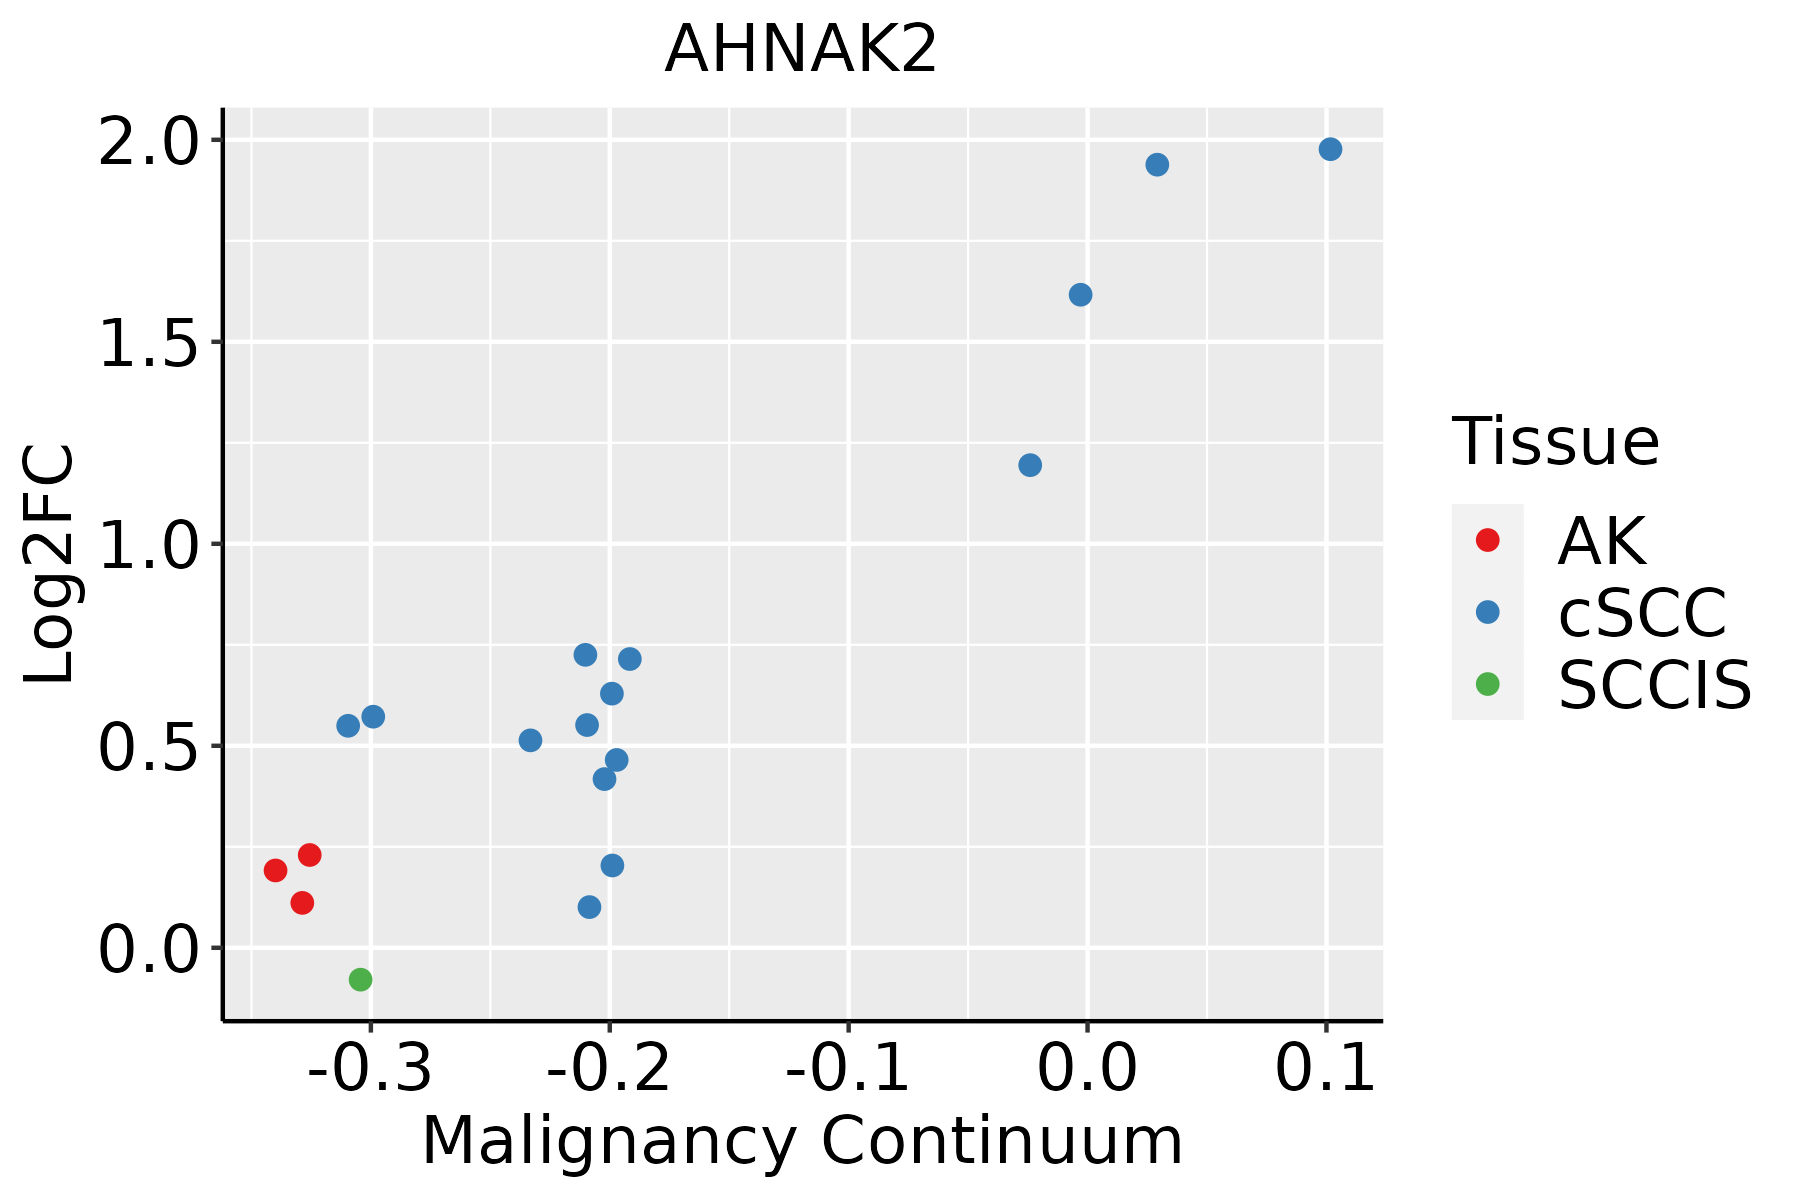 | AK: Actinic keratosis |
| cSCC: Cutaneous squamous cell carcinoma | ||
| SCCIS:squamous cell carcinoma in situ | ||
| Thyroid | 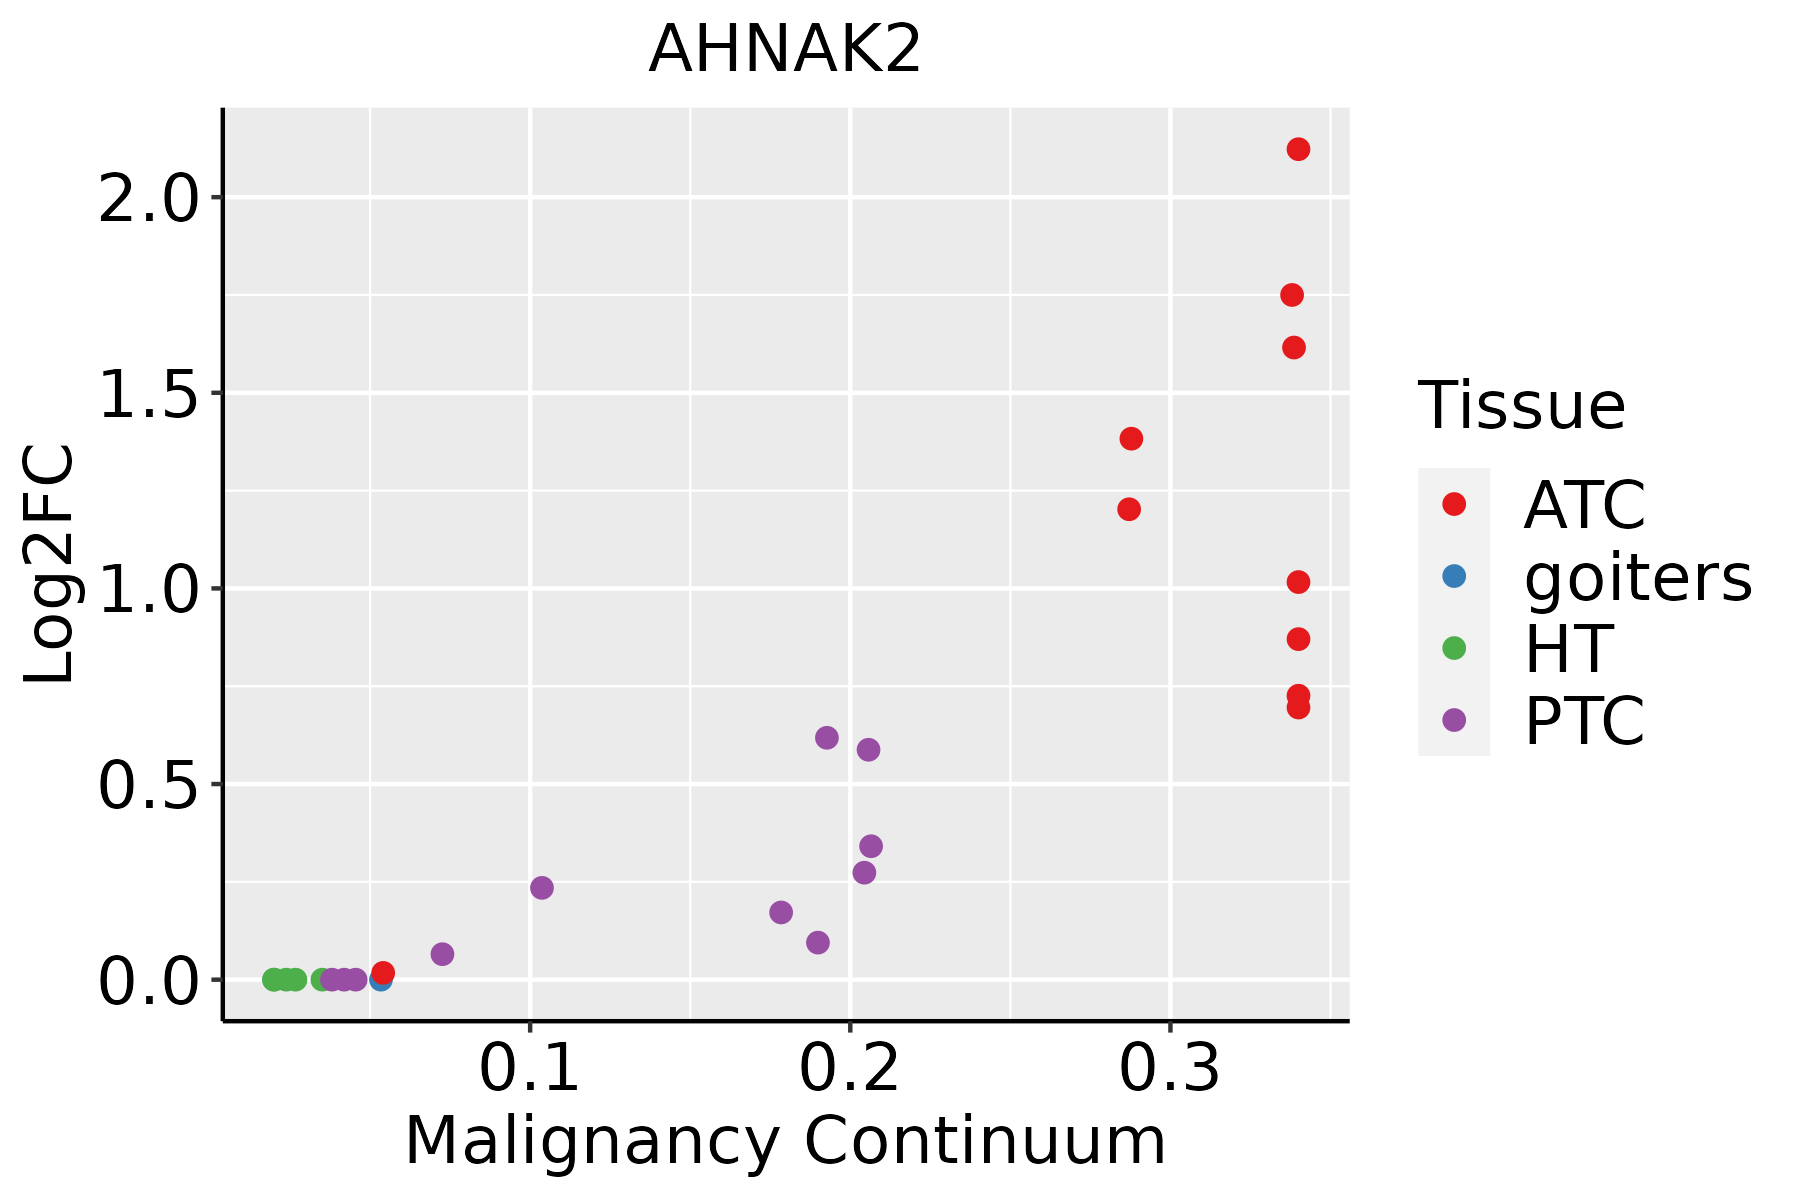 | ATC: Anaplastic thyroid cancer |
| HT: Hashimoto's thyroiditis | ||
| PTC: Papillary thyroid cancer |
| ∗log2FC in expression of this searched gene in stem-like cells from each diseased tissue sample relative to stem-like cells in normal samples in each tissue plotted against the malignancy continuum. Samples are colored based on if they are from different disease stage. |
Top |
Malignant transformation related pathway analysis |
| Find out the enriched GO biological processes and KEGG pathways involved in transition from healthy to precancer to cancer |
| Tissue | Disease Stage | Enriched GO biological Processes |
| Colorectum | AD |  |
| Colorectum | SER |  |
| Colorectum | MSS |  |
| Colorectum | MSI-H |  |
| Colorectum | FAP |  |
| ∗Top 15 enriched GO BP terms are showed in the bar plot of each disease state in each tissue. Each row represents a significant GO biological process which is colored according to the -log10(p.adjust). |
| Page: 1 2 3 4 5 6 7 8 9 |
| GO ID | Tissue | Disease Stage | Description | Gene Ratio | Bg Ratio | pvalue | p.adjust | Count |
| GO:004348410 | Cervix | CC | regulation of RNA splicing | 42/2311 | 148/18723 | 1.25e-07 | 6.24e-06 | 42 |
| GO:000838010 | Cervix | CC | RNA splicing | 76/2311 | 434/18723 | 9.79e-04 | 8.19e-03 | 76 |
| GO:004348415 | Cervix | HSIL_HPV | regulation of RNA splicing | 13/737 | 148/18723 | 5.72e-03 | 4.55e-02 | 13 |
| GO:0008380111 | Esophagus | ESCC | RNA splicing | 336/8552 | 434/18723 | 1.74e-42 | 3.67e-39 | 336 |
| GO:0043484111 | Esophagus | ESCC | regulation of RNA splicing | 116/8552 | 148/18723 | 3.18e-16 | 2.38e-14 | 116 |
| GO:000838022 | Liver | HCC | RNA splicing | 313/7958 | 434/18723 | 1.36e-36 | 1.73e-33 | 313 |
| GO:004348422 | Liver | HCC | regulation of RNA splicing | 113/7958 | 148/18723 | 4.32e-17 | 4.15e-15 | 113 |
| GO:000838020 | Oral cavity | OSCC | RNA splicing | 308/7305 | 434/18723 | 2.43e-42 | 7.70e-39 | 308 |
| GO:004348420 | Oral cavity | OSCC | regulation of RNA splicing | 108/7305 | 148/18723 | 4.25e-17 | 3.69e-15 | 108 |
| GO:004348426 | Oral cavity | EOLP | regulation of RNA splicing | 59/2218 | 148/18723 | 2.64e-18 | 5.27e-15 | 59 |
| GO:000838025 | Oral cavity | EOLP | RNA splicing | 115/2218 | 434/18723 | 2.24e-17 | 3.04e-14 | 115 |
| GO:000838027 | Skin | AK | RNA splicing | 111/1910 | 434/18723 | 1.85e-20 | 5.49e-17 | 111 |
| GO:004348428 | Skin | AK | regulation of RNA splicing | 54/1910 | 148/18723 | 9.66e-18 | 9.53e-15 | 54 |
| GO:0008380112 | Skin | cSCC | RNA splicing | 263/4864 | 434/18723 | 2.45e-53 | 5.13e-50 | 263 |
| GO:004348429 | Skin | cSCC | regulation of RNA splicing | 97/4864 | 148/18723 | 4.66e-24 | 1.08e-21 | 97 |
| GO:0008380113 | Thyroid | PTC | RNA splicing | 273/5968 | 434/18723 | 4.44e-41 | 1.40e-37 | 273 |
| GO:0043484113 | Thyroid | PTC | regulation of RNA splicing | 102/5968 | 148/18723 | 2.03e-20 | 3.21e-18 | 102 |
| GO:000838034 | Thyroid | ATC | RNA splicing | 270/6293 | 434/18723 | 7.50e-35 | 1.19e-31 | 270 |
| GO:004348435 | Thyroid | ATC | regulation of RNA splicing | 100/6293 | 148/18723 | 2.75e-17 | 2.72e-15 | 100 |
| Page: 1 |
| Pathway ID | Tissue | Disease Stage | Description | Gene Ratio | Bg Ratio | pvalue | p.adjust | qvalue | Count |
| hsa0513220 | Cervix | CC | Salmonella infection | 74/1267 | 249/8465 | 1.33e-09 | 2.54e-08 | 1.50e-08 | 74 |
| hsa05132110 | Cervix | CC | Salmonella infection | 74/1267 | 249/8465 | 1.33e-09 | 2.54e-08 | 1.50e-08 | 74 |
| hsa0513225 | Cervix | HSIL_HPV | Salmonella infection | 34/459 | 249/8465 | 5.03e-07 | 1.13e-05 | 9.17e-06 | 34 |
| hsa0513235 | Cervix | HSIL_HPV | Salmonella infection | 34/459 | 249/8465 | 5.03e-07 | 1.13e-05 | 9.17e-06 | 34 |
| hsa05132211 | Esophagus | ESCC | Salmonella infection | 191/4205 | 249/8465 | 6.51e-19 | 5.45e-17 | 2.79e-17 | 191 |
| hsa05132310 | Esophagus | ESCC | Salmonella infection | 191/4205 | 249/8465 | 6.51e-19 | 5.45e-17 | 2.79e-17 | 191 |
| hsa0513242 | Liver | HCC | Salmonella infection | 178/4020 | 249/8465 | 5.90e-15 | 1.98e-13 | 1.10e-13 | 178 |
| hsa0513252 | Liver | HCC | Salmonella infection | 178/4020 | 249/8465 | 5.90e-15 | 1.98e-13 | 1.10e-13 | 178 |
| hsa0513230 | Oral cavity | OSCC | Salmonella infection | 174/3704 | 249/8465 | 2.67e-17 | 1.49e-15 | 7.58e-16 | 174 |
| hsa05132114 | Oral cavity | OSCC | Salmonella infection | 174/3704 | 249/8465 | 2.67e-17 | 1.49e-15 | 7.58e-16 | 174 |
| hsa0513245 | Oral cavity | EOLP | Salmonella infection | 78/1218 | 249/8465 | 3.66e-12 | 2.37e-10 | 1.40e-10 | 78 |
| hsa0513255 | Oral cavity | EOLP | Salmonella infection | 78/1218 | 249/8465 | 3.66e-12 | 2.37e-10 | 1.40e-10 | 78 |
| Page: 1 |
Top |
Cell-cell communication analysis |
| Identification of potential cell-cell interactions between two cell types and their ligand-receptor pairs for different disease states |
| Ligand | Receptor | LRpair | Pathway | Tissue | Disease Stage |
| Page: 1 |
Top |
Single-cell gene regulatory network inference analysis |
| Find out the significant the regulons (TFs) and the target genes of each regulon across cell types for different disease states |
| TF | Cell Type | Tissue | Disease Stage | Target Gene | RSS | Regulon Activity |
| ∗The dot plots of a searched regulon are shown for all cell subpopulations in each disease state of each tissue based on the regulon specific score inferred using pySCENIC and by calculating the average expression. |
| Page: 1 |
Top |
Somatic mutation of malignant transformation related genes |
| Annotation of somatic variants for genes involved in malignant transformation |
| Hugo Symbol | Variant Class | Variant Classification | dbSNP RS | HGVSc | HGVSp | HGVSp Short | SWISSPROT | BIOTYPE | SIFT | PolyPhen | Tumor Sample Barcode | Tissue | Histology | Sex | Age | Stage | Therapy Types | Drugs | Outcome |
| AHNAK2 | SNV | Missense_Mutation | rs755020096 | c.7546G>A | p.Asp2516Asn | p.D2516N | Q8IVF2 | protein_coding | tolerated(0.06) | possibly_damaging(0.74) | TCGA-A7-A3IZ-01 | Breast | breast invasive carcinoma | Female | <65 | I/II | Chemotherapy | cytoxan | SD |
| AHNAK2 | SNV | Missense_Mutation | novel | c.1111N>C | p.Ala371Pro | p.A371P | Q8IVF2 | protein_coding | tolerated(0.19) | possibly_damaging(0.6) | TCGA-A8-A09V-01 | Breast | breast invasive carcinoma | Female | <65 | I/II | Hormone Therapy | tamoxiphen | SD |
| AHNAK2 | SNV | Missense_Mutation | rs760817875 | c.4946N>T | p.Lys1649Met | p.K1649M | Q8IVF2 | protein_coding | tolerated(0.06) | probably_damaging(0.999) | TCGA-AC-A23C-01 | Breast | breast invasive carcinoma | Female | <65 | I/II | Chemotherapy | chemo | CR |
| AHNAK2 | SNV | Missense_Mutation | c.11617N>A | p.Glu3873Lys | p.E3873K | Q8IVF2 | protein_coding | deleterious(0.01) | probably_damaging(0.992) | TCGA-AC-A23H-01 | Breast | breast invasive carcinoma | Female | >=65 | I/II | Unknown | Unknown | PD | |
| AHNAK2 | SNV | Missense_Mutation | c.9007N>A | p.Val3003Met | p.V3003M | Q8IVF2 | protein_coding | tolerated(0.12) | benign(0.424) | TCGA-AC-A23H-01 | Breast | breast invasive carcinoma | Female | >=65 | I/II | Unknown | Unknown | PD | |
| AHNAK2 | SNV | Missense_Mutation | rs372841773 | c.13253C>T | p.Thr4418Met | p.T4418M | Q8IVF2 | protein_coding | deleterious(0.04) | possibly_damaging(0.54) | TCGA-AC-A4ZE-01 | Breast | breast invasive carcinoma | Female | <65 | I/II | Unknown | Unknown | SD |
| AHNAK2 | SNV | Missense_Mutation | novel | c.16517N>G | p.Ile5506Ser | p.I5506S | Q8IVF2 | protein_coding | deleterious(0) | probably_damaging(0.962) | TCGA-AO-A0JM-01 | Breast | breast invasive carcinoma | Female | <65 | I/II | Chemotherapy | doxorubicin | SD |
| AHNAK2 | SNV | Missense_Mutation | novel | c.6954C>G | p.Phe2318Leu | p.F2318L | Q8IVF2 | protein_coding | tolerated(0.11) | probably_damaging(0.99) | TCGA-BH-A0B6-01 | Breast | breast invasive carcinoma | Female | <65 | I/II | Unknown | Unknown | SD |
| AHNAK2 | SNV | Missense_Mutation | rs767704152 | c.961C>T | p.Arg321Trp | p.R321W | Q8IVF2 | protein_coding | deleterious(0) | probably_damaging(0.968) | TCGA-BH-A0HK-01 | Breast | breast invasive carcinoma | Female | >=65 | I/II | Hormone Therapy | arimidex | SD |
| AHNAK2 | SNV | Missense_Mutation | novel | c.8518N>C | p.Glu2840Gln | p.E2840Q | Q8IVF2 | protein_coding | tolerated(0.62) | benign(0.044) | TCGA-BH-A2L8-01 | Breast | breast invasive carcinoma | Female | <65 | I/II | Chemotherapy | cytoxan | CR |
| Page: 1 2 3 4 5 6 7 8 9 10 11 12 13 14 15 16 17 18 19 20 21 22 23 24 25 26 27 28 29 30 31 32 33 34 35 36 37 38 39 40 41 42 43 44 45 46 47 48 49 50 51 52 53 54 55 56 57 58 59 60 61 62 |
Top |
Related drugs of malignant transformation related genes |
| Identification of chemicals and drugs interact with genes involved in malignant transfromation |
| (DGIdb 4.0) |
| Entrez ID | Symbol | Category | Interaction Types | Drug Claim Name | Drug Name | PMIDs |
| Page: 1 |

Copyright 2023-Present -The University of Texas Health Science Center at Houston |