
|
|||||
|
 | |
| |
| |
| |
| |
| |
|
Gene: AHNAK |
Gene summary for AHNAK |
| Gene information | Species | Human | Gene symbol | AHNAK | Gene ID | 79026 |
| Gene name | AHNAK nucleoprotein | |
| Gene Alias | AHNAKRS | |
| Cytomap | 11q12.3 | |
| Gene Type | protein-coding | GO ID | GO:0006139 | UniProtAcc | Q09666 |
Top |
Malignant transformation analysis |
| Identification of the aberrant gene expression in precancerous and cancerous lesions by comparing the gene expression of stem-like cells in diseased tissues with normal stem cells |
| Entrez ID | Symbol | Replicates | Species | Organ | Tissue | Adj P-value | Log2FC | Malignancy |
| 79026 | AHNAK | GSM4909281 | Human | Breast | IDC | 2.36e-02 | -2.80e-01 | 0.21 |
| 79026 | AHNAK | GSM4909282 | Human | Breast | IDC | 6.99e-05 | -2.72e-01 | -0.0288 |
| 79026 | AHNAK | GSM4909286 | Human | Breast | IDC | 1.11e-06 | -3.20e-01 | 0.1081 |
| 79026 | AHNAK | GSM4909293 | Human | Breast | IDC | 3.14e-02 | 2.94e-01 | 0.1581 |
| 79026 | AHNAK | GSM4909294 | Human | Breast | IDC | 1.29e-05 | -2.39e-01 | 0.2022 |
| 79026 | AHNAK | GSM4909296 | Human | Breast | IDC | 1.14e-11 | -1.51e-01 | 0.1524 |
| 79026 | AHNAK | GSM4909297 | Human | Breast | IDC | 1.81e-15 | -2.44e-01 | 0.1517 |
| 79026 | AHNAK | GSM4909298 | Human | Breast | IDC | 5.30e-05 | 3.30e-01 | 0.1551 |
| 79026 | AHNAK | GSM4909299 | Human | Breast | IDC | 2.66e-02 | 3.12e-01 | 0.035 |
| 79026 | AHNAK | GSM4909301 | Human | Breast | IDC | 6.37e-10 | 2.68e-01 | 0.1577 |
| 79026 | AHNAK | GSM4909302 | Human | Breast | IDC | 7.01e-12 | 4.52e-01 | 0.1545 |
| 79026 | AHNAK | GSM4909304 | Human | Breast | IDC | 7.22e-07 | 3.16e-01 | 0.1636 |
| 79026 | AHNAK | GSM4909307 | Human | Breast | IDC | 2.81e-04 | 2.88e-01 | 0.1569 |
| 79026 | AHNAK | GSM4909311 | Human | Breast | IDC | 1.07e-40 | -1.67e-01 | 0.1534 |
| 79026 | AHNAK | GSM4909312 | Human | Breast | IDC | 2.78e-10 | -1.02e-01 | 0.1552 |
| 79026 | AHNAK | GSM4909313 | Human | Breast | IDC | 2.25e-04 | 1.66e-01 | 0.0391 |
| 79026 | AHNAK | GSM4909316 | Human | Breast | IDC | 2.34e-02 | -3.70e-01 | 0.21 |
| 79026 | AHNAK | GSM4909317 | Human | Breast | IDC | 1.75e-22 | 6.22e-01 | 0.1355 |
| 79026 | AHNAK | GSM4909319 | Human | Breast | IDC | 2.50e-46 | -1.42e-01 | 0.1563 |
| 79026 | AHNAK | GSM4909320 | Human | Breast | IDC | 2.22e-02 | -1.08e-01 | 0.1575 |
| Page: 1 2 3 4 5 6 7 8 9 10 11 12 13 |
| Tissue | Expression Dynamics | Abbreviation |
| Breast | 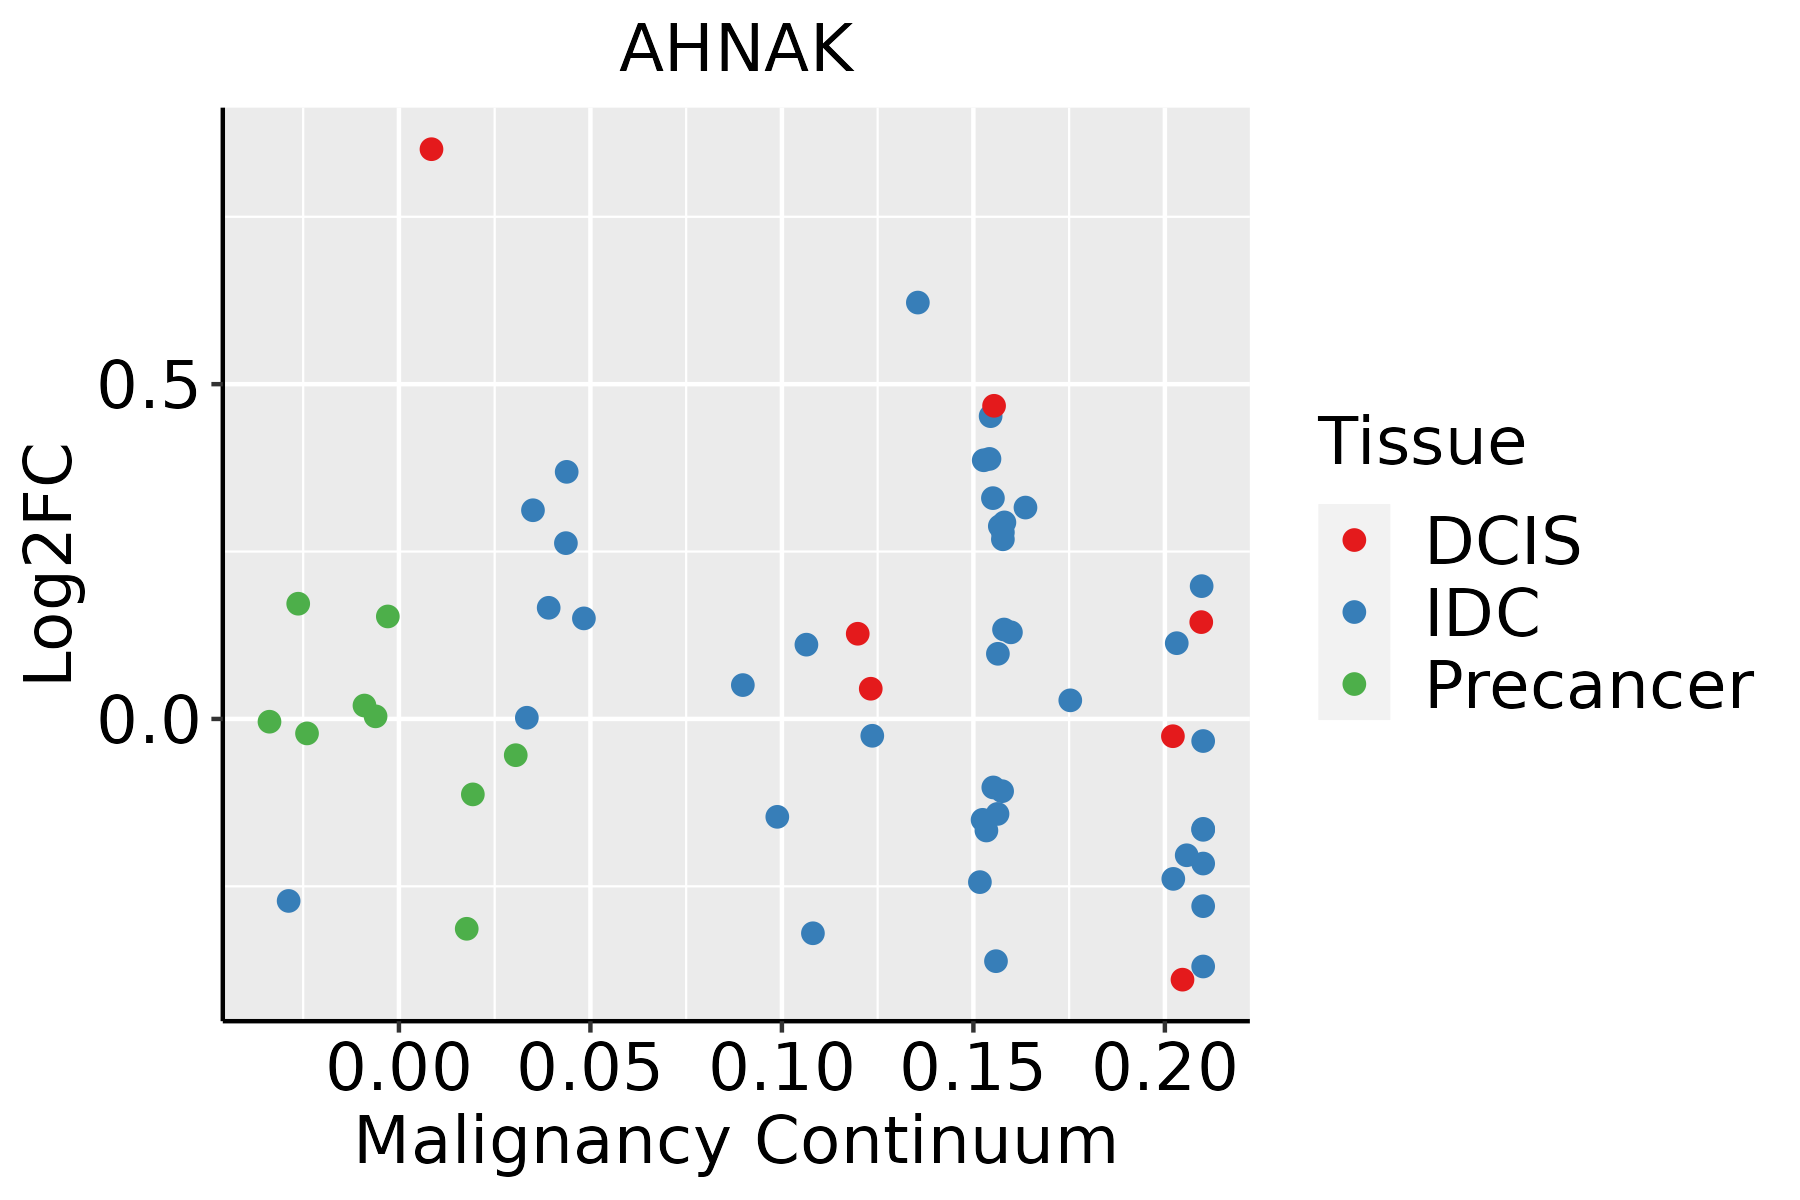 | IDC: Invasive ductal carcinoma |
| DCIS: Ductal carcinoma in situ | ||
| Precancer(BRCA1-mut): Precancerous lesion from BRCA1 mutation carriers | ||
| Cervix |  | CC: Cervix cancer |
| HSIL_HPV: HPV-infected high-grade squamous intraepithelial lesions | ||
| N_HPV: HPV-infected normal cervix | ||
| Colorectum (GSE201348) |  | FAP: Familial adenomatous polyposis |
| CRC: Colorectal cancer | ||
| Colorectum (HTA11) |  | AD: Adenomas |
| SER: Sessile serrated lesions | ||
| MSI-H: Microsatellite-high colorectal cancer | ||
| MSS: Microsatellite stable colorectal cancer | ||
| Endometrium | 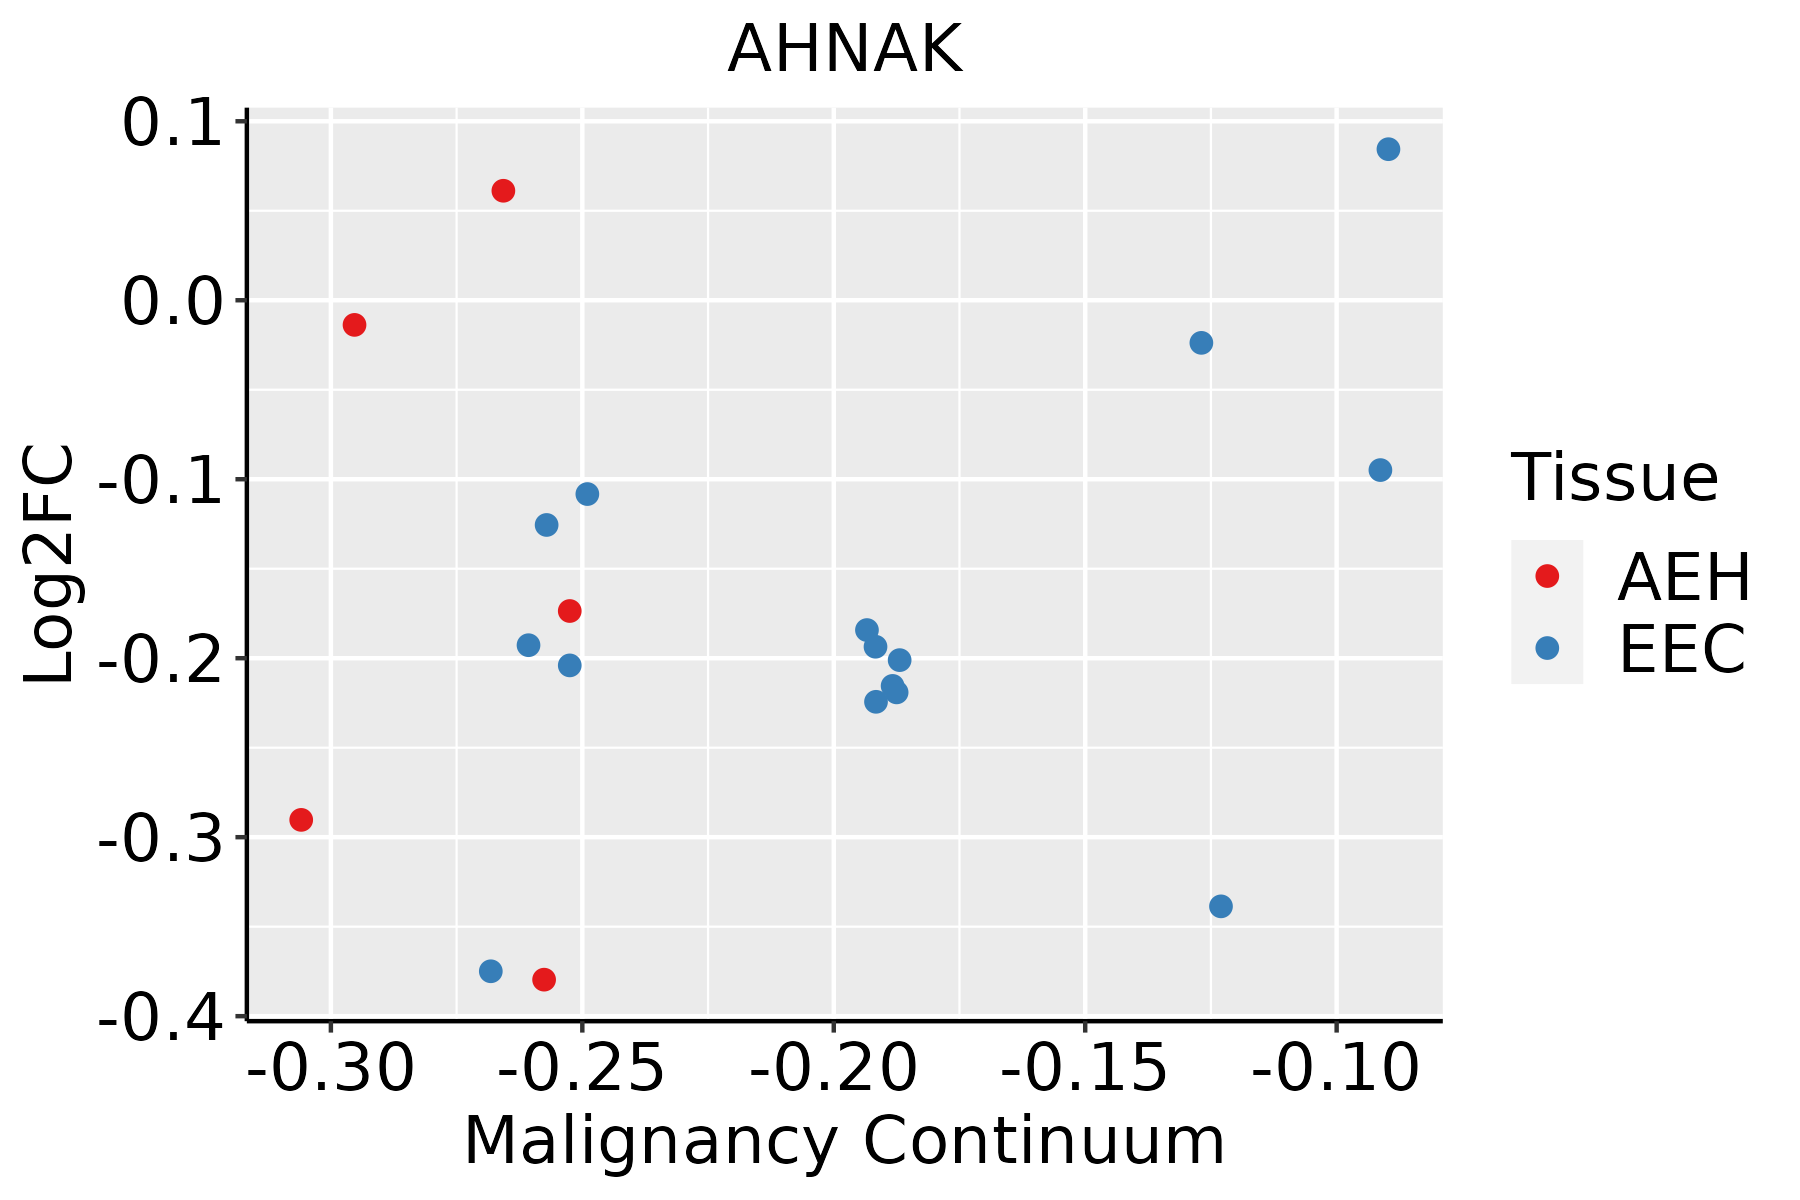 | AEH: Atypical endometrial hyperplasia |
| EEC: Endometrioid Cancer | ||
| Esophagus | 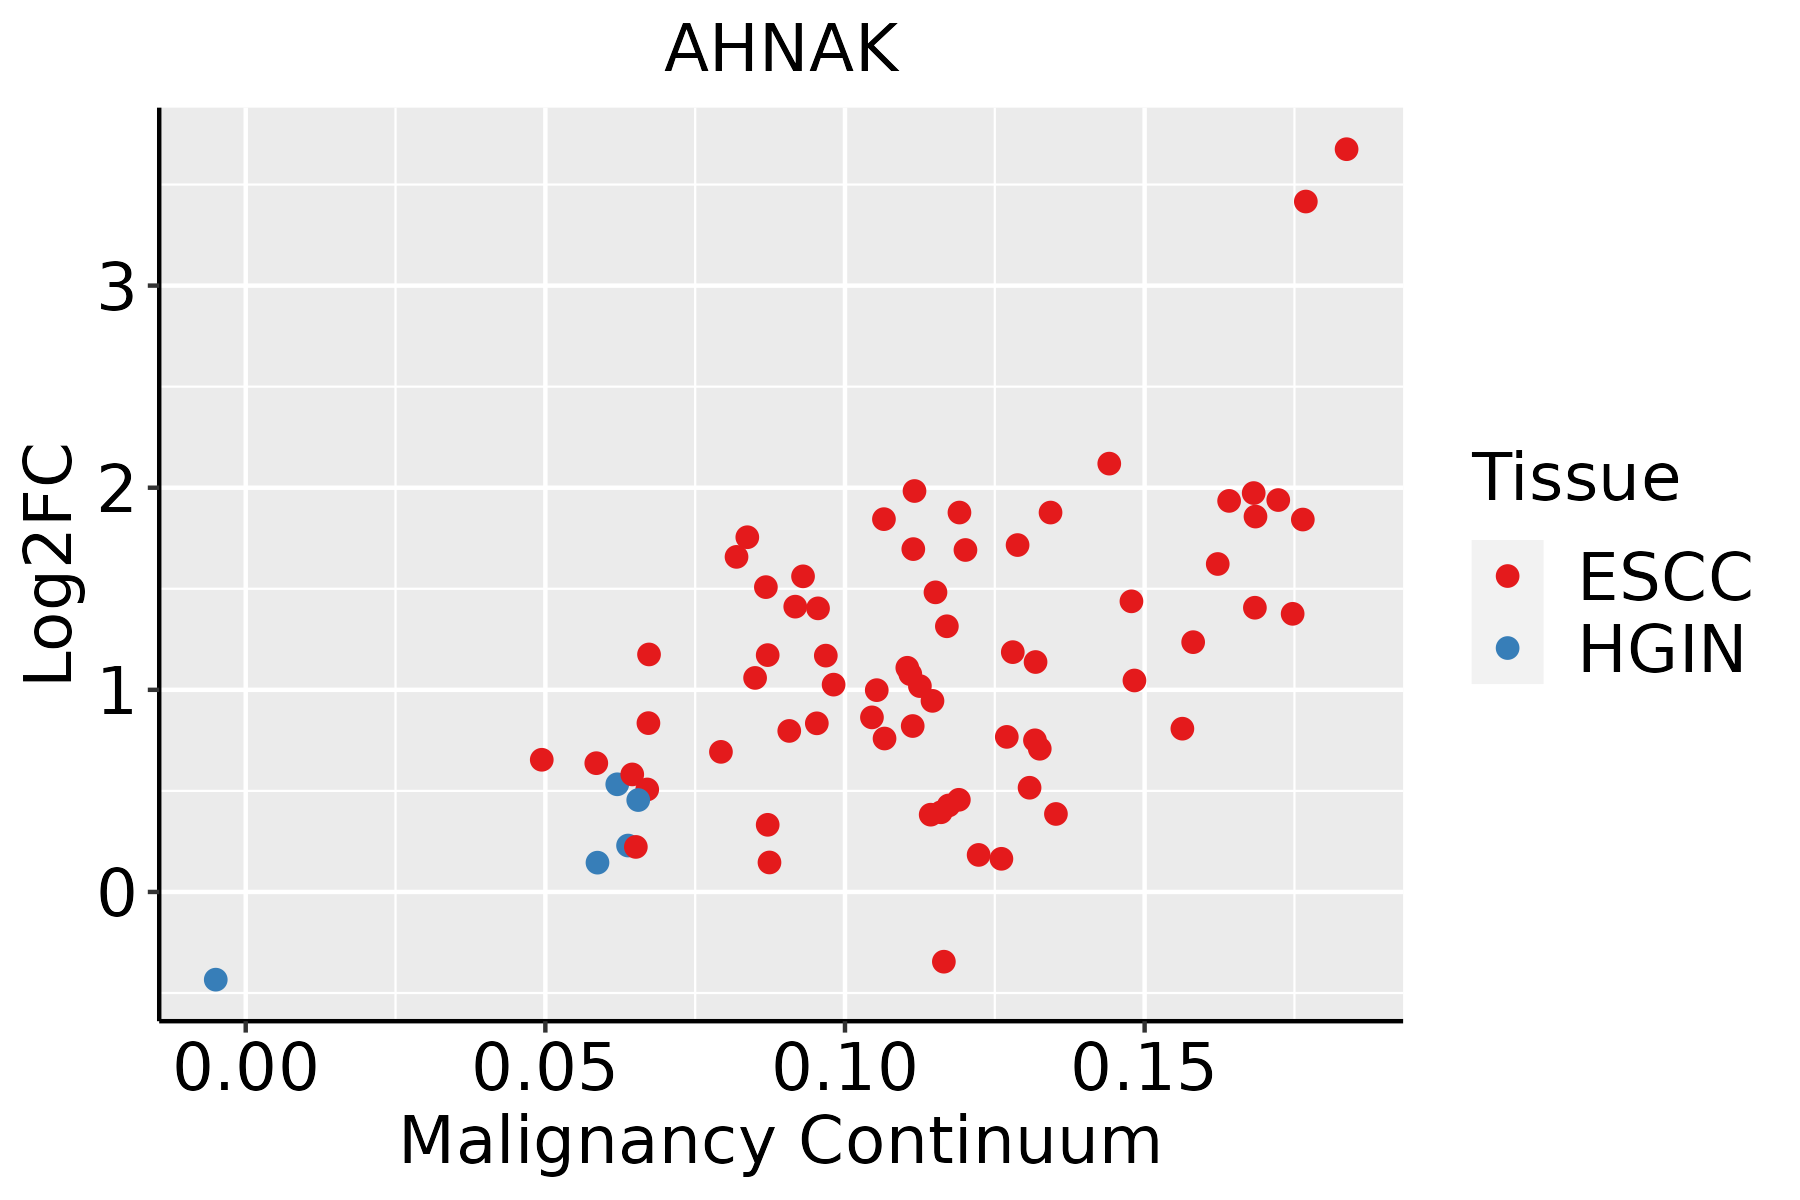 | ESCC: Esophageal squamous cell carcinoma |
| HGIN: High-grade intraepithelial neoplasias | ||
| LGIN: Low-grade intraepithelial neoplasias | ||
| Liver | 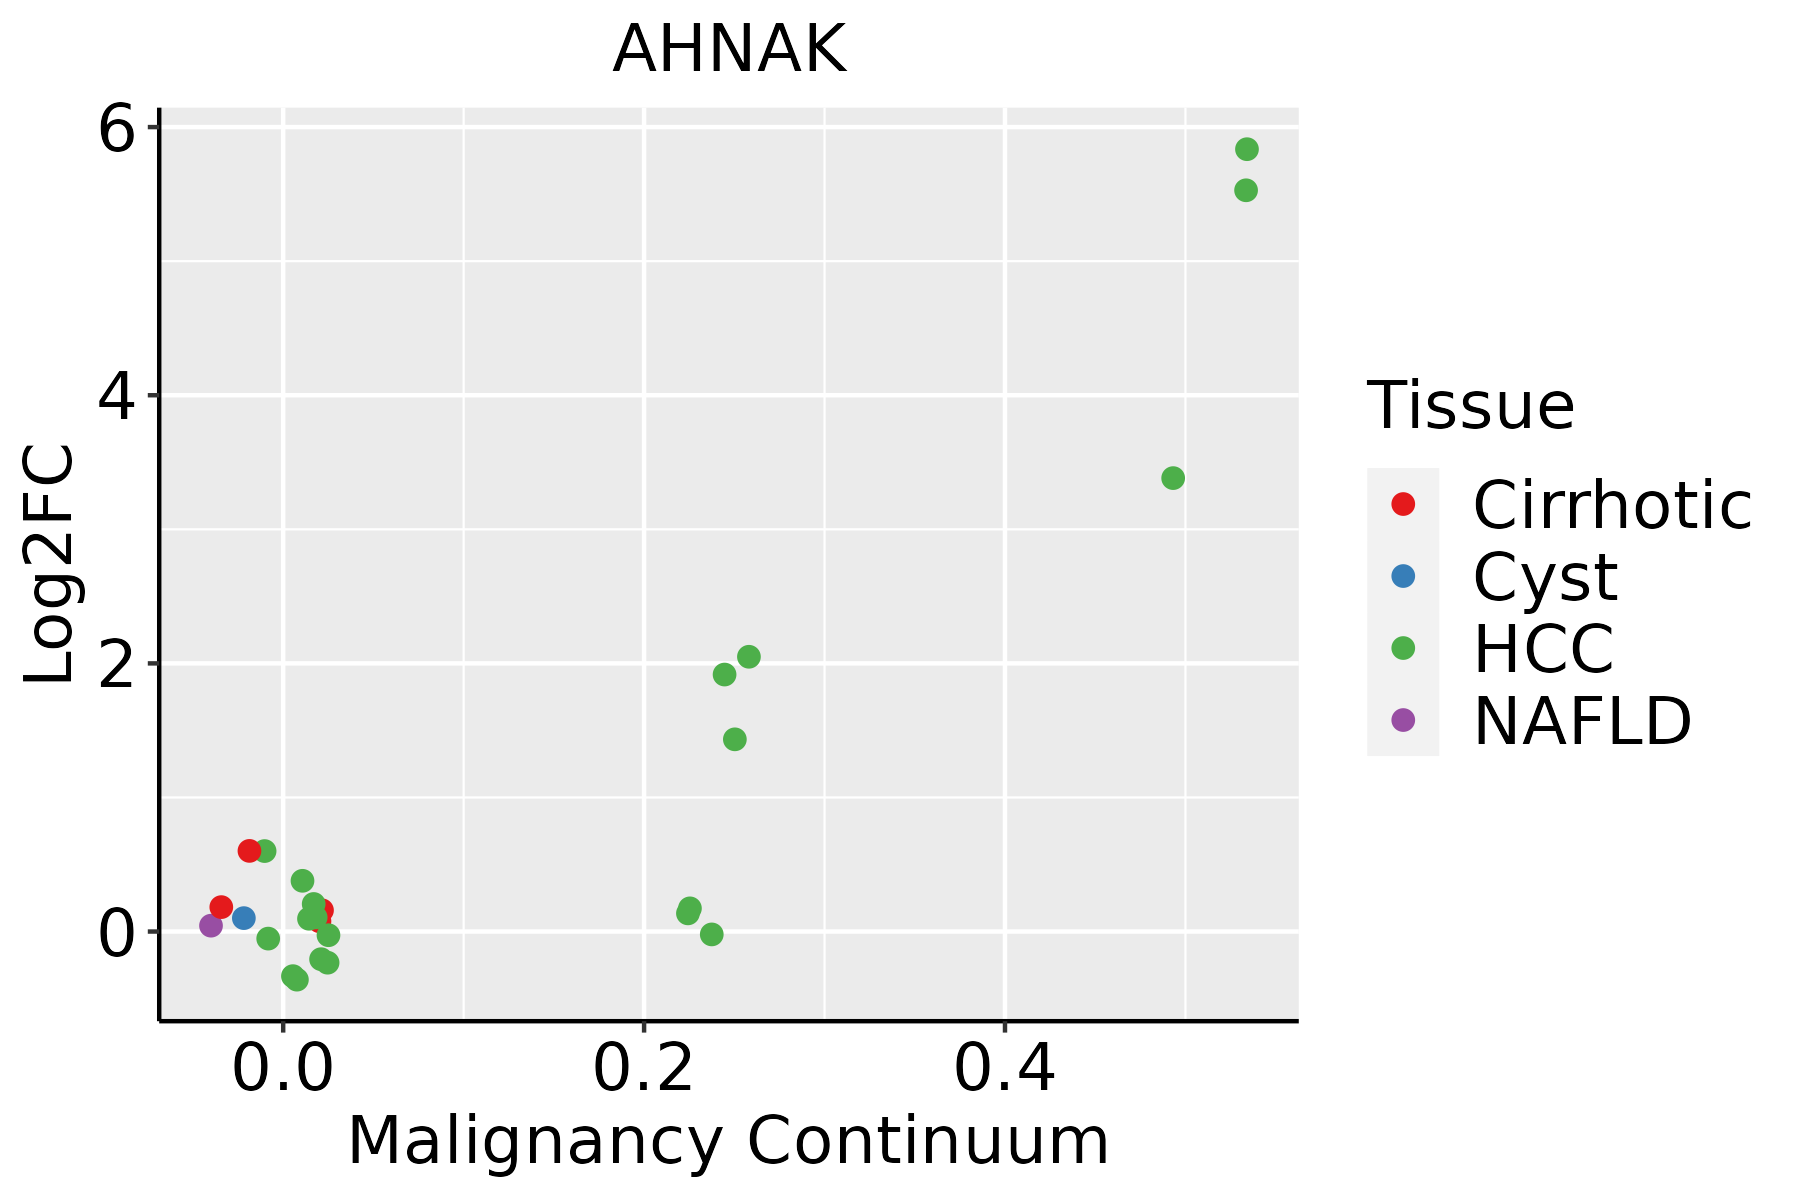 | HCC: Hepatocellular carcinoma |
| NAFLD: Non-alcoholic fatty liver disease | ||
| Oral Cavity | 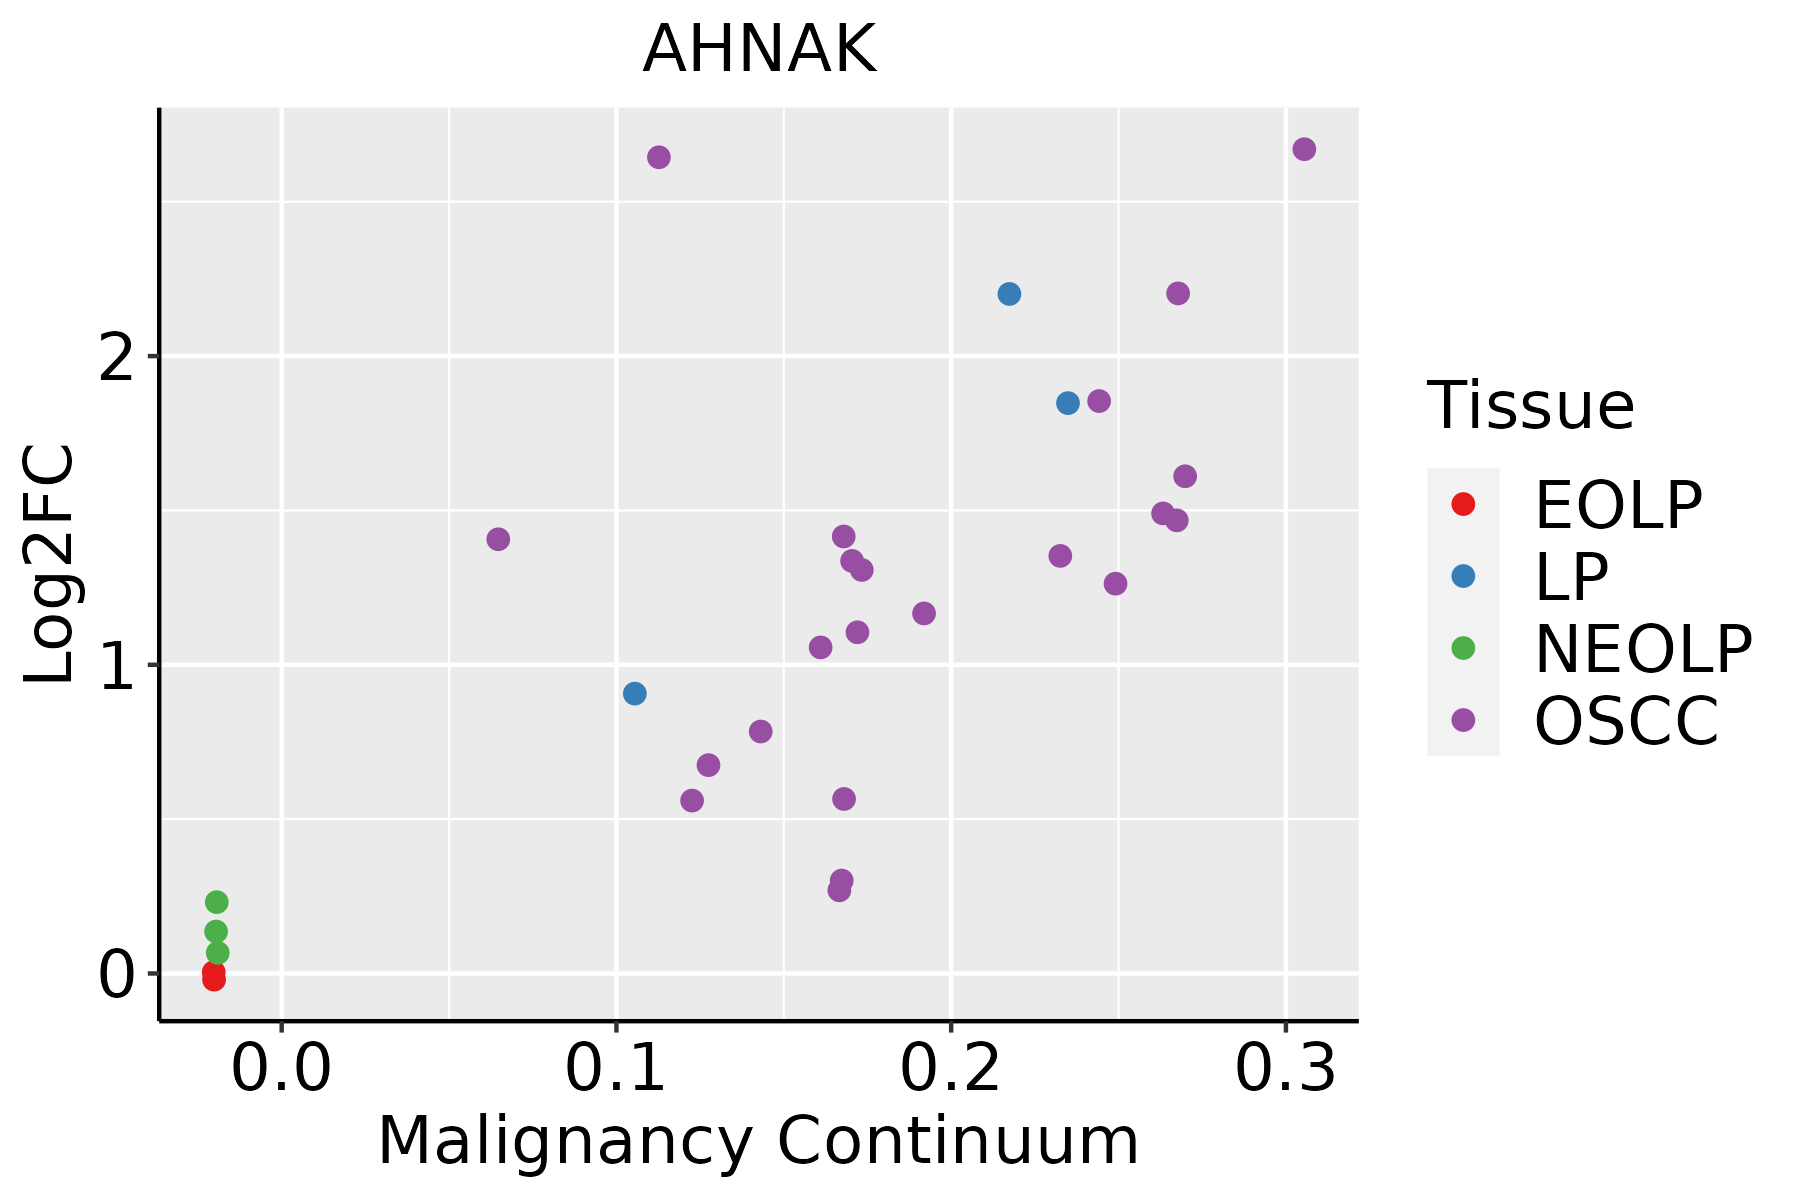 | EOLP: Erosive Oral lichen planus |
| LP: leukoplakia | ||
| NEOLP: Non-erosive oral lichen planus | ||
| OSCC: Oral squamous cell carcinoma | ||
| Prostate | 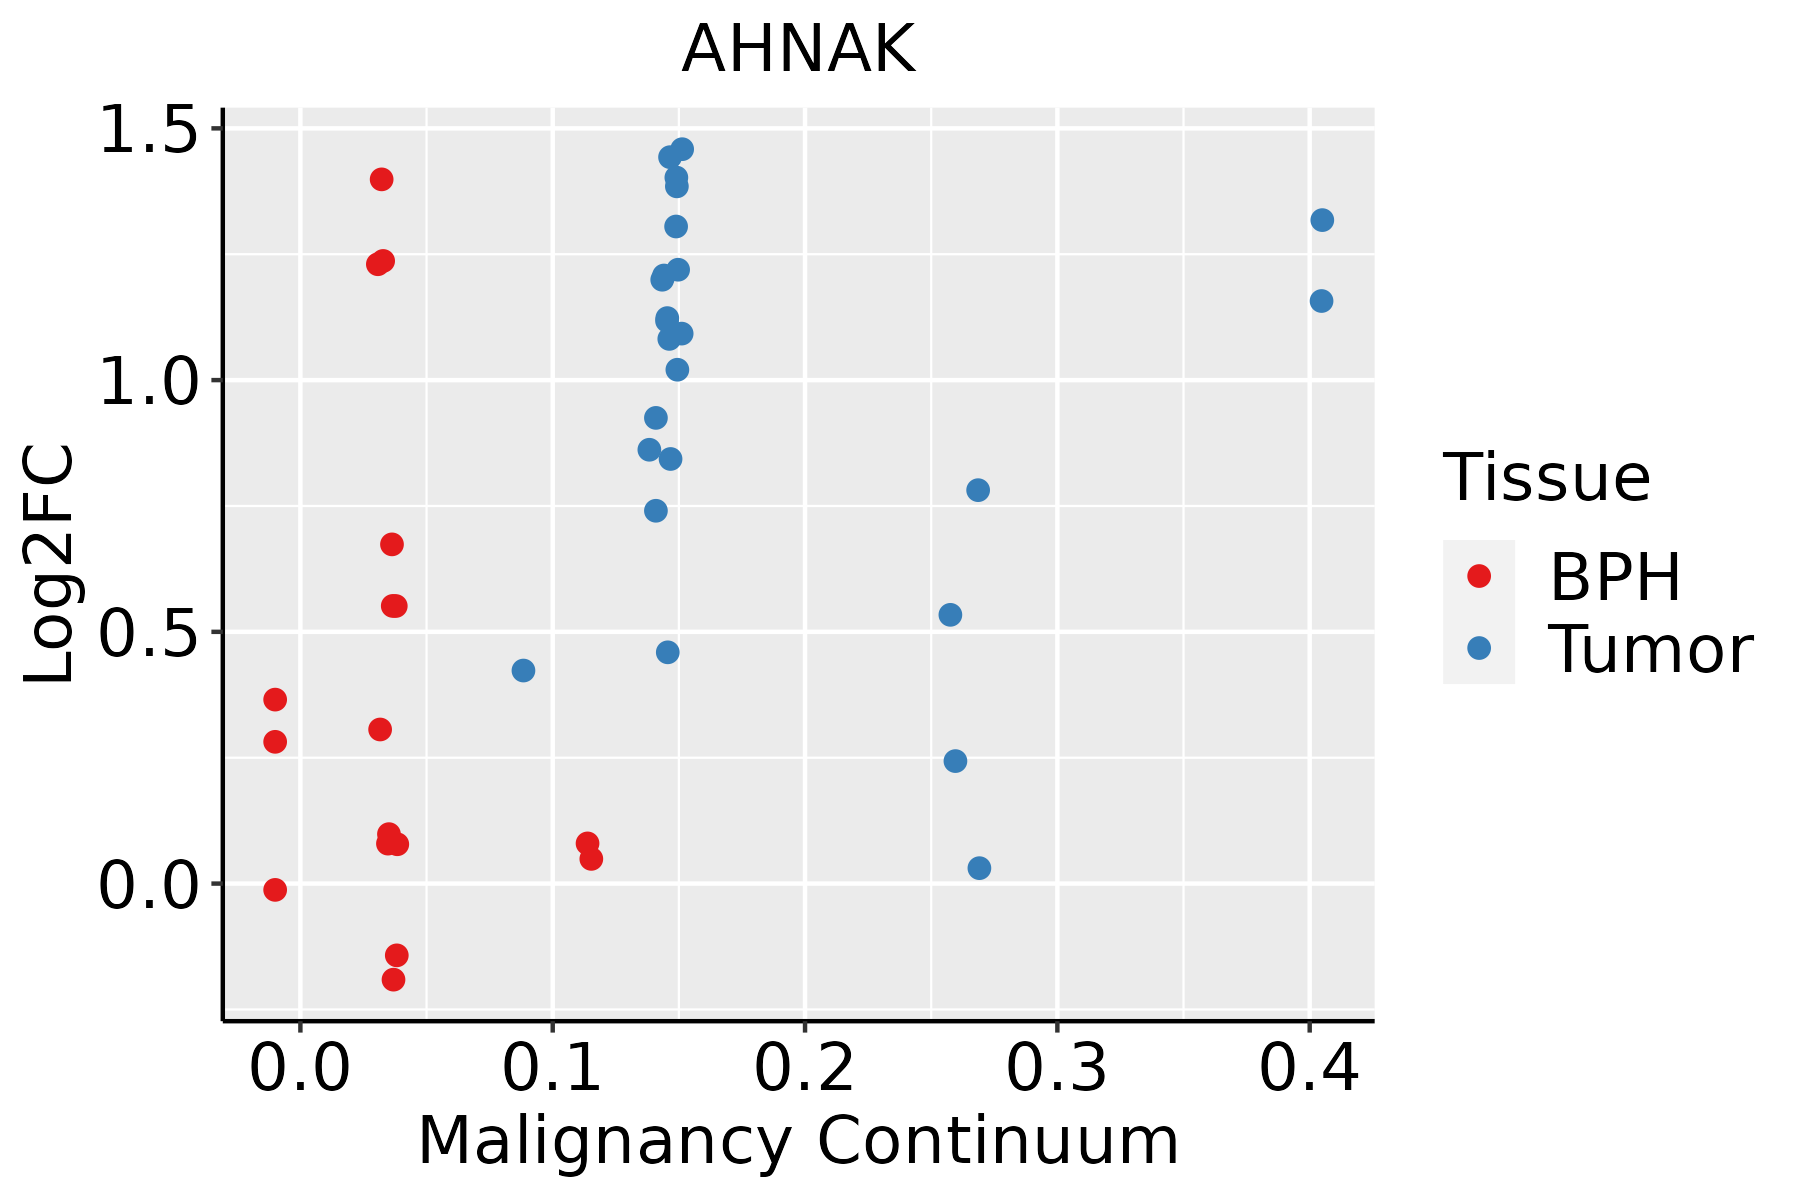 | BPH: Benign Prostatic Hyperplasia |
| Skin |  | AK: Actinic keratosis |
| cSCC: Cutaneous squamous cell carcinoma | ||
| SCCIS:squamous cell carcinoma in situ | ||
| Thyroid | 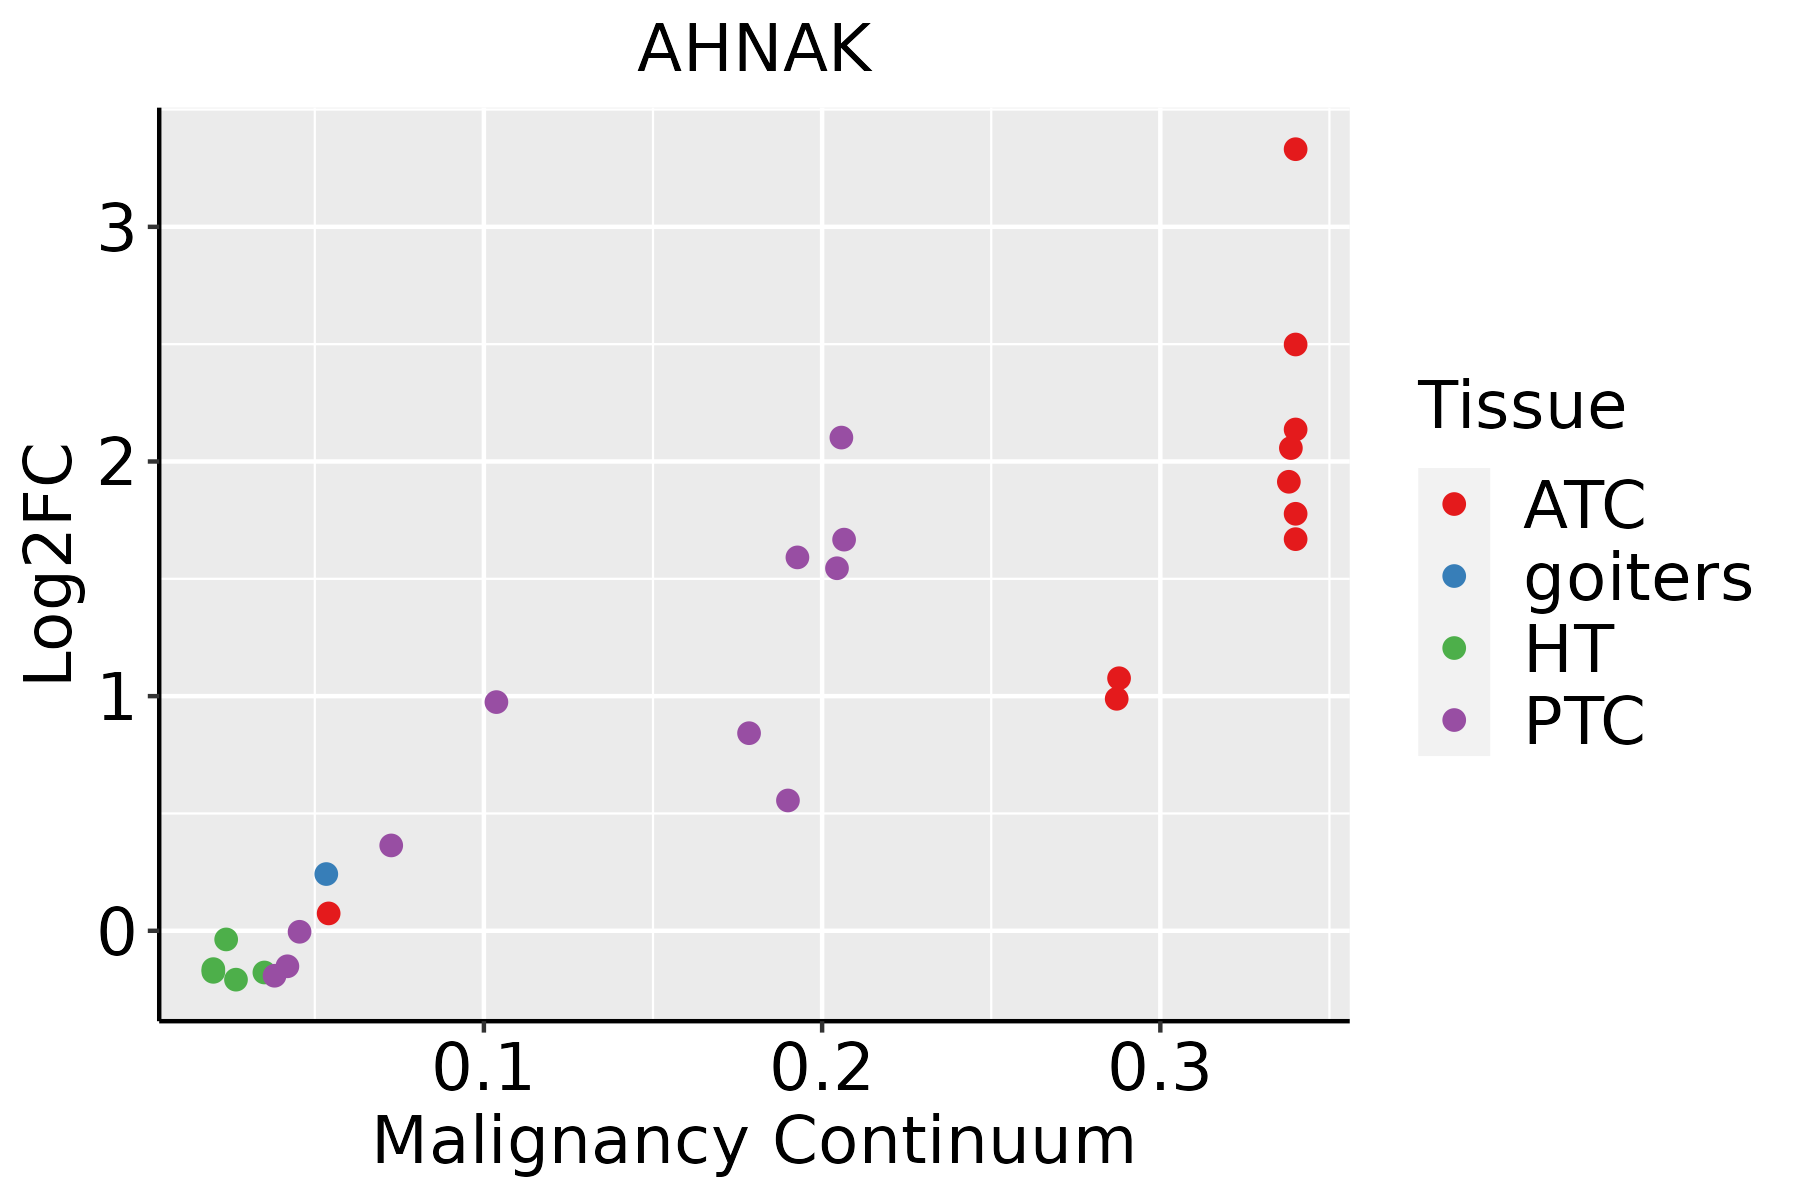 | ATC: Anaplastic thyroid cancer |
| HT: Hashimoto's thyroiditis | ||
| PTC: Papillary thyroid cancer |
| ∗log2FC in expression of this searched gene in stem-like cells from each diseased tissue sample relative to stem-like cells in normal samples in each tissue plotted against the malignancy continuum. Samples are colored based on if they are from different disease stage. |
Top |
Malignant transformation related pathway analysis |
| Find out the enriched GO biological processes and KEGG pathways involved in transition from healthy to precancer to cancer |
| Tissue | Disease Stage | Enriched GO biological Processes |
| Colorectum | AD |  |
| Colorectum | SER |  |
| Colorectum | MSS |  |
| Colorectum | MSI-H |  |
| Colorectum | FAP |  |
| ∗Top 15 enriched GO BP terms are showed in the bar plot of each disease state in each tissue. Each row represents a significant GO biological process which is colored according to the -log10(p.adjust). |
| Page: 1 2 3 4 5 6 7 8 9 |
| GO ID | Tissue | Disease Stage | Description | Gene Ratio | Bg Ratio | pvalue | p.adjust | Count |
| GO:00083809 | Breast | Precancer | RNA splicing | 65/1080 | 434/18723 | 1.27e-12 | 2.53e-10 | 65 |
| GO:00434849 | Breast | Precancer | regulation of RNA splicing | 34/1080 | 148/18723 | 2.66e-12 | 4.75e-10 | 34 |
| GO:00109596 | Breast | Precancer | regulation of metal ion transport | 37/1080 | 406/18723 | 4.07e-03 | 3.22e-02 | 37 |
| GO:00228985 | Breast | Precancer | regulation of transmembrane transporter activity | 27/1080 | 278/18723 | 5.72e-03 | 4.11e-02 | 27 |
| GO:1901019 | Breast | Precancer | regulation of calcium ion transmembrane transporter activity | 12/1080 | 93/18723 | 7.09e-03 | 4.78e-02 | 12 |
| GO:000838014 | Breast | IDC | RNA splicing | 73/1434 | 434/18723 | 1.27e-10 | 1.57e-08 | 73 |
| GO:004348414 | Breast | IDC | regulation of RNA splicing | 36/1434 | 148/18723 | 3.32e-10 | 3.77e-08 | 36 |
| GO:001095913 | Breast | IDC | regulation of metal ion transport | 52/1434 | 406/18723 | 1.76e-04 | 2.97e-03 | 52 |
| GO:002289812 | Breast | IDC | regulation of transmembrane transporter activity | 36/1434 | 278/18723 | 1.35e-03 | 1.40e-02 | 36 |
| GO:0051924 | Breast | IDC | regulation of calcium ion transport | 32/1434 | 255/18723 | 3.94e-03 | 3.22e-02 | 32 |
| GO:00324125 | Breast | IDC | regulation of ion transmembrane transporter activity | 33/1434 | 267/18723 | 4.38e-03 | 3.40e-02 | 33 |
| GO:00324096 | Breast | IDC | regulation of transporter activity | 37/1434 | 310/18723 | 4.77e-03 | 3.66e-02 | 37 |
| GO:000838024 | Breast | DCIS | RNA splicing | 73/1390 | 434/18723 | 3.05e-11 | 5.08e-09 | 73 |
| GO:004348424 | Breast | DCIS | regulation of RNA splicing | 36/1390 | 148/18723 | 1.40e-10 | 1.69e-08 | 36 |
| GO:001095921 | Breast | DCIS | regulation of metal ion transport | 50/1390 | 406/18723 | 2.86e-04 | 4.22e-03 | 50 |
| GO:002289822 | Breast | DCIS | regulation of transmembrane transporter activity | 35/1390 | 278/18723 | 1.50e-03 | 1.51e-02 | 35 |
| GO:003241212 | Breast | DCIS | regulation of ion transmembrane transporter activity | 32/1390 | 267/18723 | 4.97e-03 | 3.72e-02 | 32 |
| GO:003240912 | Breast | DCIS | regulation of transporter activity | 36/1390 | 310/18723 | 5.05e-03 | 3.74e-02 | 36 |
| GO:004348410 | Cervix | CC | regulation of RNA splicing | 42/2311 | 148/18723 | 1.25e-07 | 6.24e-06 | 42 |
| GO:000838010 | Cervix | CC | RNA splicing | 76/2311 | 434/18723 | 9.79e-04 | 8.19e-03 | 76 |
| Page: 1 2 3 4 5 |
| Pathway ID | Tissue | Disease Stage | Description | Gene Ratio | Bg Ratio | pvalue | p.adjust | qvalue | Count |
| hsa0513218 | Breast | Precancer | Salmonella infection | 49/684 | 249/8465 | 2.92e-09 | 6.15e-08 | 4.71e-08 | 49 |
| hsa0513219 | Breast | Precancer | Salmonella infection | 49/684 | 249/8465 | 2.92e-09 | 6.15e-08 | 4.71e-08 | 49 |
| hsa0513224 | Breast | IDC | Salmonella infection | 55/867 | 249/8465 | 2.07e-08 | 4.49e-07 | 3.36e-07 | 55 |
| hsa0513234 | Breast | IDC | Salmonella infection | 55/867 | 249/8465 | 2.07e-08 | 4.49e-07 | 3.36e-07 | 55 |
| hsa0513220 | Cervix | CC | Salmonella infection | 74/1267 | 249/8465 | 1.33e-09 | 2.54e-08 | 1.50e-08 | 74 |
| hsa05132110 | Cervix | CC | Salmonella infection | 74/1267 | 249/8465 | 1.33e-09 | 2.54e-08 | 1.50e-08 | 74 |
| hsa0513225 | Cervix | HSIL_HPV | Salmonella infection | 34/459 | 249/8465 | 5.03e-07 | 1.13e-05 | 9.17e-06 | 34 |
| hsa0513235 | Cervix | HSIL_HPV | Salmonella infection | 34/459 | 249/8465 | 5.03e-07 | 1.13e-05 | 9.17e-06 | 34 |
| hsa05132 | Colorectum | AD | Salmonella infection | 102/2092 | 249/8465 | 7.65e-09 | 1.28e-07 | 8.17e-08 | 102 |
| hsa051321 | Colorectum | AD | Salmonella infection | 102/2092 | 249/8465 | 7.65e-09 | 1.28e-07 | 8.17e-08 | 102 |
| hsa051322 | Colorectum | SER | Salmonella infection | 77/1580 | 249/8465 | 1.56e-06 | 2.35e-05 | 1.71e-05 | 77 |
| hsa051323 | Colorectum | SER | Salmonella infection | 77/1580 | 249/8465 | 1.56e-06 | 2.35e-05 | 1.71e-05 | 77 |
| hsa051324 | Colorectum | MSS | Salmonella infection | 92/1875 | 249/8465 | 5.23e-08 | 9.74e-07 | 5.97e-07 | 92 |
| hsa051325 | Colorectum | MSS | Salmonella infection | 92/1875 | 249/8465 | 5.23e-08 | 9.74e-07 | 5.97e-07 | 92 |
| hsa051328 | Colorectum | FAP | Salmonella infection | 67/1404 | 249/8465 | 2.04e-05 | 2.52e-04 | 1.53e-04 | 67 |
| hsa051329 | Colorectum | FAP | Salmonella infection | 67/1404 | 249/8465 | 2.04e-05 | 2.52e-04 | 1.53e-04 | 67 |
| hsa0513210 | Colorectum | CRC | Salmonella infection | 48/1091 | 249/8465 | 2.43e-03 | 1.69e-02 | 1.15e-02 | 48 |
| hsa0513211 | Colorectum | CRC | Salmonella infection | 48/1091 | 249/8465 | 2.43e-03 | 1.69e-02 | 1.15e-02 | 48 |
| hsa0513226 | Endometrium | AEH | Salmonella infection | 71/1197 | 249/8465 | 1.69e-09 | 3.44e-08 | 2.52e-08 | 71 |
| hsa05132112 | Endometrium | AEH | Salmonella infection | 71/1197 | 249/8465 | 1.69e-09 | 3.44e-08 | 2.52e-08 | 71 |
| Page: 1 2 |
Top |
Cell-cell communication analysis |
| Identification of potential cell-cell interactions between two cell types and their ligand-receptor pairs for different disease states |
| Ligand | Receptor | LRpair | Pathway | Tissue | Disease Stage |
| Page: 1 |
Top |
Single-cell gene regulatory network inference analysis |
| Find out the significant the regulons (TFs) and the target genes of each regulon across cell types for different disease states |
| TF | Cell Type | Tissue | Disease Stage | Target Gene | RSS | Regulon Activity |
| ∗The dot plots of a searched regulon are shown for all cell subpopulations in each disease state of each tissue based on the regulon specific score inferred using pySCENIC and by calculating the average expression. |
| Page: 1 |
Top |
Somatic mutation of malignant transformation related genes |
| Annotation of somatic variants for genes involved in malignant transformation |
| Hugo Symbol | Variant Class | Variant Classification | dbSNP RS | HGVSc | HGVSp | HGVSp Short | SWISSPROT | BIOTYPE | SIFT | PolyPhen | Tumor Sample Barcode | Tissue | Histology | Sex | Age | Stage | Therapy Types | Drugs | Outcome |
| AHNAK | SNV | Missense_Mutation | novel | c.3850G>A | p.Asp1284Asn | p.D1284N | Q09666 | protein_coding | tolerated(0.05) | benign(0.037) | TCGA-3C-AALI-01 | Breast | breast invasive carcinoma | Female | <65 | I/II | Unspecific | Poly E | Complete Response |
| AHNAK | SNV | Missense_Mutation | novel | c.12868N>C | p.Glu4290Gln | p.E4290Q | Q09666 | protein_coding | tolerated(0.09) | benign(0.271) | TCGA-5L-AAT1-01 | Breast | breast invasive carcinoma | Female | <65 | III/IV | Hormone Therapy | letrozol | SD |
| AHNAK | SNV | Missense_Mutation | novel | c.12429N>A | p.Met4143Ile | p.M4143I | Q09666 | protein_coding | tolerated(0.21) | benign(0.012) | TCGA-5L-AAT1-01 | Breast | breast invasive carcinoma | Female | <65 | III/IV | Hormone Therapy | letrozol | SD |
| AHNAK | SNV | Missense_Mutation | rs765543200 | c.4088N>G | p.Lys1363Arg | p.K1363R | Q09666 | protein_coding | tolerated(0.1) | probably_damaging(0.99) | TCGA-A1-A0SK-01 | Breast | breast invasive carcinoma | Female | <65 | I/II | Unknown | Unknown | PD |
| AHNAK | SNV | Missense_Mutation | c.6349N>G | p.Ile2117Val | p.I2117V | Q09666 | protein_coding | tolerated(0.18) | benign(0.156) | TCGA-A2-A0CV-01 | Breast | breast invasive carcinoma | Female | <65 | I/II | Chemotherapy | cytoxan | SD | |
| AHNAK | SNV | Missense_Mutation | novel | c.4201N>A | p.Glu1401Lys | p.E1401K | Q09666 | protein_coding | tolerated(0.07) | benign(0.385) | TCGA-A2-A0YK-01 | Breast | breast invasive carcinoma | Female | <65 | I/II | Chemotherapy | cytoxan | SD |
| AHNAK | SNV | Missense_Mutation | c.4018N>C | p.Asp1340His | p.D1340H | Q09666 | protein_coding | deleterious(0) | probably_damaging(0.951) | TCGA-A2-A0YK-01 | Breast | breast invasive carcinoma | Female | <65 | I/II | Chemotherapy | cytoxan | SD | |
| AHNAK | SNV | Missense_Mutation | c.3898N>A | p.Glu1300Lys | p.E1300K | Q09666 | protein_coding | tolerated(0.09) | benign(0.044) | TCGA-A2-A0YK-01 | Breast | breast invasive carcinoma | Female | <65 | I/II | Chemotherapy | cytoxan | SD | |
| AHNAK | SNV | Missense_Mutation | novel | c.13189N>T | p.Pro4397Ser | p.P4397S | Q09666 | protein_coding | deleterious(0.01) | probably_damaging(0.997) | TCGA-A2-A4RW-01 | Breast | breast invasive carcinoma | Female | <65 | III/IV | Unknown | Unknown | SD |
| AHNAK | SNV | Missense_Mutation | novel | c.7289N>C | p.Glu2430Ala | p.E2430A | Q09666 | protein_coding | deleterious(0.02) | benign(0.225) | TCGA-A2-A4S2-01 | Breast | breast invasive carcinoma | Female | <65 | III/IV | Chemotherapy | adriamycin | CR |
| Page: 1 2 3 4 5 6 7 8 9 10 11 12 13 14 15 16 17 18 19 20 21 22 23 24 25 26 27 28 29 30 31 32 33 34 35 36 37 38 39 40 41 42 43 44 45 46 47 48 49 50 51 52 53 54 55 56 57 58 |
Top |
Related drugs of malignant transformation related genes |
| Identification of chemicals and drugs interact with genes involved in malignant transfromation |
| (DGIdb 4.0) |
| Entrez ID | Symbol | Category | Interaction Types | Drug Claim Name | Drug Name | PMIDs |
| Page: 1 |

Copyright 2023-Present -The University of Texas Health Science Center at Houston |