| Tissue | Expression Dynamics | Abbreviation |
| Colorectum (GSE201348) |  | FAP: Familial adenomatous polyposis |
| CRC: Colorectal cancer |
| Colorectum (HTA11) | 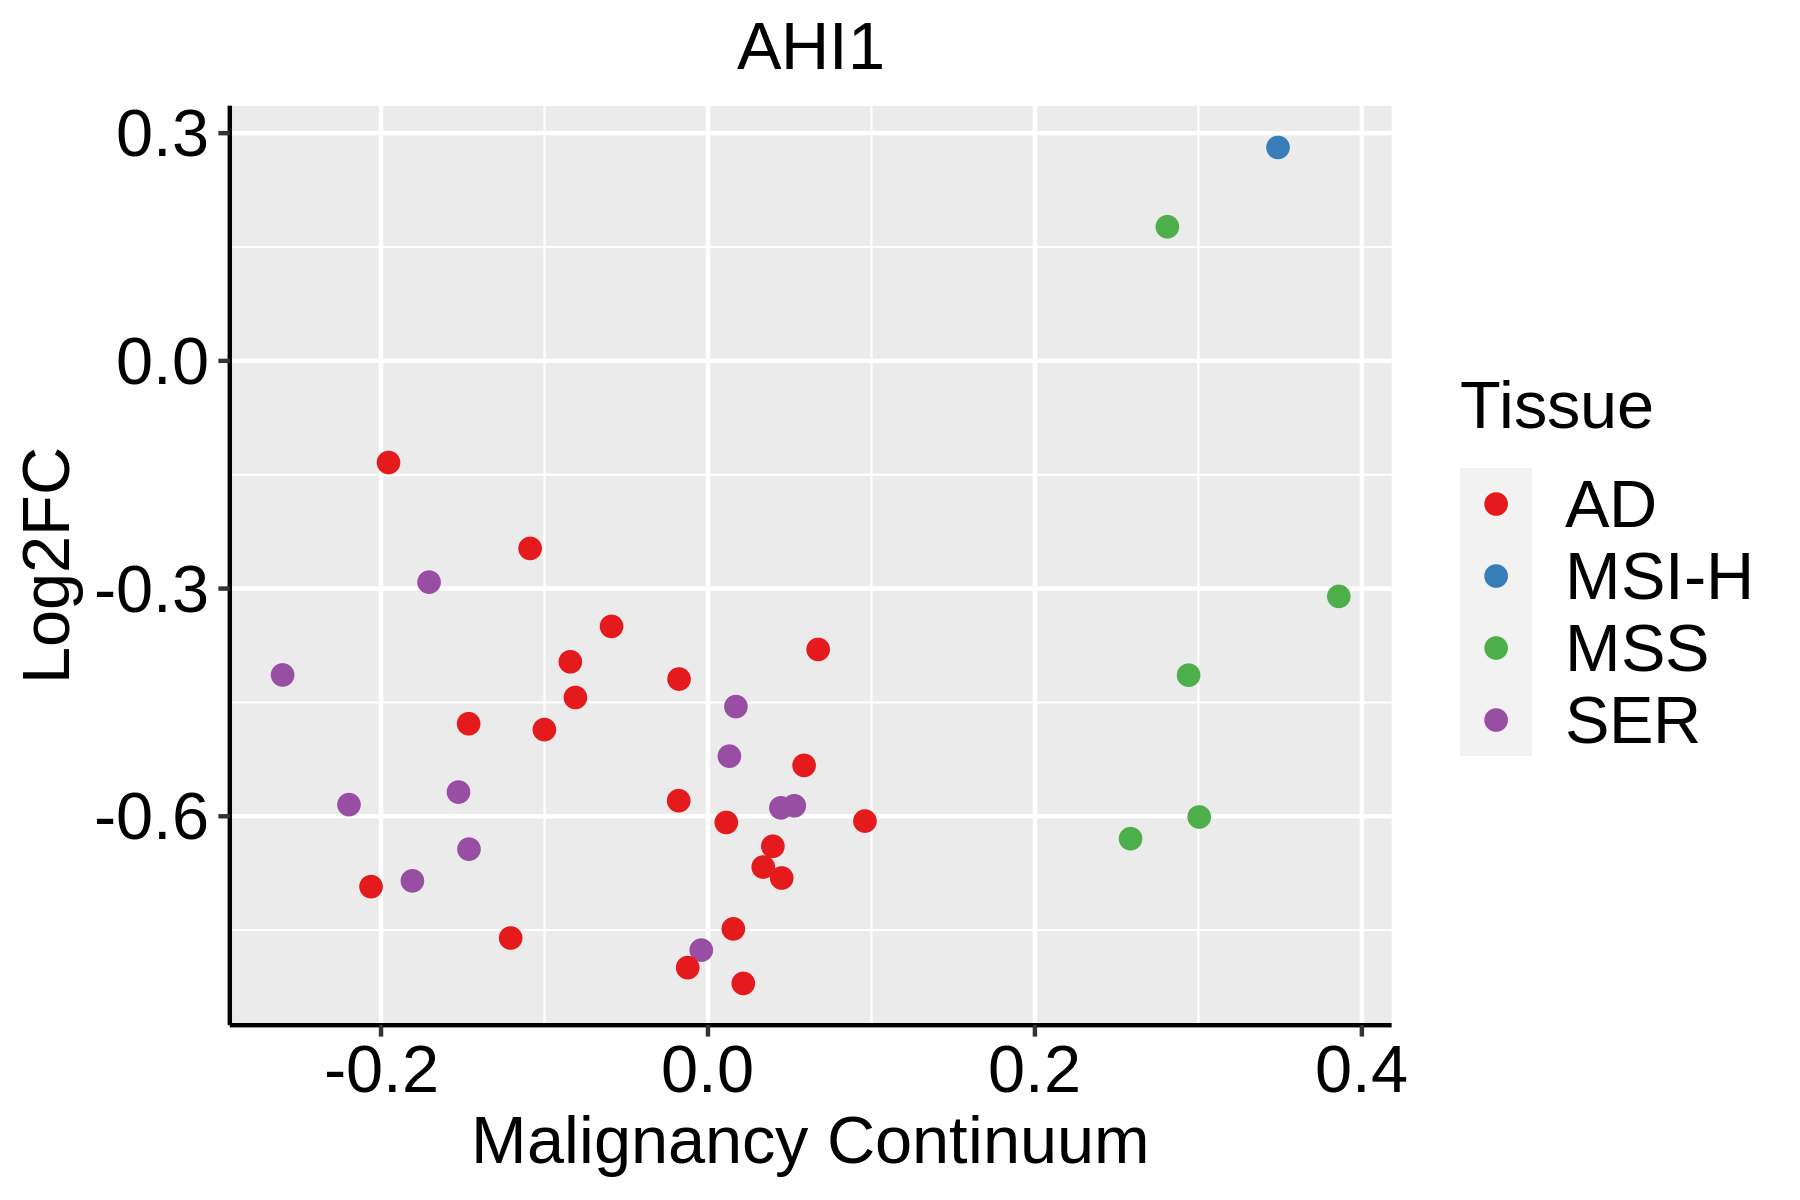 | AD: Adenomas |
| SER: Sessile serrated lesions |
| MSI-H: Microsatellite-high colorectal cancer |
| MSS: Microsatellite stable colorectal cancer |
| Endometrium | 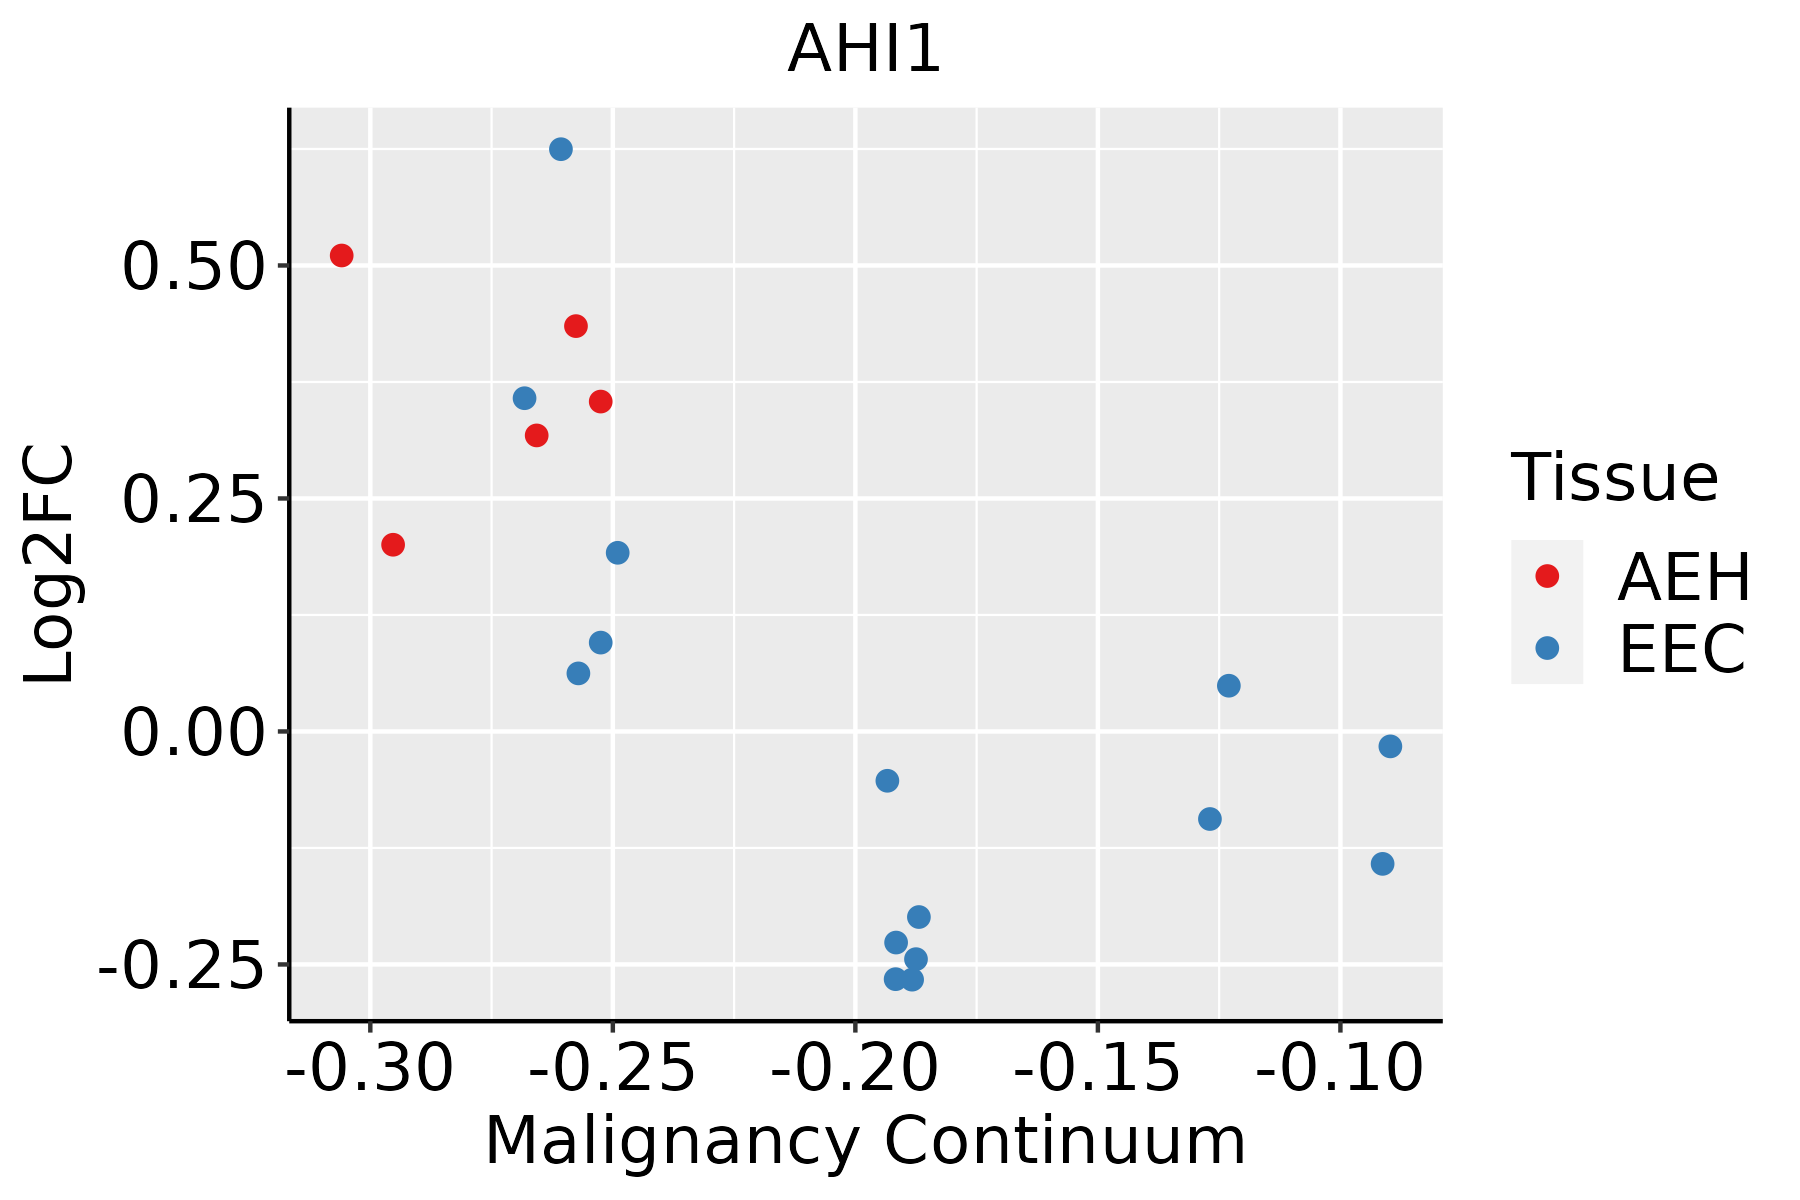 | AEH: Atypical endometrial hyperplasia |
| EEC: Endometrioid Cancer |
| Esophagus |  | ESCC: Esophageal squamous cell carcinoma |
| HGIN: High-grade intraepithelial neoplasias |
| LGIN: Low-grade intraepithelial neoplasias |
| Liver | 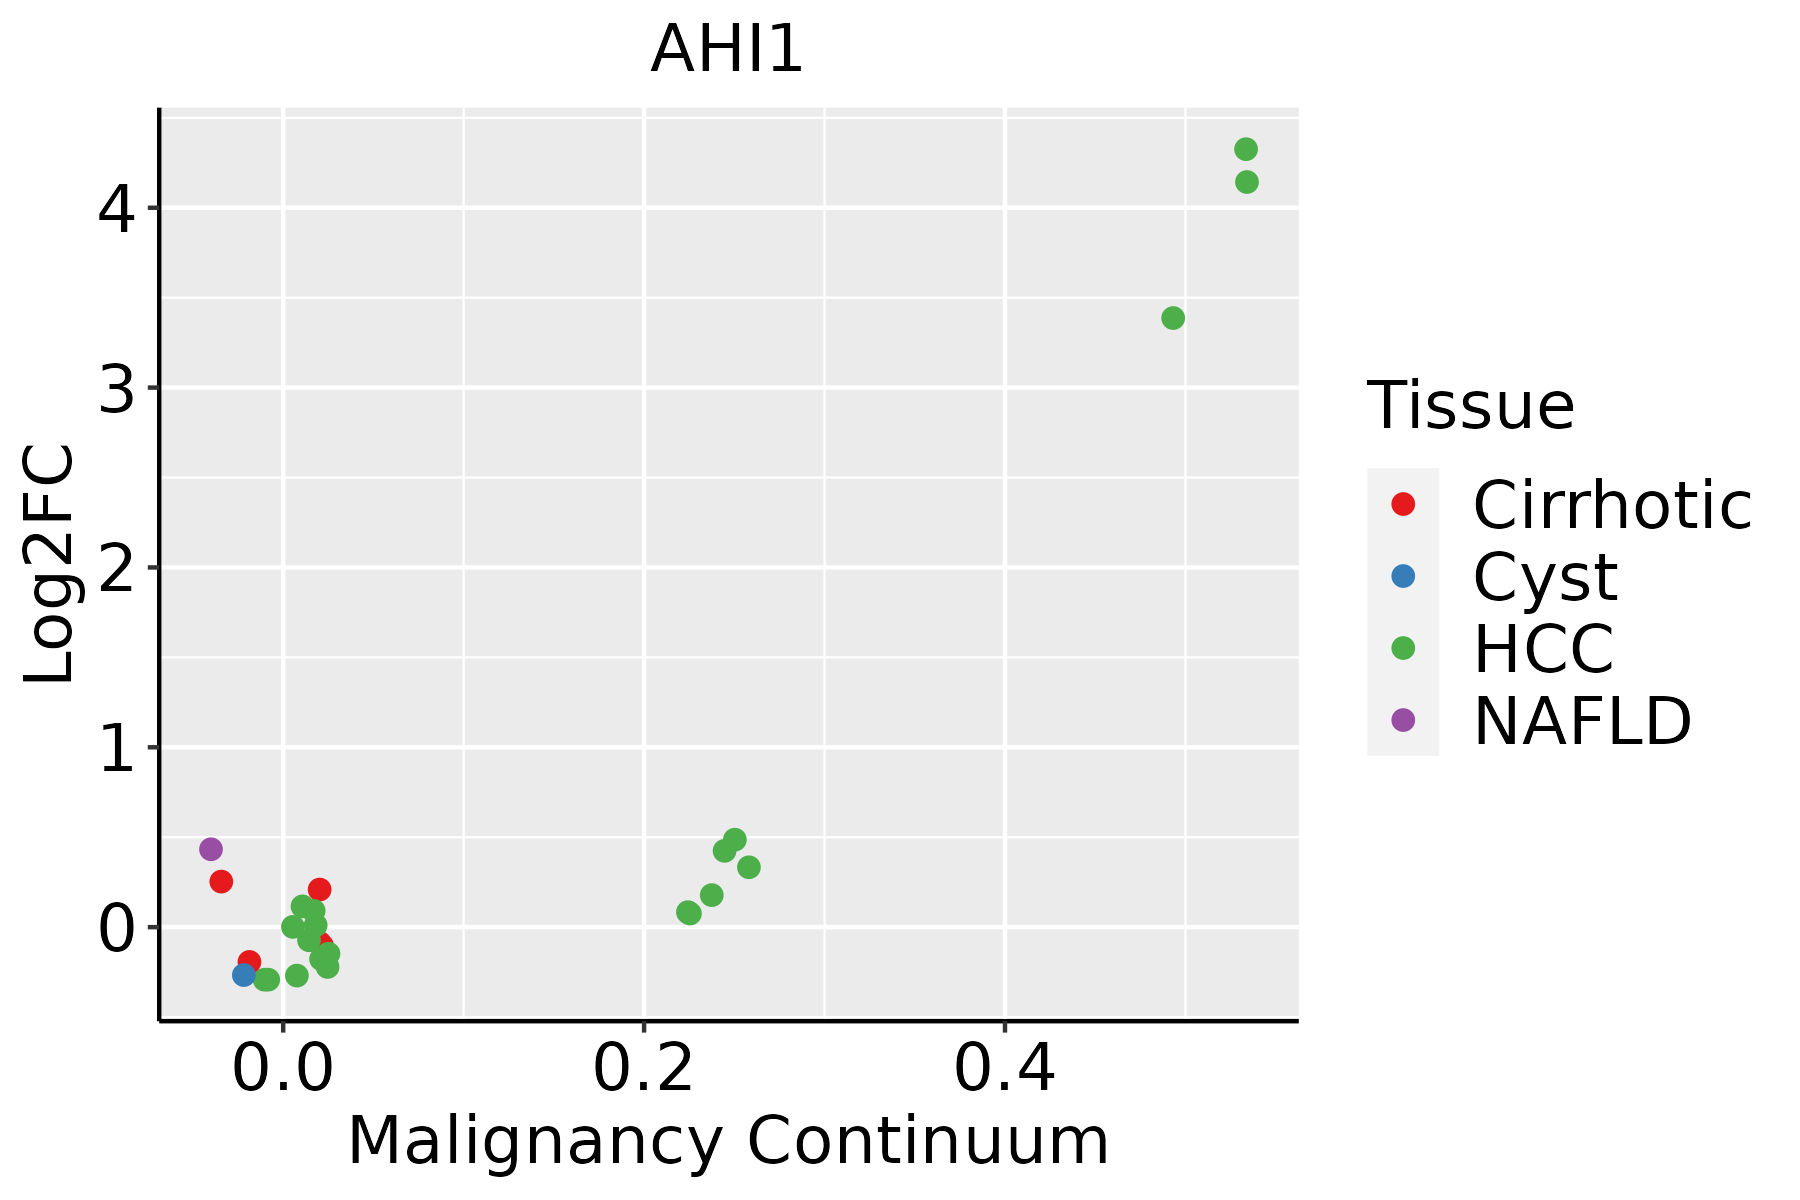 | HCC: Hepatocellular carcinoma |
| NAFLD: Non-alcoholic fatty liver disease |
| Lung | 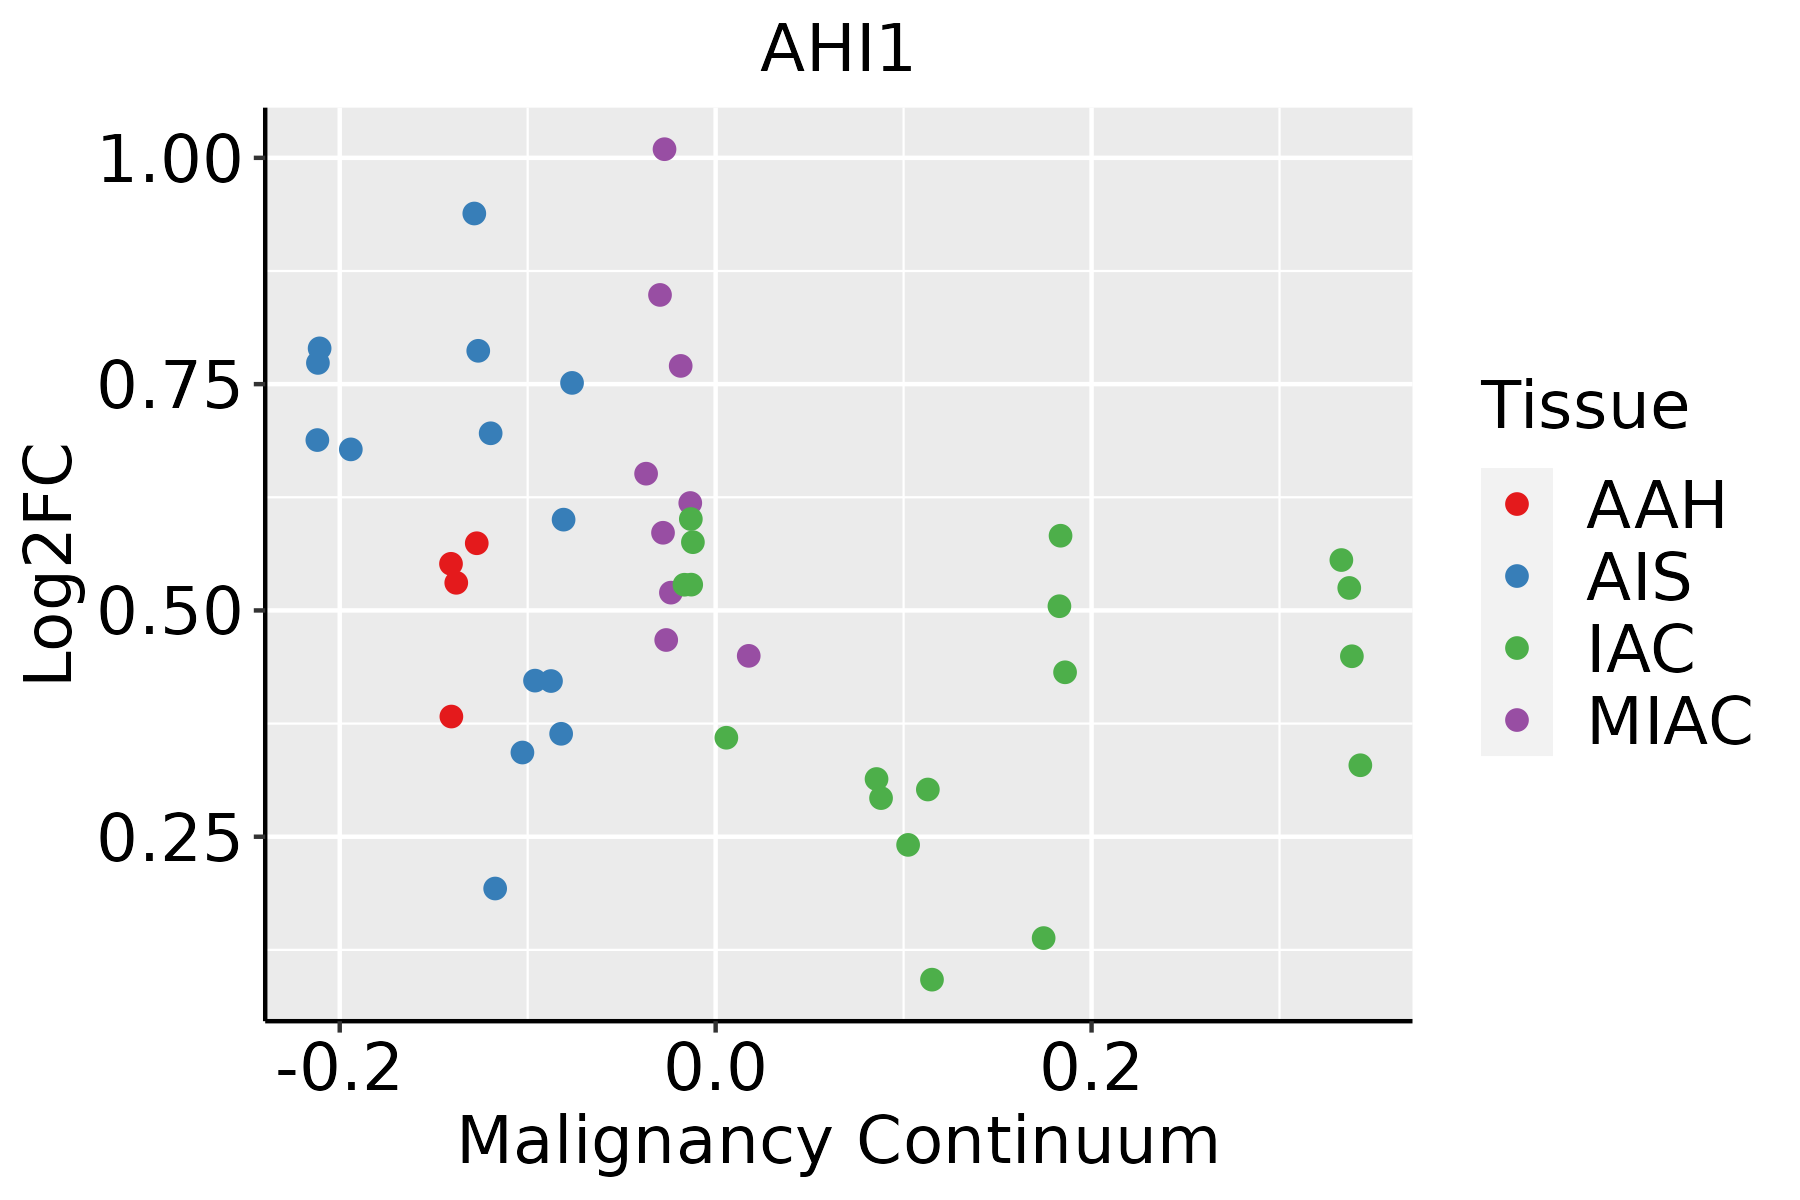 | AAH: Atypical adenomatous hyperplasia |
| AIS: Adenocarcinoma in situ |
| IAC: Invasive lung adenocarcinoma |
| MIA: Minimally invasive adenocarcinoma |
| Oral Cavity | 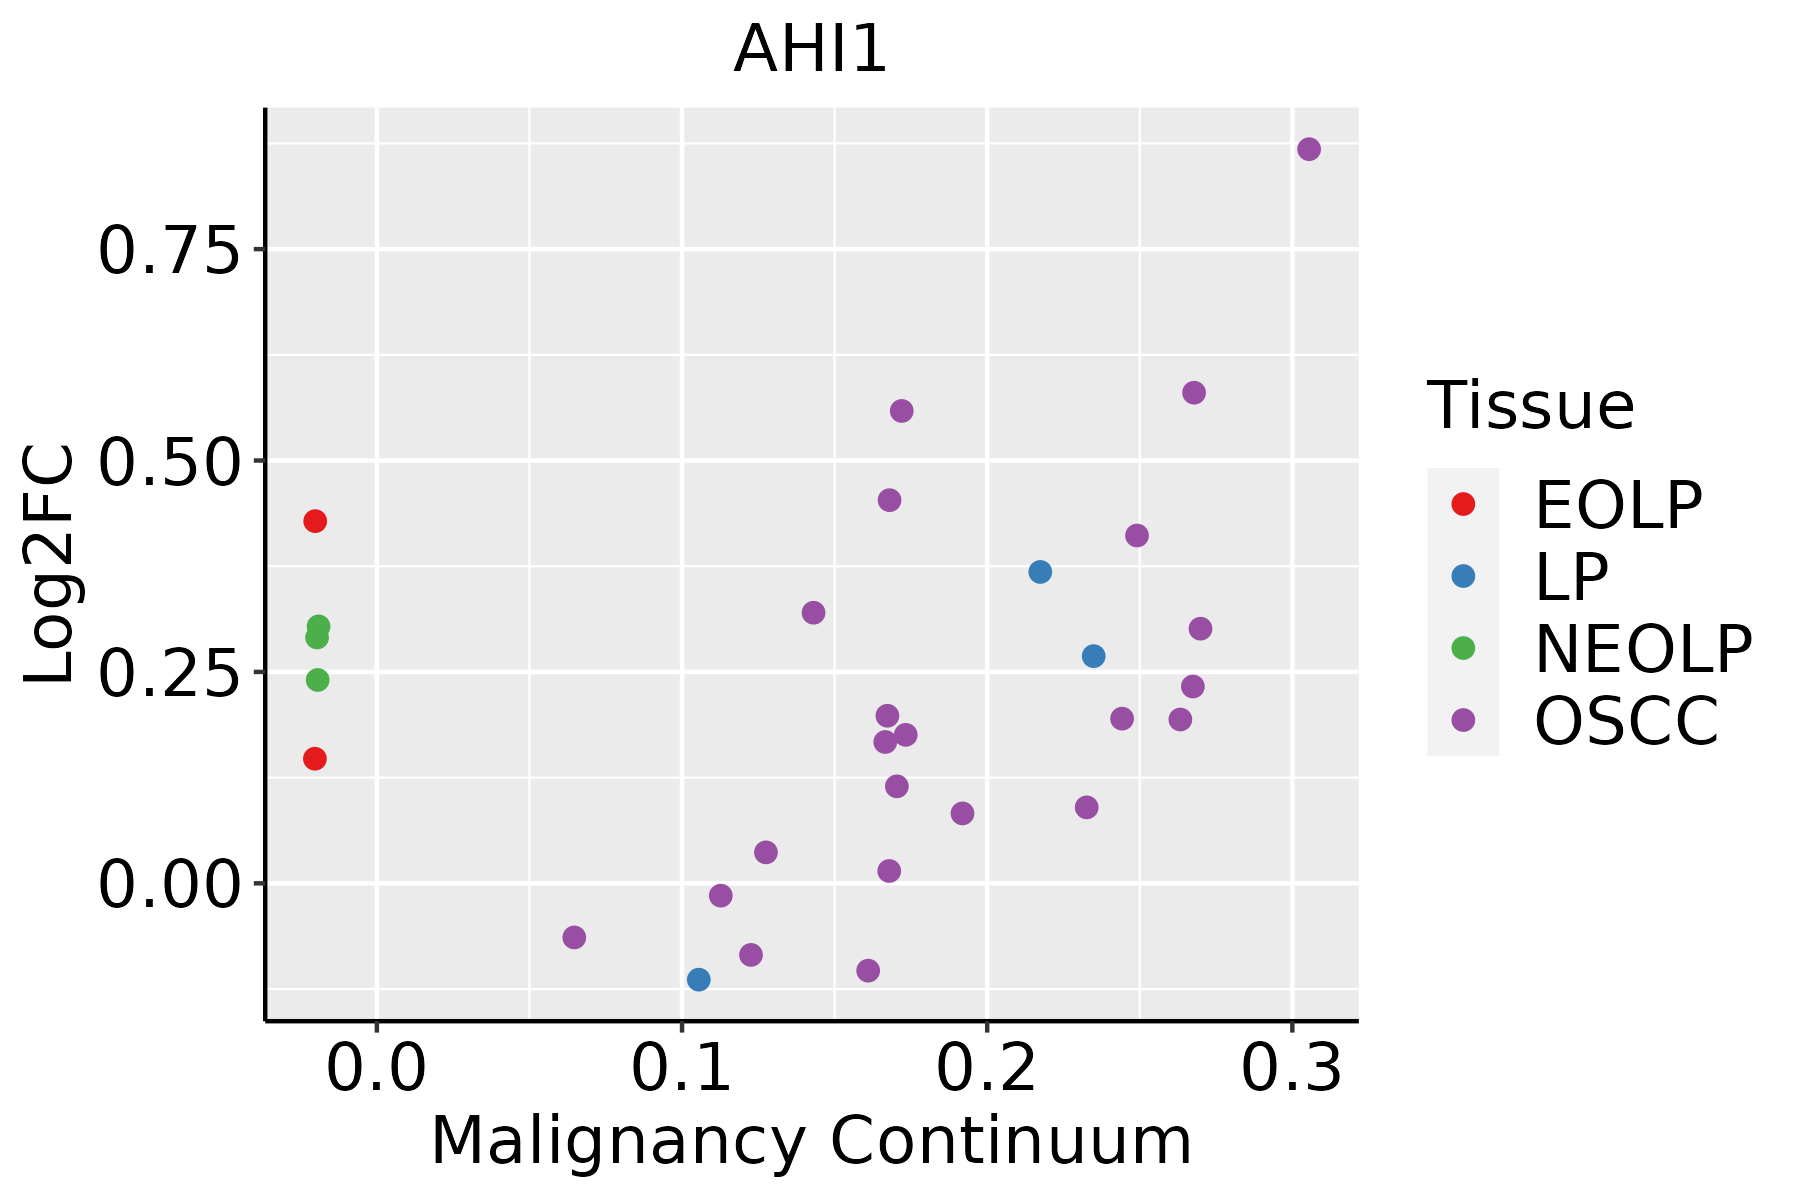 | EOLP: Erosive Oral lichen planus |
| LP: leukoplakia |
| NEOLP: Non-erosive oral lichen planus |
| OSCC: Oral squamous cell carcinoma |
| Prostate | 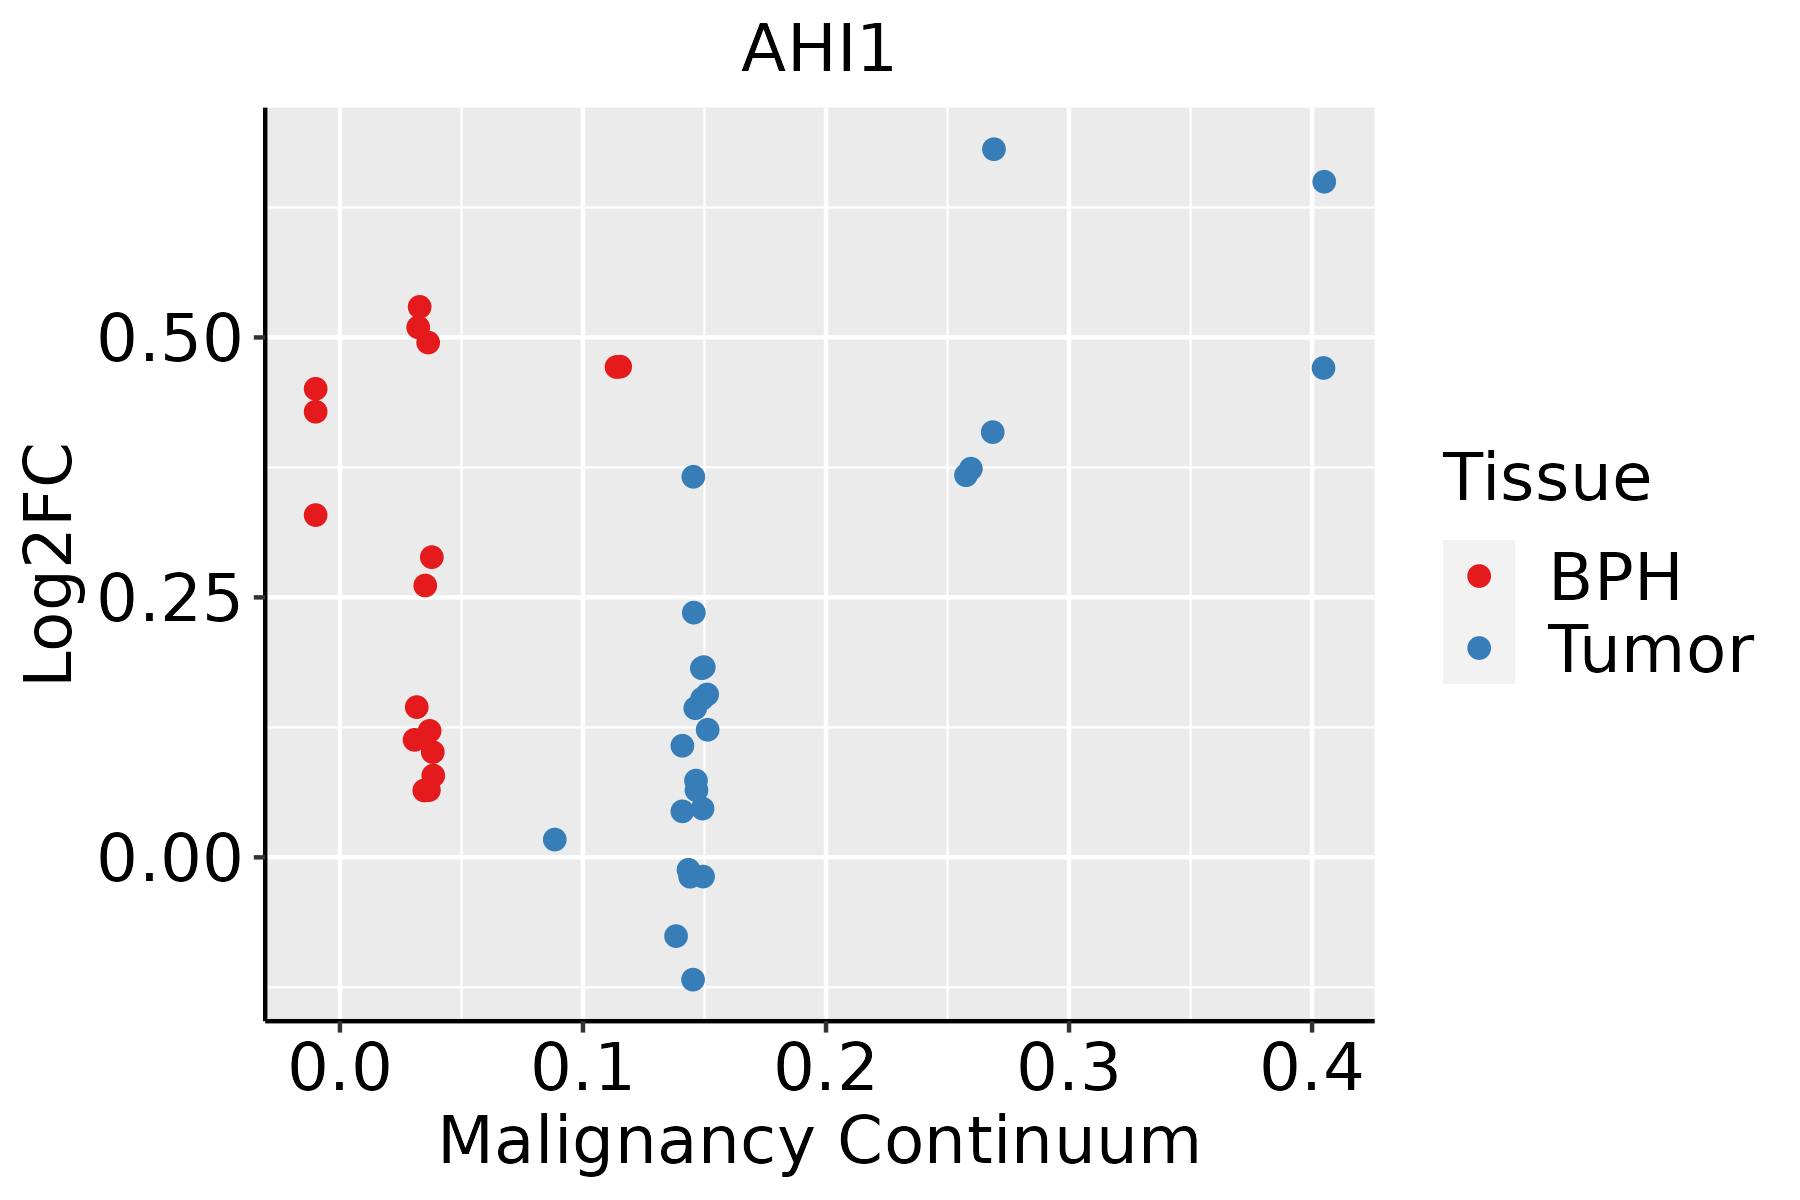 | BPH: Benign Prostatic Hyperplasia |
| Thyroid |  | ATC: Anaplastic thyroid cancer |
| HT: Hashimoto's thyroiditis |
| PTC: Papillary thyroid cancer |
| GO ID | Tissue | Disease Stage | Description | Gene Ratio | Bg Ratio | pvalue | p.adjust | Count |
| GO:0043112 | Colorectum | AD | receptor metabolic process | 62/3918 | 166/18723 | 8.18e-07 | 2.85e-05 | 62 |
| GO:0006898 | Colorectum | AD | receptor-mediated endocytosis | 76/3918 | 244/18723 | 1.07e-04 | 1.59e-03 | 76 |
| GO:0030100 | Colorectum | AD | regulation of endocytosis | 67/3918 | 211/18723 | 1.42e-04 | 2.01e-03 | 67 |
| GO:0060562 | Colorectum | AD | epithelial tube morphogenesis | 93/3918 | 325/18723 | 5.65e-04 | 6.00e-03 | 93 |
| GO:0045807 | Colorectum | AD | positive regulation of endocytosis | 35/3918 | 100/18723 | 7.78e-04 | 7.78e-03 | 35 |
| GO:0048260 | Colorectum | AD | positive regulation of receptor-mediated endocytosis | 20/3918 | 52/18723 | 2.87e-03 | 2.14e-02 | 20 |
| GO:0072073 | Colorectum | AD | kidney epithelium development | 42/3918 | 136/18723 | 4.02e-03 | 2.80e-02 | 42 |
| GO:0001738 | Colorectum | AD | morphogenesis of a polarized epithelium | 31/3918 | 94/18723 | 4.30e-03 | 2.95e-02 | 31 |
| GO:0048568 | Colorectum | AD | embryonic organ development | 112/3918 | 427/18723 | 4.60e-03 | 3.14e-02 | 112 |
| GO:0048259 | Colorectum | AD | regulation of receptor-mediated endocytosis | 35/3918 | 110/18723 | 4.85e-03 | 3.27e-02 | 35 |
| GO:0030859 | Colorectum | AD | polarized epithelial cell differentiation | 11/3918 | 24/18723 | 5.43e-03 | 3.55e-02 | 11 |
| GO:0031623 | Colorectum | AD | receptor internalization | 35/3918 | 113/18723 | 7.72e-03 | 4.66e-02 | 35 |
| GO:00301001 | Colorectum | SER | regulation of endocytosis | 48/2897 | 211/18723 | 3.29e-03 | 2.82e-02 | 48 |
| GO:00431121 | Colorectum | MSS | receptor metabolic process | 57/3467 | 166/18723 | 8.47e-07 | 2.97e-05 | 57 |
| GO:00301002 | Colorectum | MSS | regulation of endocytosis | 63/3467 | 211/18723 | 4.05e-05 | 7.66e-04 | 63 |
| GO:00605621 | Colorectum | MSS | epithelial tube morphogenesis | 88/3467 | 325/18723 | 8.45e-05 | 1.37e-03 | 88 |
| GO:00068981 | Colorectum | MSS | receptor-mediated endocytosis | 69/3467 | 244/18723 | 1.18e-04 | 1.82e-03 | 69 |
| GO:00458071 | Colorectum | MSS | positive regulation of endocytosis | 33/3467 | 100/18723 | 3.73e-04 | 4.72e-03 | 33 |
| GO:00482601 | Colorectum | MSS | positive regulation of receptor-mediated endocytosis | 19/3467 | 52/18723 | 1.66e-03 | 1.49e-02 | 19 |
| GO:00482591 | Colorectum | MSS | regulation of receptor-mediated endocytosis | 33/3467 | 110/18723 | 2.33e-03 | 1.90e-02 | 33 |
| Hugo Symbol | Variant Class | Variant Classification | dbSNP RS | HGVSc | HGVSp | HGVSp Short | SWISSPROT | BIOTYPE | SIFT | PolyPhen | Tumor Sample Barcode | Tissue | Histology | Sex | Age | Stage | Therapy Types | Drugs | Outcome |
| AHI1 | SNV | Missense_Mutation | | c.3220N>A | p.Arg1074Ser | p.R1074S | Q8N157 | protein_coding | deleterious(0) | probably_damaging(0.989) | TCGA-A2-A0CL-01 | Breast | breast invasive carcinoma | Female | <65 | III/IV | Chemotherapy | cytoxan | SD |
| AHI1 | SNV | Missense_Mutation | rs774732509 | c.3565N>C | p.Gly1189Arg | p.G1189R | Q8N157 | protein_coding | tolerated_low_confidence(0.25) | possibly_damaging(0.448) | TCGA-A2-A3Y0-01 | Breast | breast invasive carcinoma | Female | <65 | I/II | Chemotherapy | adriamycin | CR |
| AHI1 | SNV | Missense_Mutation | | c.1723G>A | p.Glu575Lys | p.E575K | Q8N157 | protein_coding | tolerated(0.18) | possibly_damaging(0.628) | TCGA-AC-A23H-01 | Breast | breast invasive carcinoma | Female | >=65 | I/II | Unknown | Unknown | PD |
| AHI1 | SNV | Missense_Mutation | | c.1231A>G | p.Lys411Glu | p.K411E | Q8N157 | protein_coding | deleterious(0) | possibly_damaging(0.907) | TCGA-AN-A0XN-01 | Breast | breast invasive carcinoma | Female | >=65 | III/IV | Unknown | Unknown | SD |
| AHI1 | SNV | Missense_Mutation | novel | c.1467N>A | p.Asn489Lys | p.N489K | Q8N157 | protein_coding | deleterious(0) | probably_damaging(0.996) | TCGA-AR-A0U0-01 | Breast | breast invasive carcinoma | Female | >=65 | I/II | Unknown | Unknown | SD |
| AHI1 | SNV | Missense_Mutation | | c.974N>G | p.Glu325Gly | p.E325G | Q8N157 | protein_coding | deleterious(0) | benign(0.255) | TCGA-D8-A1J8-01 | Breast | breast invasive carcinoma | Female | >=65 | I/II | Hormone Therapy | nolvadex | SD |
| AHI1 | SNV | Missense_Mutation | | c.303G>C | p.Leu101Phe | p.L101F | Q8N157 | protein_coding | tolerated(0.14) | benign(0.172) | TCGA-D8-A1JA-01 | Breast | breast invasive carcinoma | Female | <65 | III/IV | Chemotherapy | adriamycin | PD |
| AHI1 | SNV | Missense_Mutation | | c.2440C>T | p.Arg814Cys | p.R814C | Q8N157 | protein_coding | tolerated(0.1) | benign(0.173) | TCGA-D8-A1JB-01 | Breast | breast invasive carcinoma | Female | <65 | I/II | Chemotherapy | adriamycin | SD |
| AHI1 | insertion | Frame_Shift_Ins | novel | c.1465_1466insCTCCTGCTTT | p.Asn489ThrfsTer19 | p.N489Tfs*19 | Q8N157 | protein_coding | | | TCGA-AR-A0U0-01 | Breast | breast invasive carcinoma | Female | >=65 | I/II | Unknown | Unknown | SD |
| AHI1 | SNV | Missense_Mutation | rs199612496 | c.82C>T | p.Arg28Cys | p.R28C | Q8N157 | protein_coding | tolerated(0.07) | benign(0) | TCGA-2W-A8YY-01 | Cervix | cervical & endocervical cancer | Female | <65 | I/II | Chemotherapy | cisplatin | CR |


