
|
|||||
|
 | |
| |
| |
| |
| |
| |
|
Gene: AHCYL2 |
Gene summary for AHCYL2 |
| Gene information | Species | Human | Gene symbol | AHCYL2 | Gene ID | 23382 |
| Gene name | adenosylhomocysteinase like 2 | |
| Gene Alias | ADOHCYASE3 | |
| Cytomap | 7q32.1 | |
| Gene Type | protein-coding | GO ID | GO:0006730 | UniProtAcc | Q96HN2 |
Top |
Malignant transformation analysis |
| Identification of the aberrant gene expression in precancerous and cancerous lesions by comparing the gene expression of stem-like cells in diseased tissues with normal stem cells |
| Entrez ID | Symbol | Replicates | Species | Organ | Tissue | Adj P-value | Log2FC | Malignancy |
| 23382 | AHCYL2 | CCI_2 | Human | Cervix | CC | 1.49e-08 | 1.12e+00 | 0.5249 |
| 23382 | AHCYL2 | HTA11_3410_2000001011 | Human | Colorectum | AD | 4.94e-24 | -6.82e-01 | 0.0155 |
| 23382 | AHCYL2 | HTA11_2951_2000001011 | Human | Colorectum | AD | 9.12e-03 | -7.61e-01 | 0.0216 |
| 23382 | AHCYL2 | HTA11_347_2000001011 | Human | Colorectum | AD | 1.78e-28 | 1.02e+00 | -0.1954 |
| 23382 | AHCYL2 | HTA11_411_2000001011 | Human | Colorectum | SER | 2.80e-03 | 6.77e-01 | -0.2602 |
| 23382 | AHCYL2 | HTA11_866_3004761011 | Human | Colorectum | AD | 2.42e-10 | -6.01e-01 | 0.096 |
| 23382 | AHCYL2 | HTA11_8622_2000001021 | Human | Colorectum | SER | 1.47e-02 | -5.87e-01 | 0.0528 |
| 23382 | AHCYL2 | HTA11_10711_2000001011 | Human | Colorectum | AD | 3.24e-02 | -4.87e-01 | 0.0338 |
| 23382 | AHCYL2 | HTA11_7696_3000711011 | Human | Colorectum | AD | 3.33e-06 | -4.29e-01 | 0.0674 |
| 23382 | AHCYL2 | HTA11_6818_2000001021 | Human | Colorectum | AD | 7.37e-03 | -5.30e-01 | 0.0588 |
| 23382 | AHCYL2 | HTA11_99999970781_79442 | Human | Colorectum | MSS | 5.38e-22 | -6.12e-01 | 0.294 |
| 23382 | AHCYL2 | HTA11_99999971662_82457 | Human | Colorectum | MSS | 3.18e-05 | -4.80e-01 | 0.3859 |
| 23382 | AHCYL2 | HTA11_99999973899_84307 | Human | Colorectum | MSS | 8.32e-03 | -5.90e-01 | 0.2585 |
| 23382 | AHCYL2 | HTA11_99999974143_84620 | Human | Colorectum | MSS | 1.29e-20 | -6.54e-01 | 0.3005 |
| 23382 | AHCYL2 | F007 | Human | Colorectum | FAP | 5.97e-04 | -4.18e-01 | 0.1176 |
| 23382 | AHCYL2 | A002-C-010 | Human | Colorectum | FAP | 1.02e-02 | -2.20e-01 | 0.242 |
| 23382 | AHCYL2 | A001-C-207 | Human | Colorectum | FAP | 1.13e-09 | -5.07e-01 | 0.1278 |
| 23382 | AHCYL2 | A015-C-203 | Human | Colorectum | FAP | 2.86e-40 | -7.15e-01 | -0.1294 |
| 23382 | AHCYL2 | A015-C-204 | Human | Colorectum | FAP | 1.96e-12 | -5.71e-01 | -0.0228 |
| 23382 | AHCYL2 | A014-C-040 | Human | Colorectum | FAP | 7.78e-08 | -5.71e-01 | -0.1184 |
| Page: 1 2 3 4 5 |
| Tissue | Expression Dynamics | Abbreviation |
| Cervix | 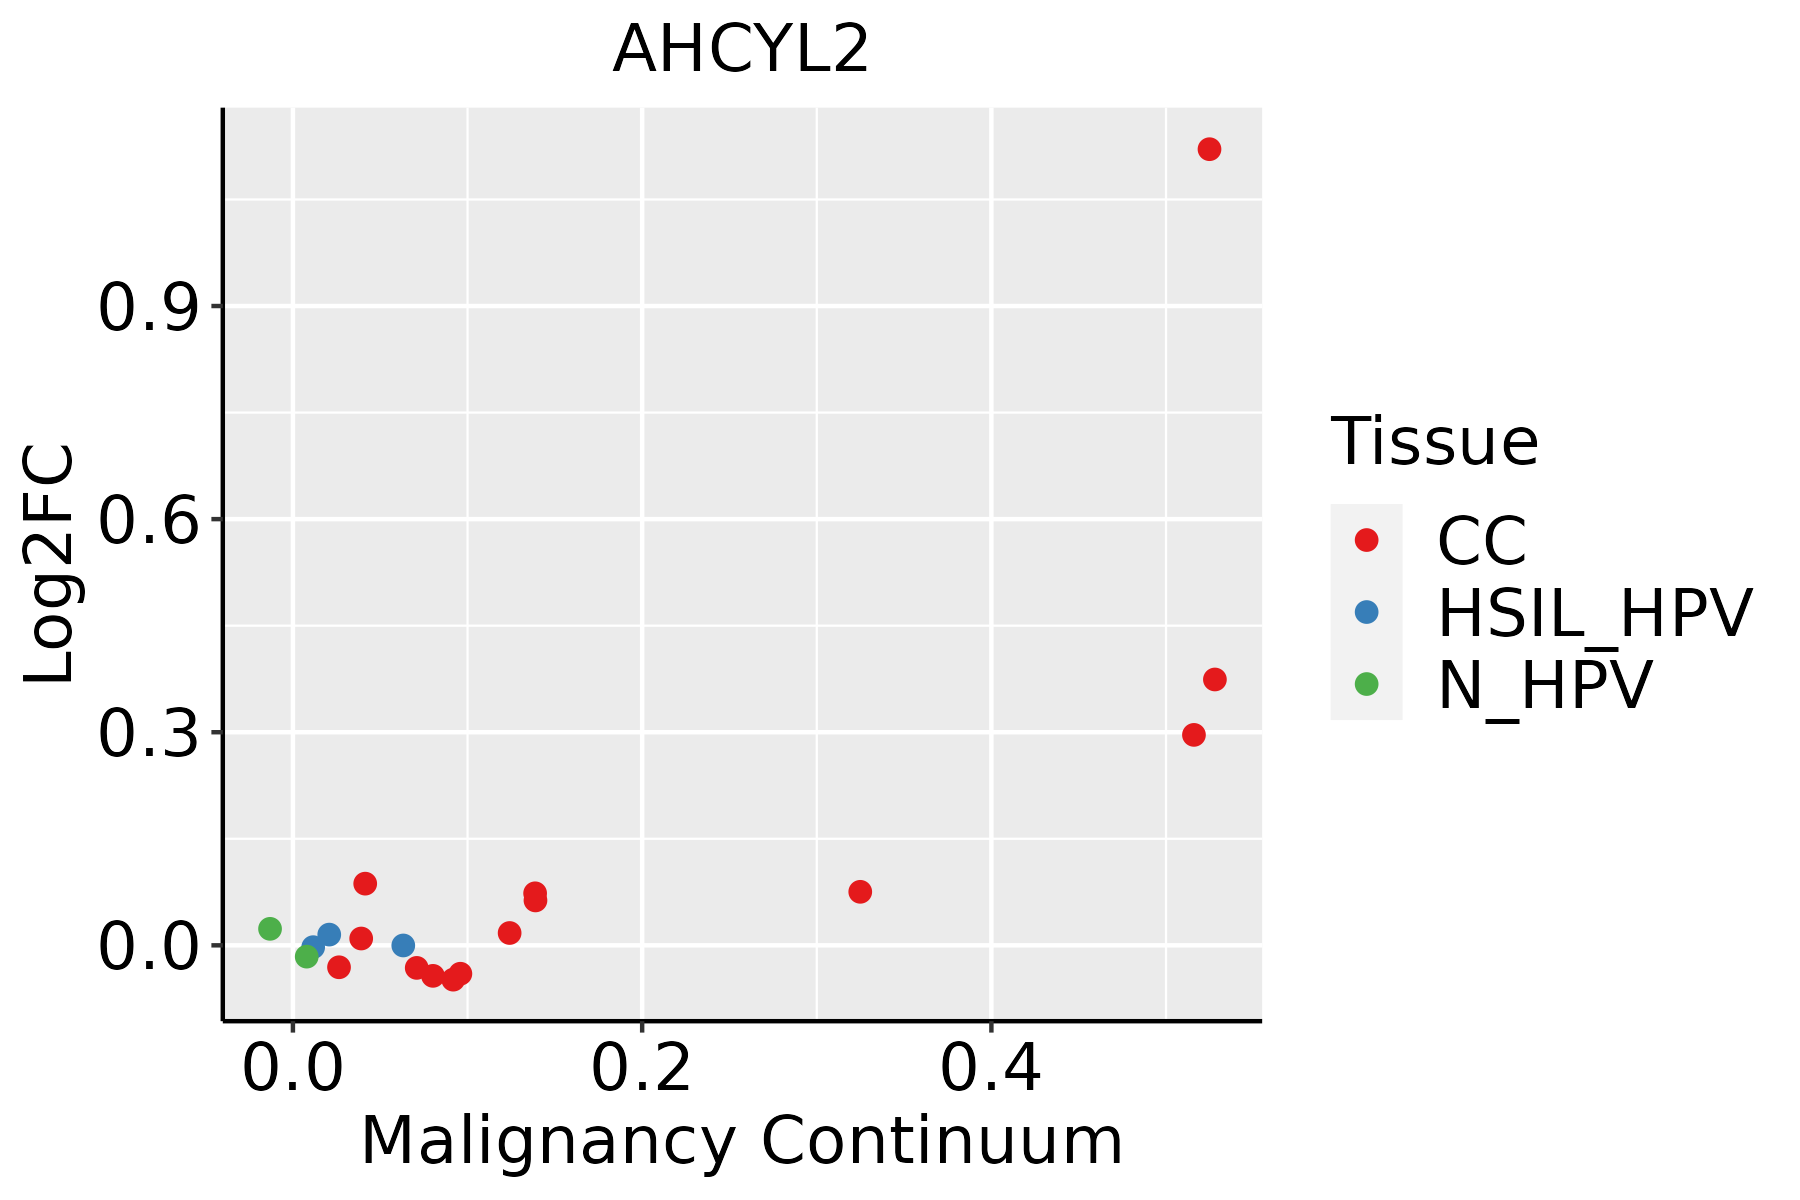 | CC: Cervix cancer |
| HSIL_HPV: HPV-infected high-grade squamous intraepithelial lesions | ||
| N_HPV: HPV-infected normal cervix | ||
| Colorectum (GSE201348) |  | FAP: Familial adenomatous polyposis |
| CRC: Colorectal cancer | ||
| Colorectum (HTA11) |  | AD: Adenomas |
| SER: Sessile serrated lesions | ||
| MSI-H: Microsatellite-high colorectal cancer | ||
| MSS: Microsatellite stable colorectal cancer | ||
| Endometrium | 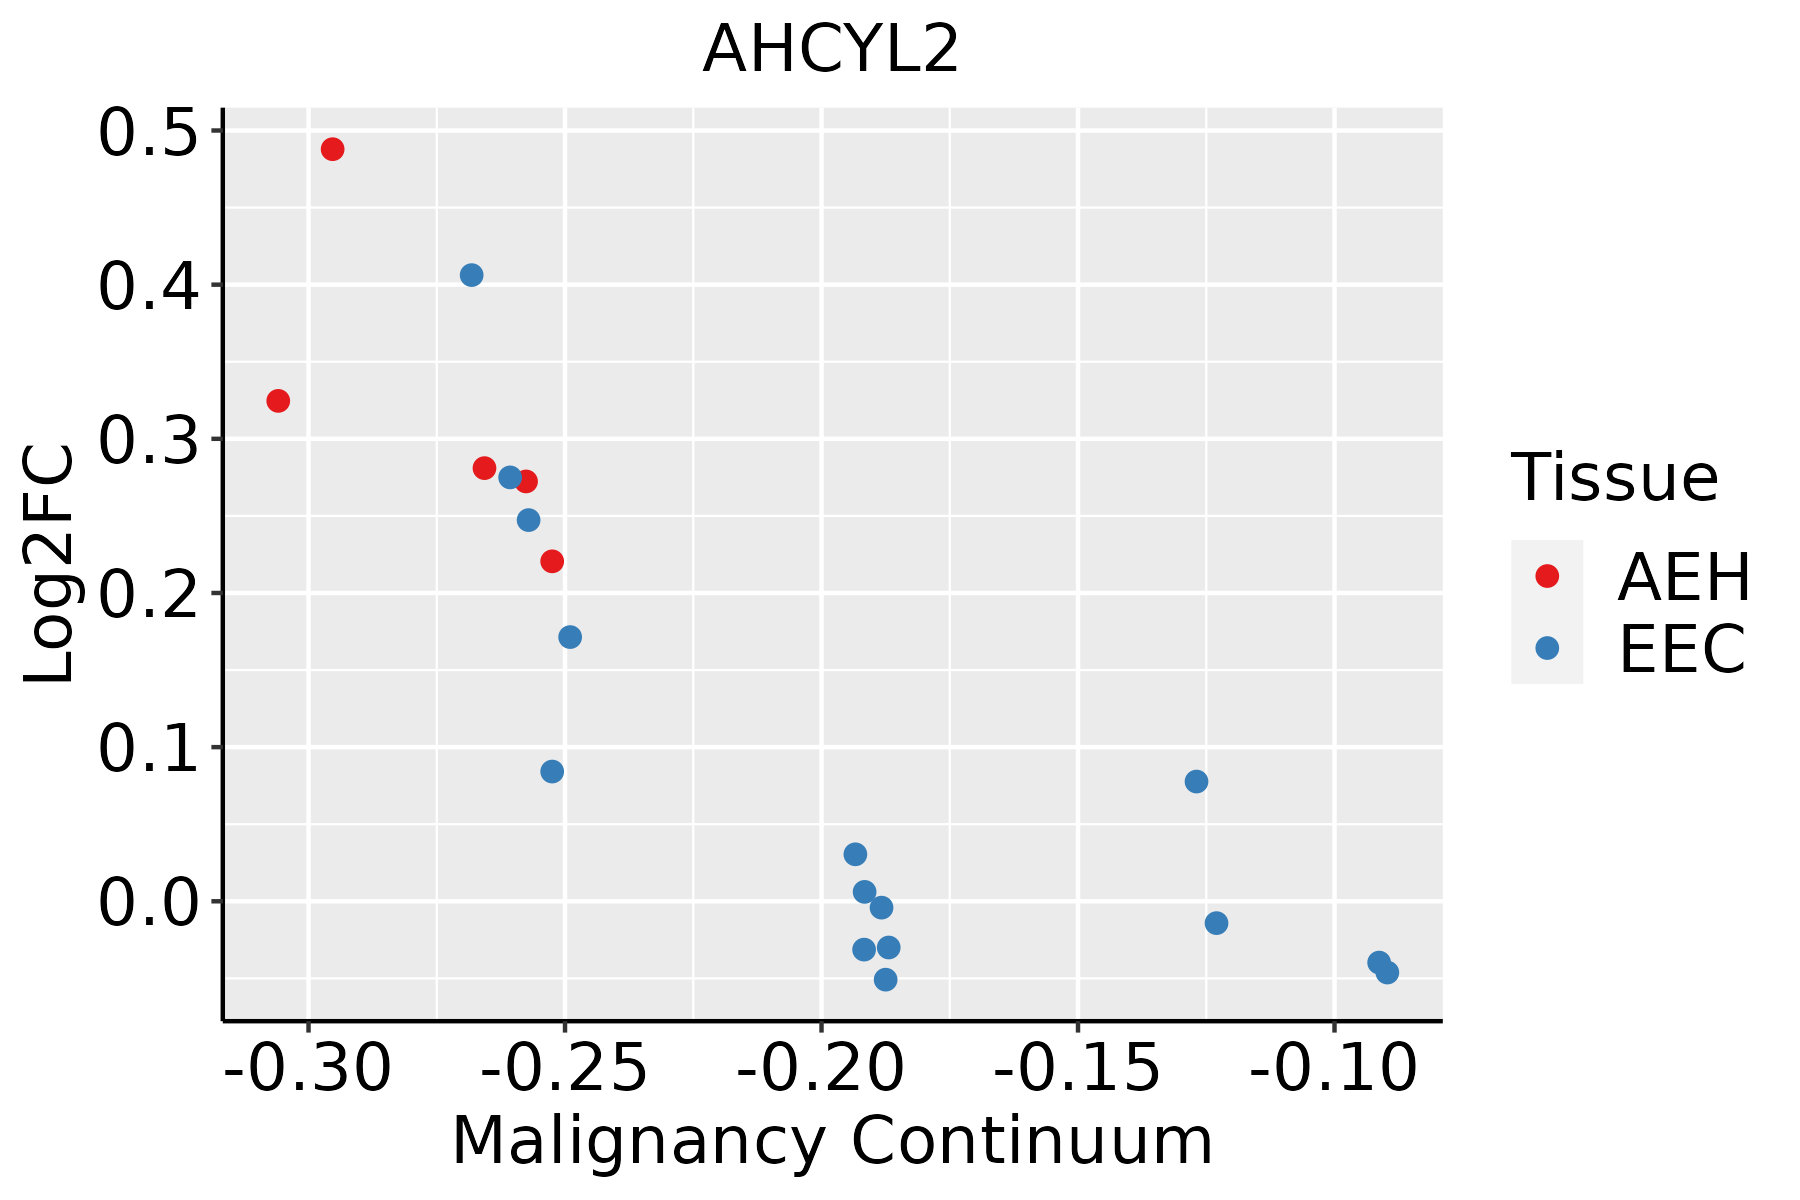 | AEH: Atypical endometrial hyperplasia |
| EEC: Endometrioid Cancer | ||
| Lung |  | AAH: Atypical adenomatous hyperplasia |
| AIS: Adenocarcinoma in situ | ||
| IAC: Invasive lung adenocarcinoma | ||
| MIA: Minimally invasive adenocarcinoma | ||
| Skin | 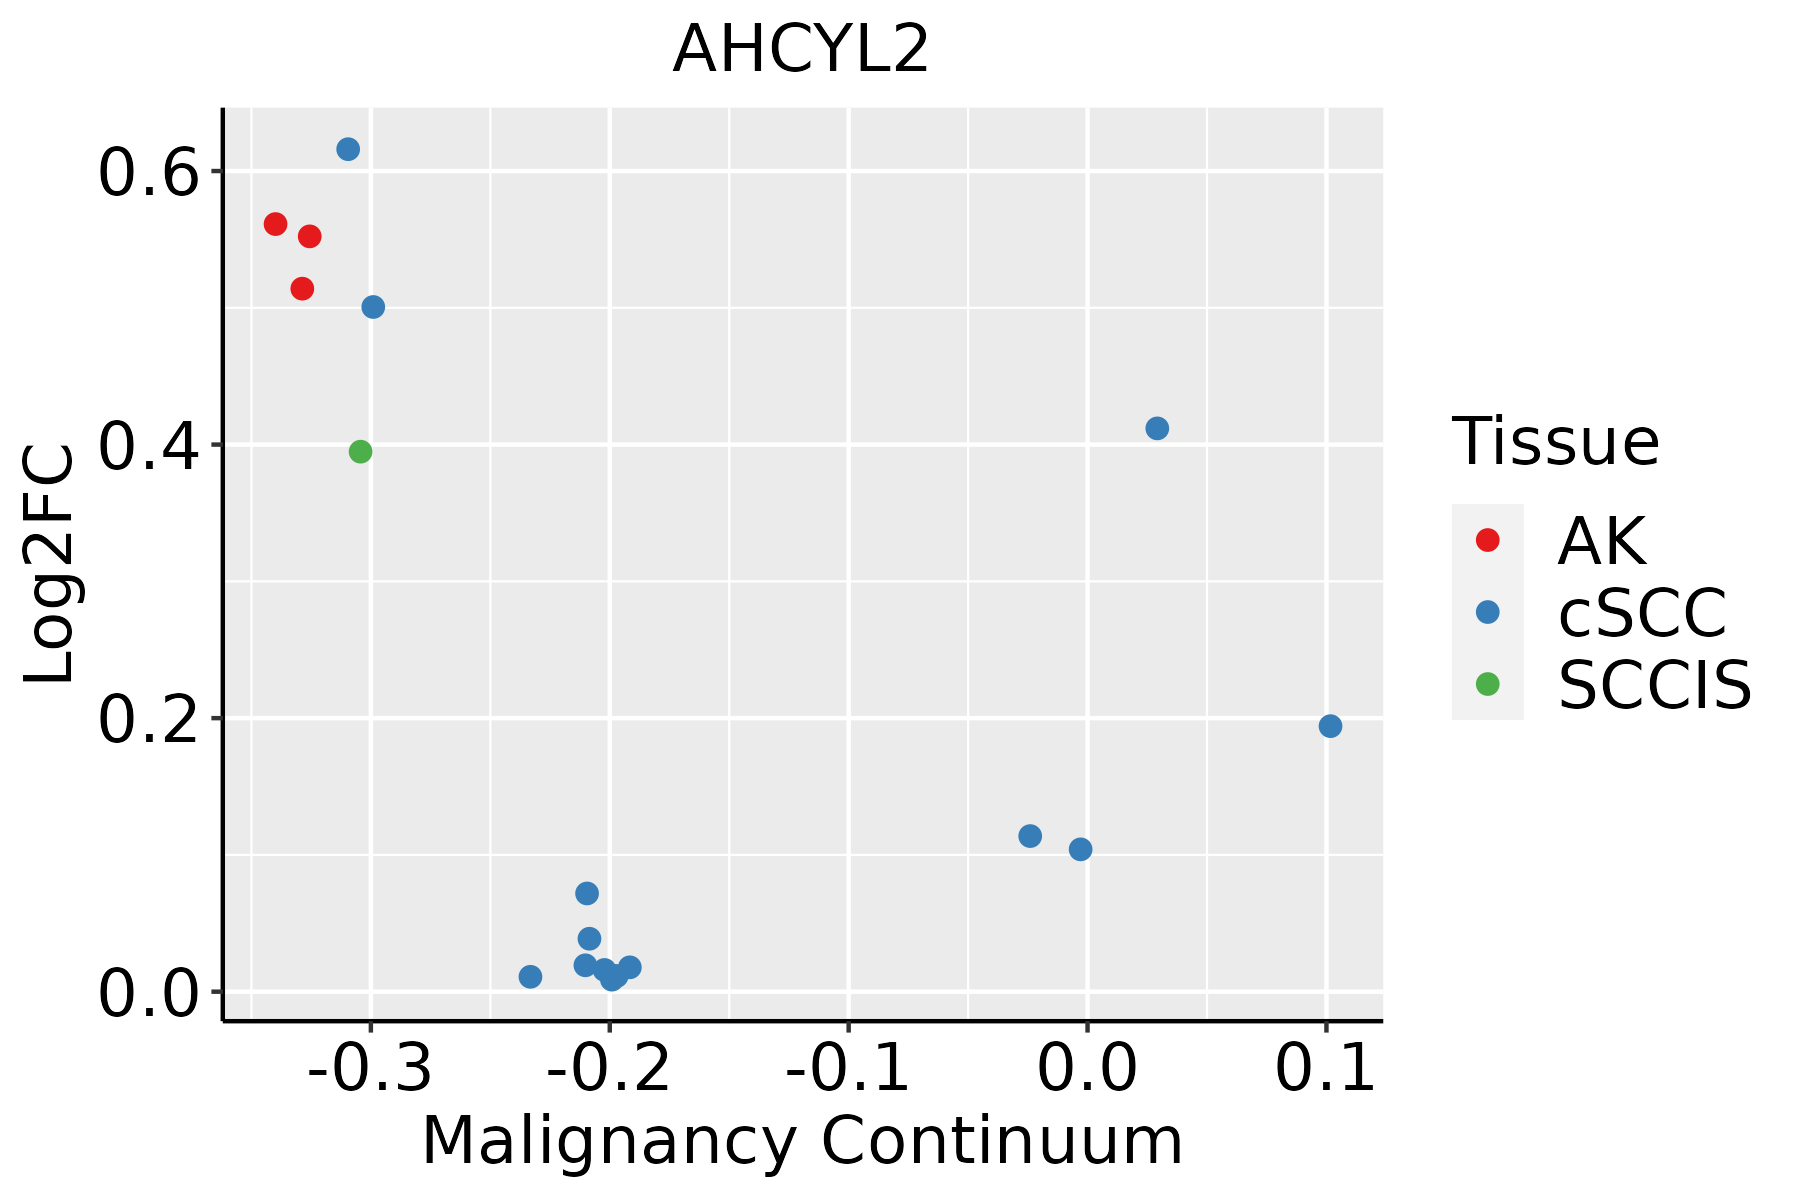 | AK: Actinic keratosis |
| cSCC: Cutaneous squamous cell carcinoma | ||
| SCCIS:squamous cell carcinoma in situ |
| ∗log2FC in expression of this searched gene in stem-like cells from each diseased tissue sample relative to stem-like cells in normal samples in each tissue plotted against the malignancy continuum. Samples are colored based on if they are from different disease stage. |
Top |
Malignant transformation related pathway analysis |
| Find out the enriched GO biological processes and KEGG pathways involved in transition from healthy to precancer to cancer |
| Tissue | Disease Stage | Enriched GO biological Processes |
| Colorectum | AD |  |
| Colorectum | SER |  |
| Colorectum | MSS |  |
| Colorectum | MSI-H |  |
| Colorectum | FAP |  |
| ∗Top 15 enriched GO BP terms are showed in the bar plot of each disease state in each tissue. Each row represents a significant GO biological process which is colored according to the -log10(p.adjust). |
| Page: 1 2 3 4 5 6 7 8 9 |
| GO ID | Tissue | Disease Stage | Description | Gene Ratio | Bg Ratio | pvalue | p.adjust | Count |
| GO:0006790 | Colorectum | AD | sulfur compound metabolic process | 101/3918 | 339/18723 | 6.46e-05 | 1.07e-03 | 101 |
| GO:0006730 | Colorectum | AD | one-carbon metabolic process | 18/3918 | 40/18723 | 5.36e-04 | 5.74e-03 | 18 |
| GO:00067301 | Colorectum | SER | one-carbon metabolic process | 15/2897 | 40/18723 | 5.71e-04 | 7.86e-03 | 15 |
| GO:00067901 | Colorectum | SER | sulfur compound metabolic process | 73/2897 | 339/18723 | 1.75e-03 | 1.81e-02 | 73 |
| GO:00067902 | Colorectum | MSS | sulfur compound metabolic process | 85/3467 | 339/18723 | 1.52e-03 | 1.39e-02 | 85 |
| GO:00067302 | Colorectum | MSS | one-carbon metabolic process | 15/3467 | 40/18723 | 3.72e-03 | 2.73e-02 | 15 |
| GO:00067304 | Skin | cSCC | one-carbon metabolic process | 18/4864 | 40/18723 | 7.10e-03 | 3.40e-02 | 18 |
| Page: 1 |
| Pathway ID | Tissue | Disease Stage | Description | Gene Ratio | Bg Ratio | pvalue | p.adjust | qvalue | Count |
| hsa002704 | Endometrium | EEC | Cysteine and methionine metabolism | 15/1237 | 52/8465 | 6.02e-03 | 3.12e-02 | 2.33e-02 | 15 |
| hsa0027011 | Endometrium | EEC | Cysteine and methionine metabolism | 15/1237 | 52/8465 | 6.02e-03 | 3.12e-02 | 2.33e-02 | 15 |
| Page: 1 |
Top |
Cell-cell communication analysis |
| Identification of potential cell-cell interactions between two cell types and their ligand-receptor pairs for different disease states |
| Ligand | Receptor | LRpair | Pathway | Tissue | Disease Stage |
| Page: 1 |
Top |
Single-cell gene regulatory network inference analysis |
| Find out the significant the regulons (TFs) and the target genes of each regulon across cell types for different disease states |
| TF | Cell Type | Tissue | Disease Stage | Target Gene | RSS | Regulon Activity |
| ∗The dot plots of a searched regulon are shown for all cell subpopulations in each disease state of each tissue based on the regulon specific score inferred using pySCENIC and by calculating the average expression. |
| Page: 1 |
Top |
Somatic mutation of malignant transformation related genes |
| Annotation of somatic variants for genes involved in malignant transformation |
| Hugo Symbol | Variant Class | Variant Classification | dbSNP RS | HGVSc | HGVSp | HGVSp Short | SWISSPROT | BIOTYPE | SIFT | PolyPhen | Tumor Sample Barcode | Tissue | Histology | Sex | Age | Stage | Therapy Types | Drugs | Outcome |
| AHCYL2 | SNV | Missense_Mutation | c.814G>A | p.Ala272Thr | p.A272T | Q96HN2 | protein_coding | deleterious(0) | probably_damaging(0.926) | TCGA-BH-A0HF-01 | Breast | breast invasive carcinoma | Female | >=65 | I/II | Hormone Therapy | arimidex | SD | |
| AHCYL2 | SNV | Missense_Mutation | c.1645N>C | p.Glu549Gln | p.E549Q | Q96HN2 | protein_coding | deleterious(0) | probably_damaging(0.983) | TCGA-D8-A27G-01 | Breast | breast invasive carcinoma | Female | >=65 | I/II | Unknown | Unknown | SD | |
| AHCYL2 | insertion | Nonsense_Mutation | novel | c.468_469insTGGAAAGCTAACTAATATATTTTAAA | p.Ser157TrpfsTer5 | p.S157Wfs*5 | Q96HN2 | protein_coding | TCGA-BH-A0HK-01 | Breast | breast invasive carcinoma | Female | >=65 | I/II | Hormone Therapy | arimidex | SD | ||
| AHCYL2 | SNV | Missense_Mutation | novel | c.329G>A | p.Gly110Asp | p.G110D | Q96HN2 | protein_coding | deleterious_low_confidence(0) | benign(0.038) | TCGA-2W-A8YY-01 | Cervix | cervical & endocervical cancer | Female | <65 | I/II | Chemotherapy | cisplatin | CR |
| AHCYL2 | SNV | Missense_Mutation | novel | c.668C>T | p.Pro223Leu | p.P223L | Q96HN2 | protein_coding | deleterious(0) | probably_damaging(1) | TCGA-2W-A8YY-01 | Cervix | cervical & endocervical cancer | Female | <65 | I/II | Chemotherapy | cisplatin | CR |
| AHCYL2 | SNV | Missense_Mutation | rs774740816 | c.624N>A | p.Met208Ile | p.M208I | Q96HN2 | protein_coding | deleterious(0.01) | probably_damaging(0.998) | TCGA-EA-A3HU-01 | Cervix | cervical & endocervical cancer | Female | <65 | I/II | Unknown | Unknown | SD |
| AHCYL2 | SNV | Missense_Mutation | c.642N>C | p.Leu214Phe | p.L214F | Q96HN2 | protein_coding | deleterious(0) | probably_damaging(1) | TCGA-A6-6140-01 | Colorectum | colon adenocarcinoma | Male | <65 | I/II | Chemotherapy | oxaliplatin | SD | |
| AHCYL2 | SNV | Missense_Mutation | c.1601N>G | p.Phe534Cys | p.F534C | Q96HN2 | protein_coding | deleterious(0.01) | probably_damaging(0.974) | TCGA-A6-6141-01 | Colorectum | colon adenocarcinoma | Male | <65 | I/II | Chemotherapy | 5-fu | SD | |
| AHCYL2 | SNV | Missense_Mutation | c.558N>A | p.Phe186Leu | p.F186L | Q96HN2 | protein_coding | deleterious(0.04) | probably_damaging(0.989) | TCGA-AA-3510-01 | Colorectum | colon adenocarcinoma | Male | >=65 | I/II | Unknown | Unknown | SD | |
| AHCYL2 | SNV | Missense_Mutation | c.1459N>A | p.Val487Met | p.V487M | Q96HN2 | protein_coding | deleterious(0.04) | probably_damaging(0.957) | TCGA-AA-3864-01 | Colorectum | colon adenocarcinoma | Male | >=65 | I/II | Unknown | Unknown | SD |
| Page: 1 2 3 4 5 6 7 |
Top |
Related drugs of malignant transformation related genes |
| Identification of chemicals and drugs interact with genes involved in malignant transfromation |
| (DGIdb 4.0) |
| Entrez ID | Symbol | Category | Interaction Types | Drug Claim Name | Drug Name | PMIDs |
| Page: 1 |

Copyright 2023-Present -The University of Texas Health Science Center at Houston |