
|
|||||
|
 | |
| |
| |
| |
| |
| |
|
Gene: AHCY |
Gene summary for AHCY |
| Gene information | Species | Human | Gene symbol | AHCY | Gene ID | 191 |
| Gene name | adenosylhomocysteinase | |
| Gene Alias | SAHH | |
| Cytomap | 20q11.22 | |
| Gene Type | protein-coding | GO ID | GO:0001666 | UniProtAcc | P23526 |
Top |
Malignant transformation analysis |
| Identification of the aberrant gene expression in precancerous and cancerous lesions by comparing the gene expression of stem-like cells in diseased tissues with normal stem cells |
| Entrez ID | Symbol | Replicates | Species | Organ | Tissue | Adj P-value | Log2FC | Malignancy |
| 191 | AHCY | HTA11_78_2000001011 | Human | Colorectum | AD | 1.20e-02 | 2.67e-01 | -0.1088 |
| 191 | AHCY | HTA11_347_2000001011 | Human | Colorectum | AD | 6.59e-03 | 2.05e-01 | -0.1954 |
| 191 | AHCY | HTA11_696_2000001011 | Human | Colorectum | AD | 1.88e-03 | 2.34e-01 | -0.1464 |
| 191 | AHCY | HTA11_1391_2000001011 | Human | Colorectum | AD | 3.25e-08 | 4.78e-01 | -0.059 |
| 191 | AHCY | HTA11_866_3004761011 | Human | Colorectum | AD | 2.90e-15 | 5.50e-01 | 0.096 |
| 191 | AHCY | HTA11_4255_2000001011 | Human | Colorectum | SER | 1.12e-07 | 5.66e-01 | 0.0446 |
| 191 | AHCY | HTA11_7696_3000711011 | Human | Colorectum | AD | 9.72e-06 | 3.59e-01 | 0.0674 |
| 191 | AHCY | HTA11_6818_2000001021 | Human | Colorectum | AD | 6.00e-07 | 4.04e-01 | 0.0588 |
| 191 | AHCY | HTA11_99999965104_69814 | Human | Colorectum | MSS | 5.44e-08 | 4.69e-01 | 0.281 |
| 191 | AHCY | HTA11_99999971662_82457 | Human | Colorectum | MSS | 7.41e-62 | 1.51e+00 | 0.3859 |
| 191 | AHCY | HTA11_99999973899_84307 | Human | Colorectum | MSS | 3.61e-15 | 7.03e-01 | 0.2585 |
| 191 | AHCY | HTA11_99999974143_84620 | Human | Colorectum | MSS | 4.09e-32 | 7.77e-01 | 0.3005 |
| 191 | AHCY | LZE4T | Human | Esophagus | ESCC | 8.06e-17 | 9.29e-01 | 0.0811 |
| 191 | AHCY | LZE5T | Human | Esophagus | ESCC | 9.53e-03 | 6.27e-01 | 0.0514 |
| 191 | AHCY | LZE7T | Human | Esophagus | ESCC | 7.48e-13 | 1.03e+00 | 0.0667 |
| 191 | AHCY | LZE8T | Human | Esophagus | ESCC | 2.15e-14 | 7.65e-01 | 0.067 |
| 191 | AHCY | LZE20T | Human | Esophagus | ESCC | 2.91e-03 | 3.65e-01 | 0.0662 |
| 191 | AHCY | LZE22D1 | Human | Esophagus | HGIN | 1.80e-03 | 3.64e-01 | 0.0595 |
| 191 | AHCY | LZE22T | Human | Esophagus | ESCC | 3.93e-05 | 9.94e-01 | 0.068 |
| 191 | AHCY | LZE24T | Human | Esophagus | ESCC | 2.90e-36 | 2.09e+00 | 0.0596 |
| Page: 1 2 3 4 5 6 7 8 |
| Tissue | Expression Dynamics | Abbreviation |
| Colorectum (GSE201348) |  | FAP: Familial adenomatous polyposis |
| CRC: Colorectal cancer | ||
| Colorectum (HTA11) |  | AD: Adenomas |
| SER: Sessile serrated lesions | ||
| MSI-H: Microsatellite-high colorectal cancer | ||
| MSS: Microsatellite stable colorectal cancer | ||
| Esophagus | 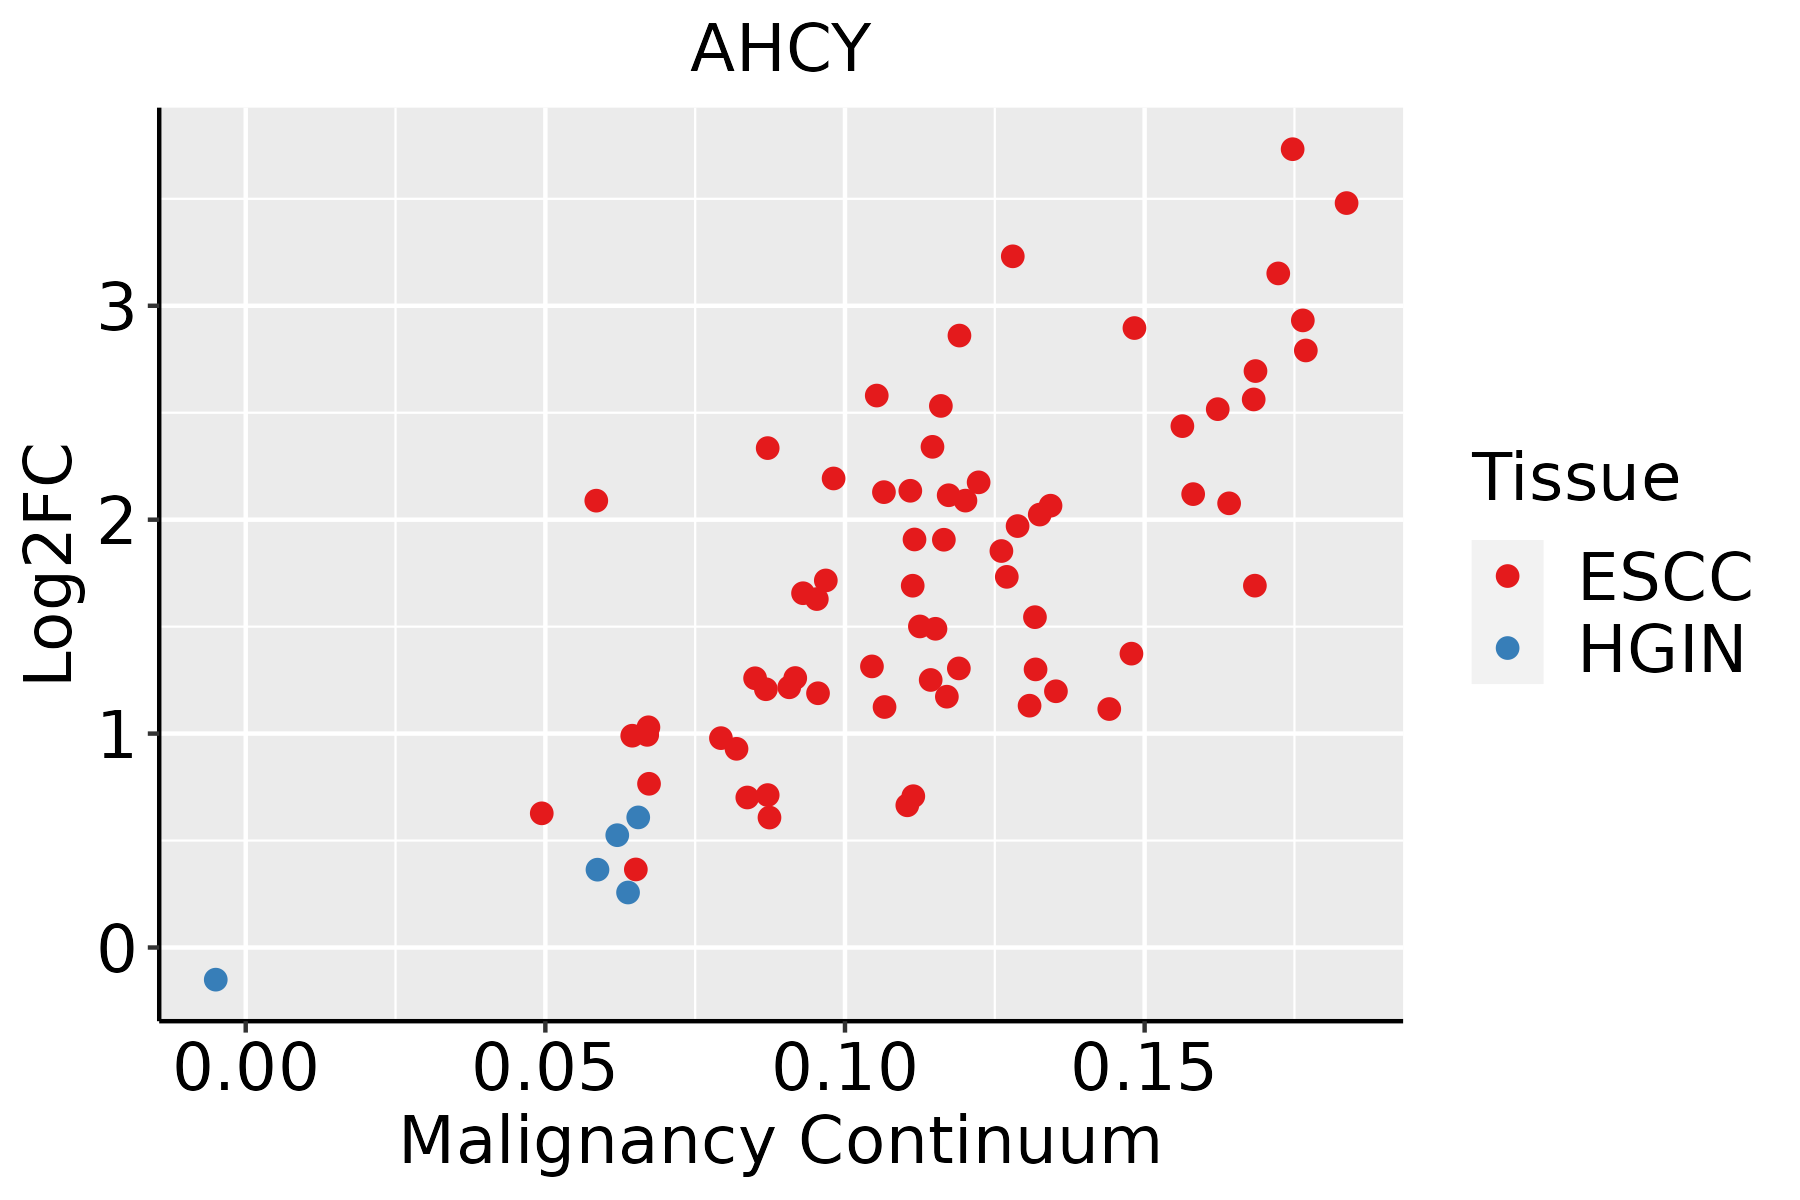 | ESCC: Esophageal squamous cell carcinoma |
| HGIN: High-grade intraepithelial neoplasias | ||
| LGIN: Low-grade intraepithelial neoplasias | ||
| Liver | 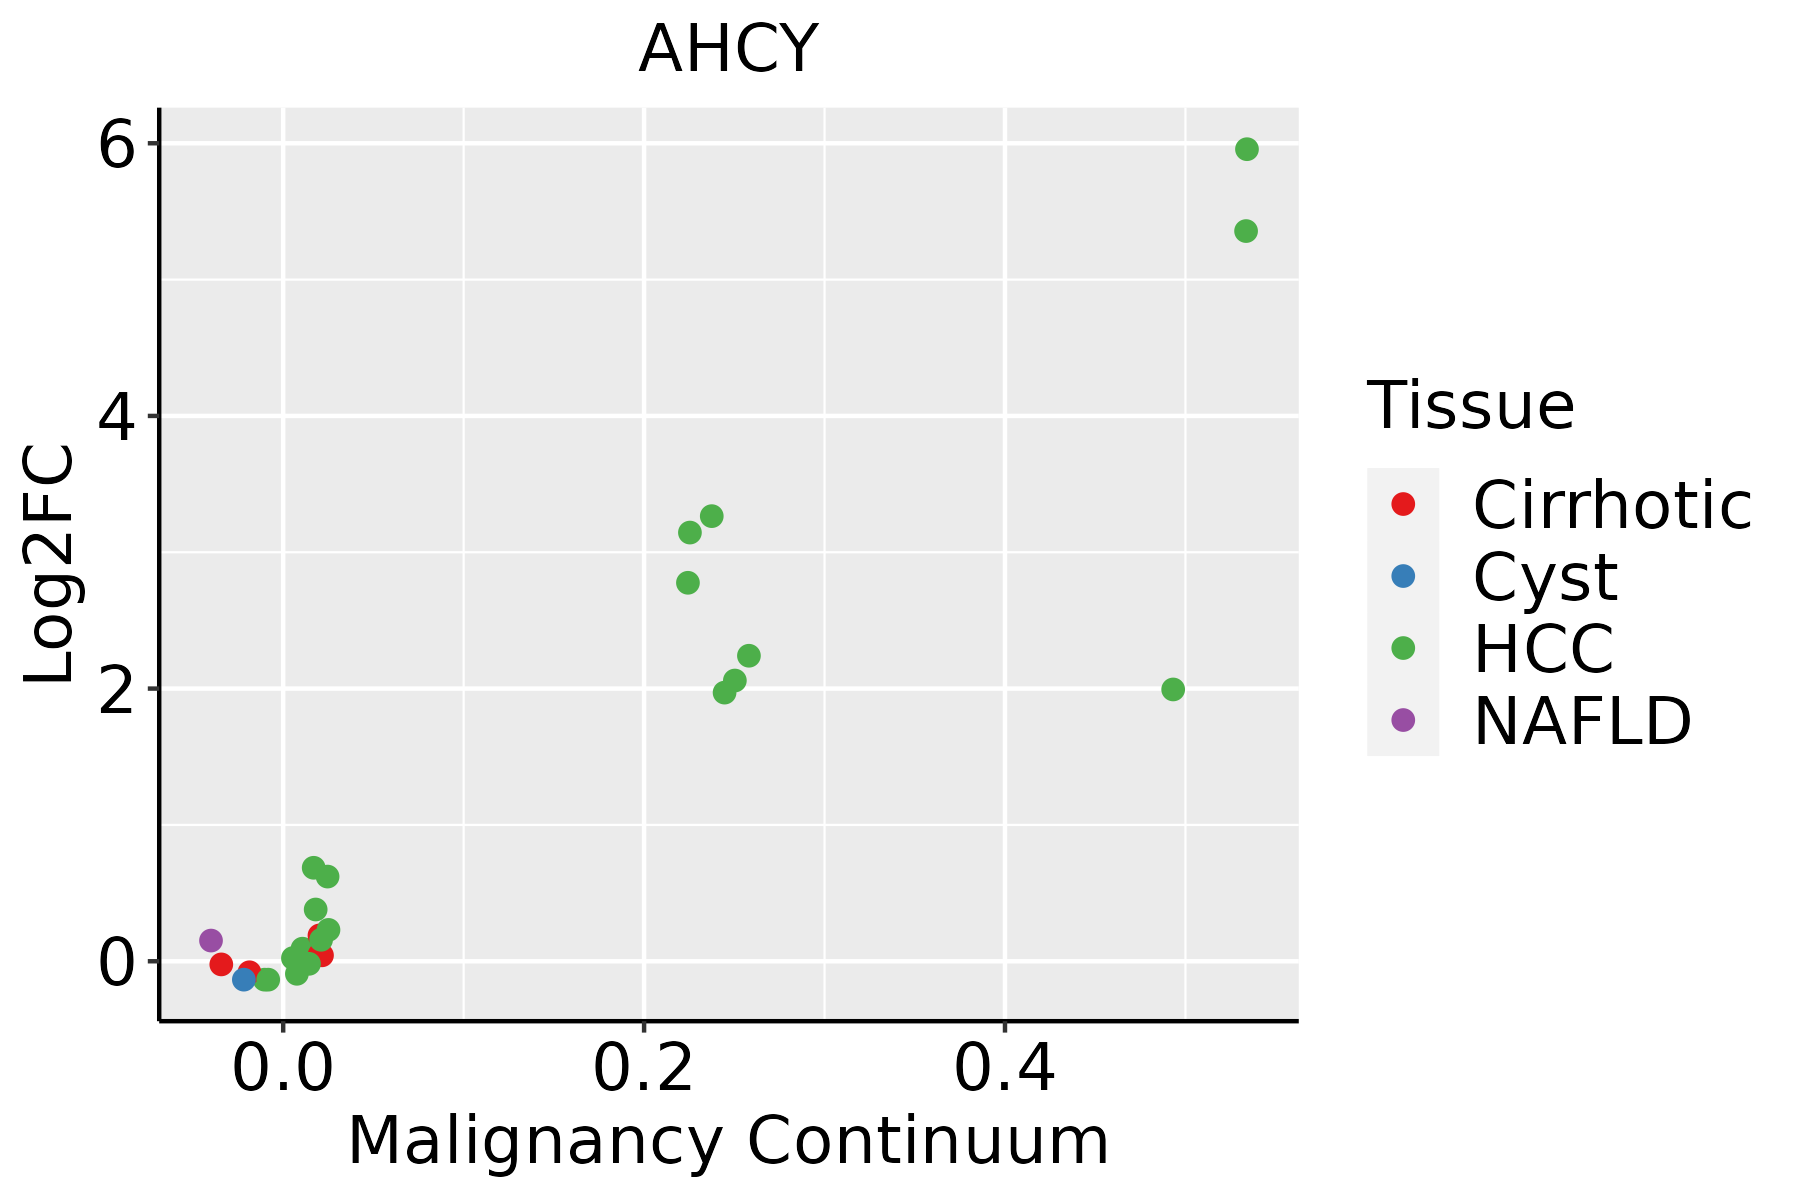 | HCC: Hepatocellular carcinoma |
| NAFLD: Non-alcoholic fatty liver disease | ||
| Oral Cavity | 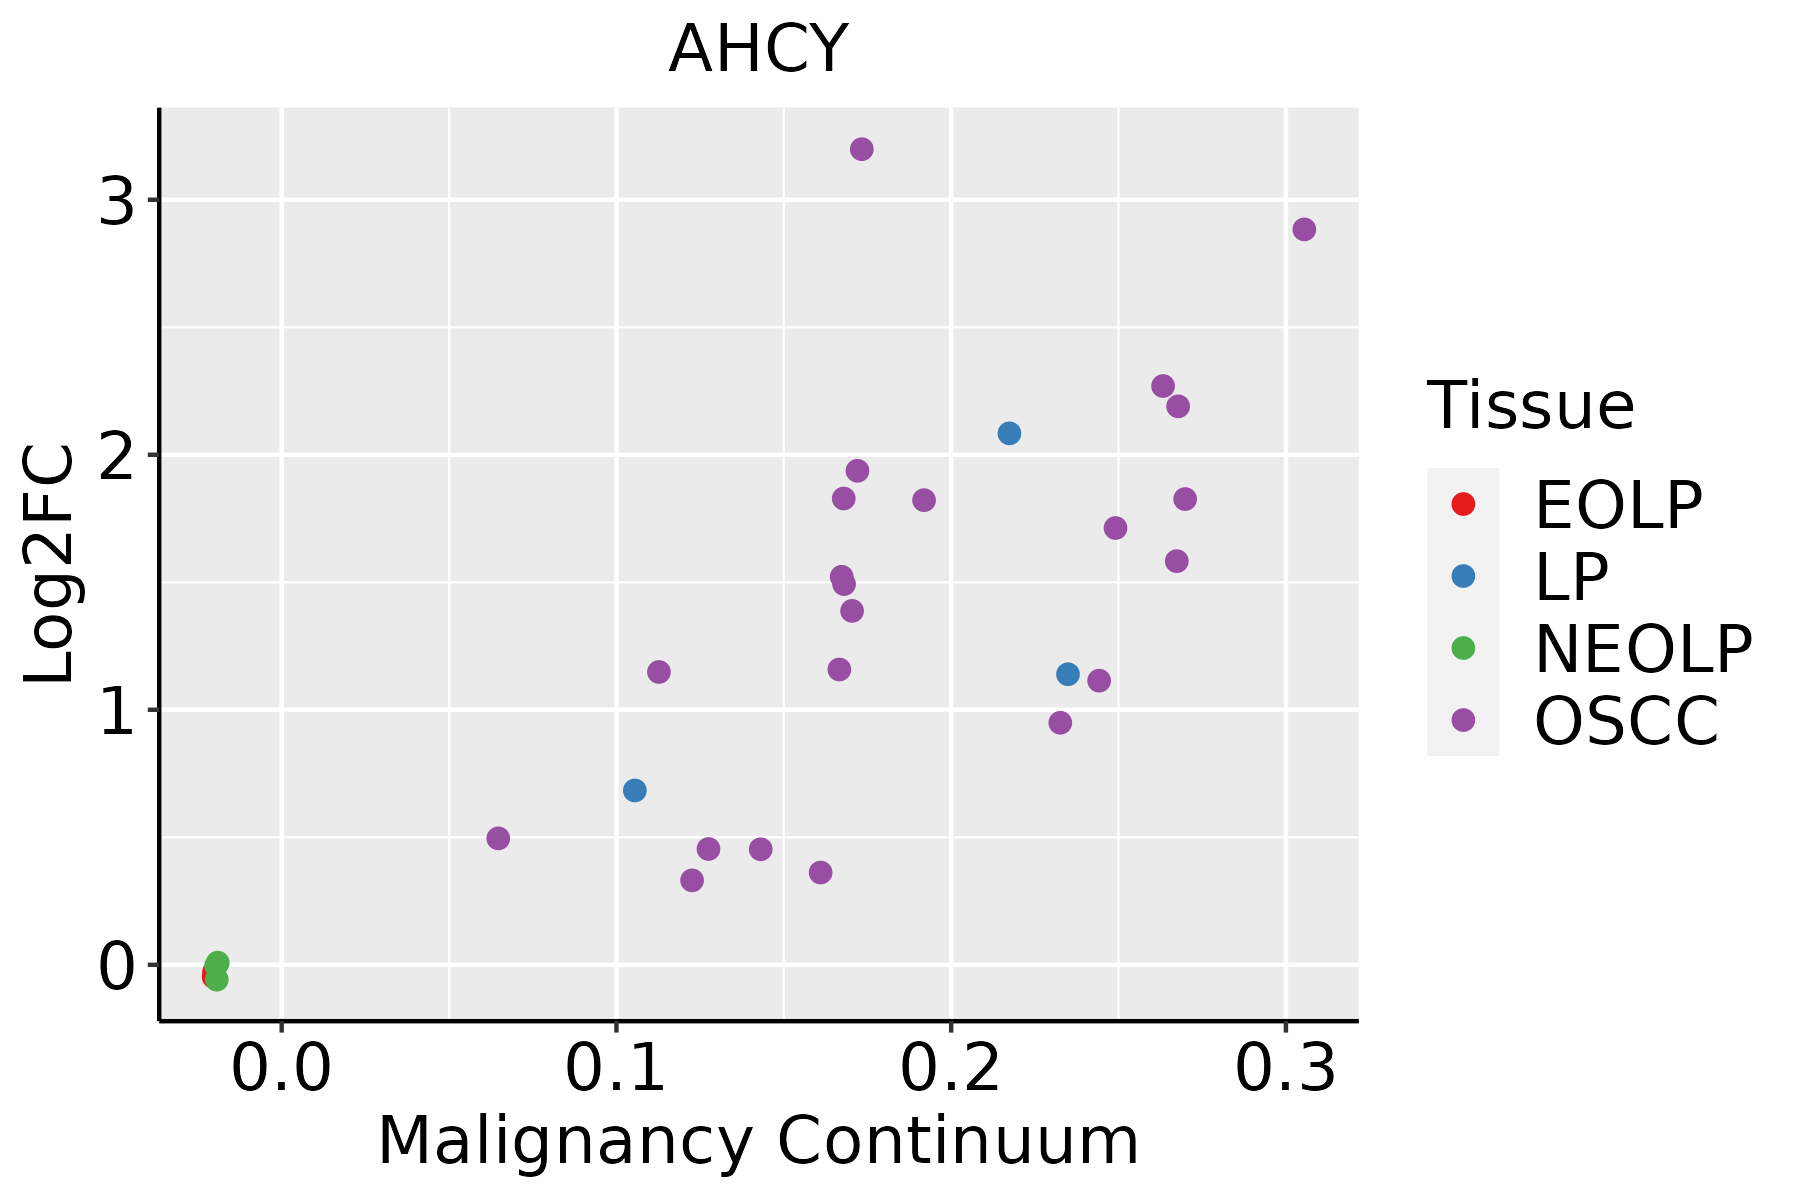 | EOLP: Erosive Oral lichen planus |
| LP: leukoplakia | ||
| NEOLP: Non-erosive oral lichen planus | ||
| OSCC: Oral squamous cell carcinoma | ||
| Prostate |  | BPH: Benign Prostatic Hyperplasia |
| Skin | 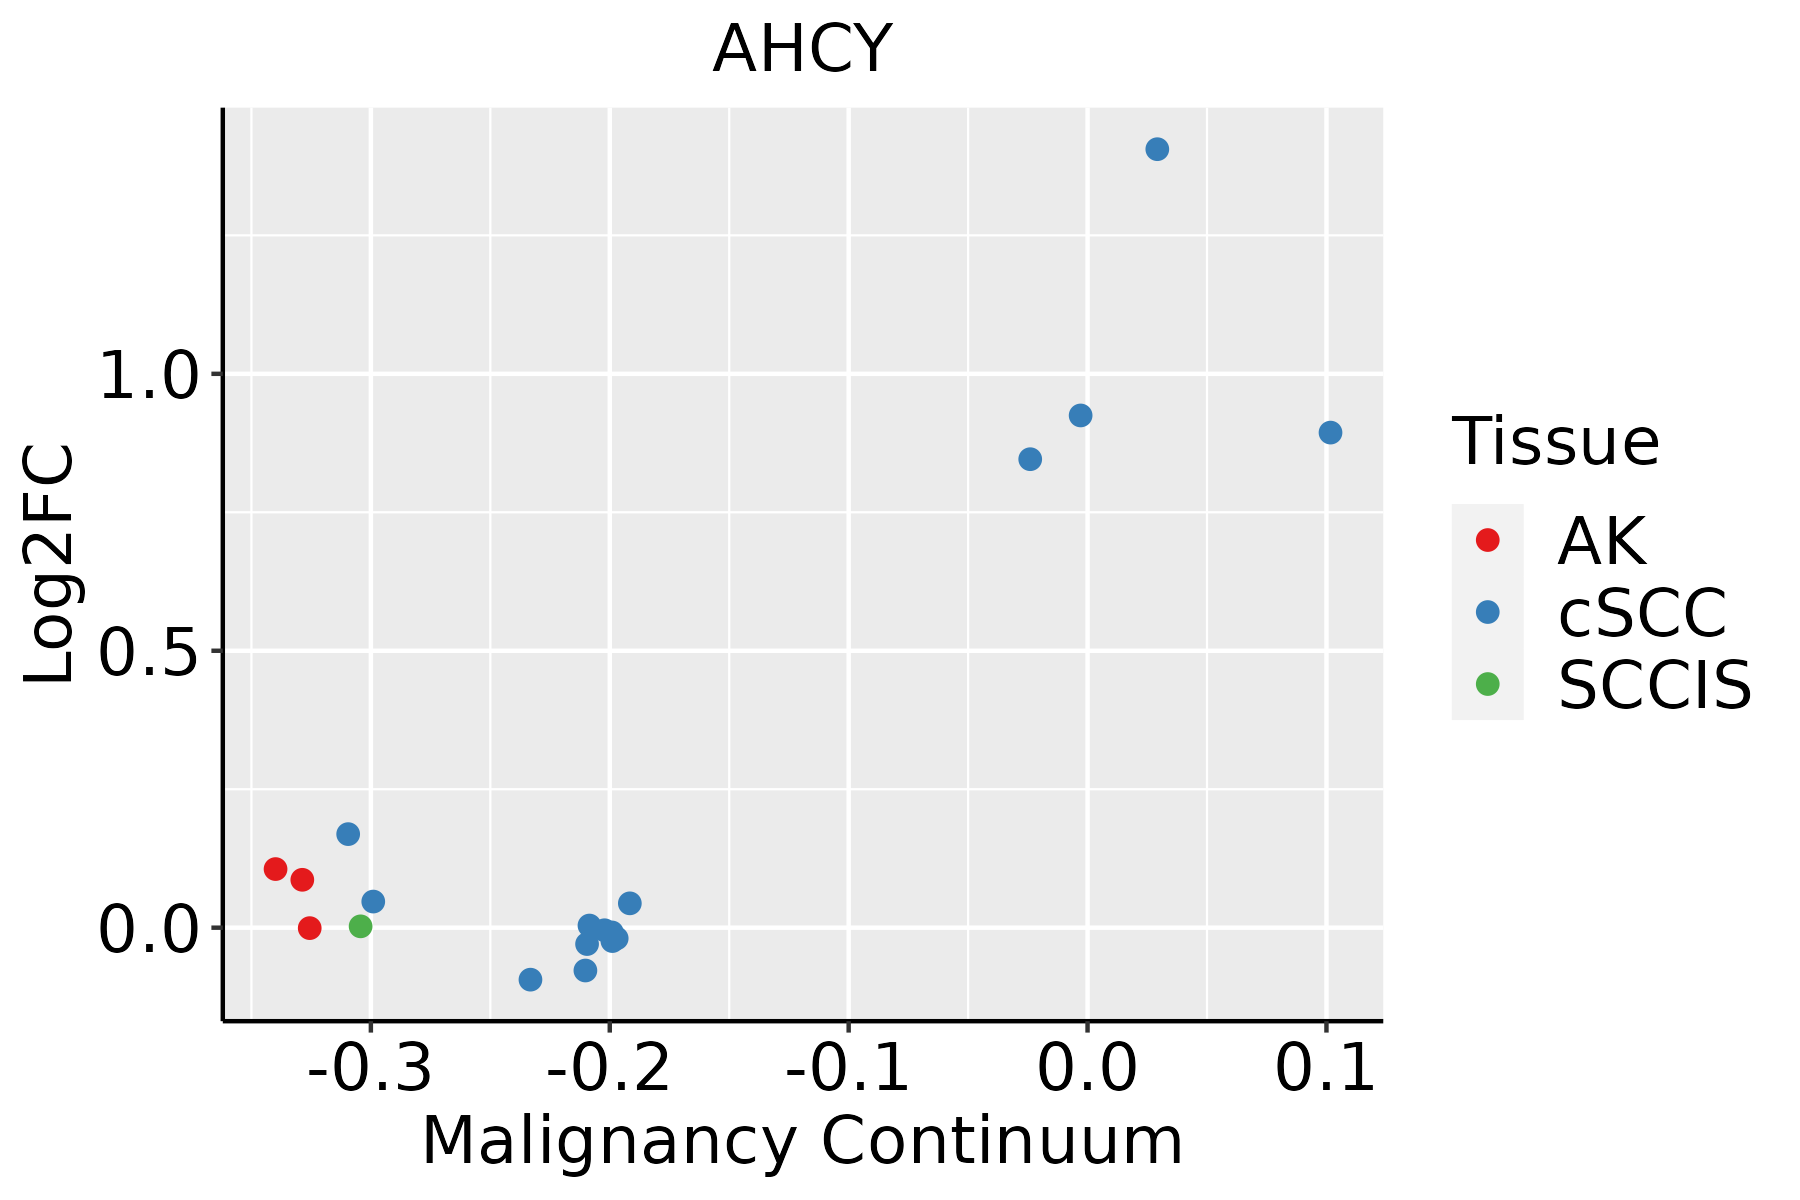 | AK: Actinic keratosis |
| cSCC: Cutaneous squamous cell carcinoma | ||
| SCCIS:squamous cell carcinoma in situ | ||
| Thyroid | 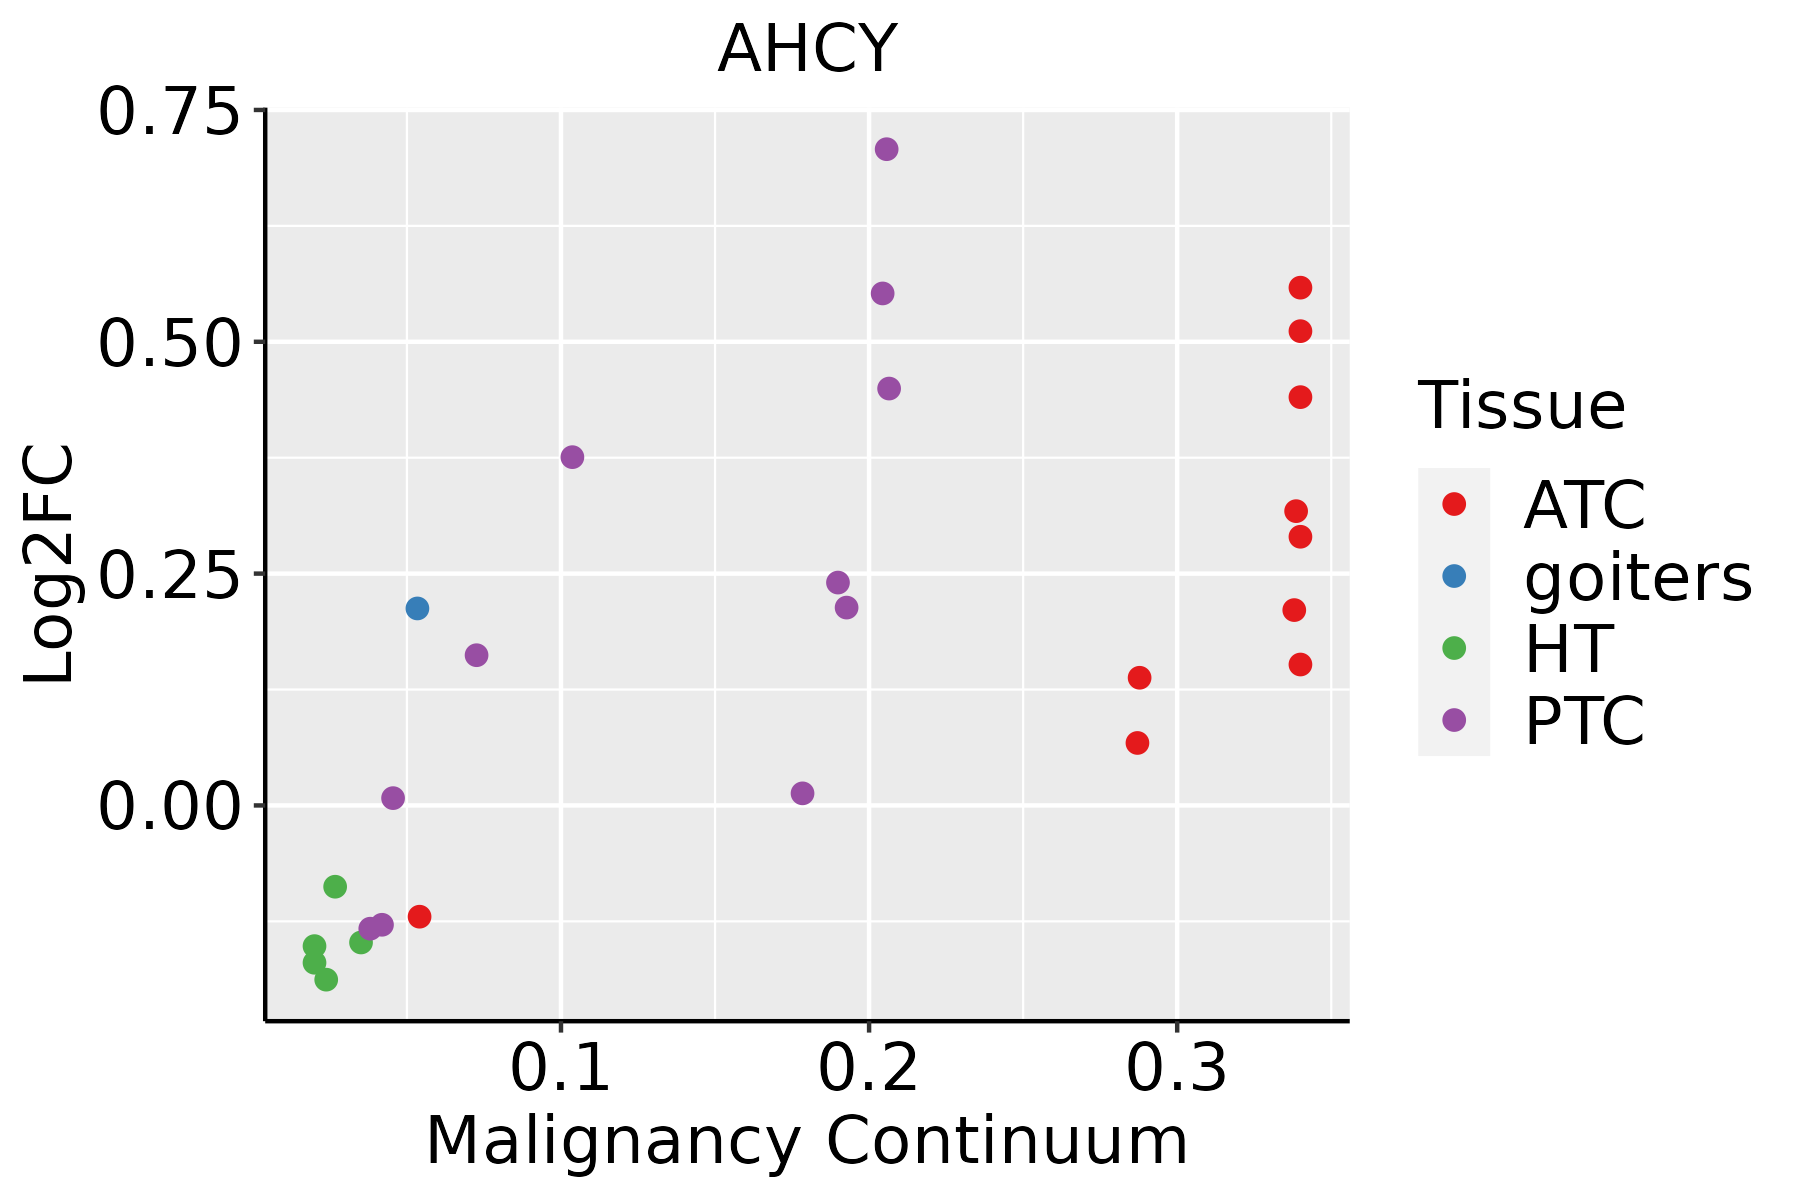 | ATC: Anaplastic thyroid cancer |
| HT: Hashimoto's thyroiditis | ||
| PTC: Papillary thyroid cancer |
| ∗log2FC in expression of this searched gene in stem-like cells from each diseased tissue sample relative to stem-like cells in normal samples in each tissue plotted against the malignancy continuum. Samples are colored based on if they are from different disease stage. |
Top |
Malignant transformation related pathway analysis |
| Find out the enriched GO biological processes and KEGG pathways involved in transition from healthy to precancer to cancer |
| Tissue | Disease Stage | Enriched GO biological Processes |
| Colorectum | AD |  |
| Colorectum | SER |  |
| Colorectum | MSS |  |
| Colorectum | MSI-H |  |
| Colorectum | FAP |  |
| ∗Top 15 enriched GO BP terms are showed in the bar plot of each disease state in each tissue. Each row represents a significant GO biological process which is colored according to the -log10(p.adjust). |
| Page: 1 2 3 4 5 6 7 8 9 |
| GO ID | Tissue | Disease Stage | Description | Gene Ratio | Bg Ratio | pvalue | p.adjust | Count |
| GO:1903311 | Colorectum | AD | regulation of mRNA metabolic process | 117/3918 | 288/18723 | 1.69e-14 | 4.23e-12 | 117 |
| GO:0072521 | Colorectum | AD | purine-containing compound metabolic process | 153/3918 | 416/18723 | 4.34e-14 | 1.01e-11 | 153 |
| GO:0050684 | Colorectum | AD | regulation of mRNA processing | 61/3918 | 137/18723 | 4.23e-10 | 3.58e-08 | 61 |
| GO:0044270 | Colorectum | AD | cellular nitrogen compound catabolic process | 147/3918 | 451/18723 | 3.35e-09 | 2.23e-07 | 147 |
| GO:0046700 | Colorectum | AD | heterocycle catabolic process | 145/3918 | 445/18723 | 4.37e-09 | 2.84e-07 | 145 |
| GO:0034655 | Colorectum | AD | nucleobase-containing compound catabolic process | 133/3918 | 407/18723 | 1.56e-08 | 9.12e-07 | 133 |
| GO:0019439 | Colorectum | AD | aromatic compound catabolic process | 146/3918 | 467/18723 | 7.48e-08 | 3.84e-06 | 146 |
| GO:1901361 | Colorectum | AD | organic cyclic compound catabolic process | 153/3918 | 495/18723 | 8.23e-08 | 4.18e-06 | 153 |
| GO:0006913 | Colorectum | AD | nucleocytoplasmic transport | 102/3918 | 301/18723 | 1.00e-07 | 4.85e-06 | 102 |
| GO:0051169 | Colorectum | AD | nuclear transport | 102/3918 | 301/18723 | 1.00e-07 | 4.85e-06 | 102 |
| GO:1901653 | Colorectum | AD | cellular response to peptide | 114/3918 | 359/18723 | 8.32e-07 | 2.88e-05 | 114 |
| GO:0044282 | Colorectum | AD | small molecule catabolic process | 118/3918 | 376/18723 | 1.05e-06 | 3.55e-05 | 118 |
| GO:0071375 | Colorectum | AD | cellular response to peptide hormone stimulus | 95/3918 | 290/18723 | 1.50e-06 | 4.66e-05 | 95 |
| GO:0043434 | Colorectum | AD | response to peptide hormone | 126/3918 | 414/18723 | 2.70e-06 | 7.86e-05 | 126 |
| GO:0007623 | Colorectum | AD | circadian rhythm | 72/3918 | 210/18723 | 4.50e-06 | 1.21e-04 | 72 |
| GO:0048511 | Colorectum | AD | rhythmic process | 94/3918 | 298/18723 | 1.00e-05 | 2.34e-04 | 94 |
| GO:0031667 | Colorectum | AD | response to nutrient levels | 138/3918 | 474/18723 | 1.22e-05 | 2.68e-04 | 138 |
| GO:0002028 | Colorectum | AD | regulation of sodium ion transport | 36/3918 | 90/18723 | 2.89e-05 | 5.37e-04 | 36 |
| GO:0006790 | Colorectum | AD | sulfur compound metabolic process | 101/3918 | 339/18723 | 6.46e-05 | 1.07e-03 | 101 |
| GO:0051168 | Colorectum | AD | nuclear export | 53/3918 | 154/18723 | 6.89e-05 | 1.11e-03 | 53 |
| Page: 1 2 3 4 5 6 7 8 9 10 11 12 13 14 15 16 17 18 19 20 21 22 23 24 25 26 27 |
| Pathway ID | Tissue | Disease Stage | Description | Gene Ratio | Bg Ratio | pvalue | p.adjust | qvalue | Count |
| hsa00270 | Liver | Cirrhotic | Cysteine and methionine metabolism | 27/2530 | 52/8465 | 6.98e-04 | 4.15e-03 | 2.56e-03 | 27 |
| hsa002701 | Liver | Cirrhotic | Cysteine and methionine metabolism | 27/2530 | 52/8465 | 6.98e-04 | 4.15e-03 | 2.56e-03 | 27 |
| hsa002702 | Liver | HCC | Cysteine and methionine metabolism | 35/4020 | 52/8465 | 3.03e-03 | 9.94e-03 | 5.53e-03 | 35 |
| hsa002703 | Liver | HCC | Cysteine and methionine metabolism | 35/4020 | 52/8465 | 3.03e-03 | 9.94e-03 | 5.53e-03 | 35 |
| Page: 1 |
Top |
Cell-cell communication analysis |
| Identification of potential cell-cell interactions between two cell types and their ligand-receptor pairs for different disease states |
| Ligand | Receptor | LRpair | Pathway | Tissue | Disease Stage |
| Page: 1 |
Top |
Single-cell gene regulatory network inference analysis |
| Find out the significant the regulons (TFs) and the target genes of each regulon across cell types for different disease states |
| TF | Cell Type | Tissue | Disease Stage | Target Gene | RSS | Regulon Activity |
| ∗The dot plots of a searched regulon are shown for all cell subpopulations in each disease state of each tissue based on the regulon specific score inferred using pySCENIC and by calculating the average expression. |
| Page: 1 |
Top |
Somatic mutation of malignant transformation related genes |
| Annotation of somatic variants for genes involved in malignant transformation |
| Hugo Symbol | Variant Class | Variant Classification | dbSNP RS | HGVSc | HGVSp | HGVSp Short | SWISSPROT | BIOTYPE | SIFT | PolyPhen | Tumor Sample Barcode | Tissue | Histology | Sex | Age | Stage | Therapy Types | Drugs | Outcome |
| AHCY | SNV | Missense_Mutation | rs377090568 | c.1280N>T | p.Pro427Leu | p.P427L | P23526 | protein_coding | tolerated_low_confidence(0.06) | benign(0.118) | TCGA-AR-A24L-01 | Breast | breast invasive carcinoma | Female | <65 | I/II | Hormone Therapy | tamoxiphen | PD |
| AHCY | SNV | Missense_Mutation | novel | c.243C>G | p.Ile81Met | p.I81M | P23526 | protein_coding | deleterious_low_confidence(0) | probably_damaging(0.979) | TCGA-AR-A2LE-01 | Breast | breast invasive carcinoma | Female | >=65 | I/II | Hormone Therapy | tamoxiphen | PD |
| AHCY | SNV | Missense_Mutation | novel | c.635N>A | p.Ala212Asp | p.A212D | P23526 | protein_coding | deleterious_low_confidence(0) | probably_damaging(0.973) | TCGA-BH-A18Q-01 | Breast | breast invasive carcinoma | Female | <65 | I/II | Unknown | Unknown | SD |
| AHCY | SNV | Missense_Mutation | c.322N>C | p.Glu108Gln | p.E108Q | P23526 | protein_coding | deleterious_low_confidence(0.02) | possibly_damaging(0.876) | TCGA-C8-A134-01 | Breast | breast invasive carcinoma | Female | <65 | I/II | Chemotherapy | 5-fluorouracil | CR | |
| AHCY | insertion | Frame_Shift_Ins | novel | c.220-1_220insCCCAGCGACCCCACAGGAAAGAGCTGCTTTGTCCCAT | p.Val74ProfsTer54 | p.V74Pfs*54 | P23526 | protein_coding | TCGA-AN-A0FN-01 | Breast | breast invasive carcinoma | Female | <65 | I/II | Unknown | Unknown | SD | ||
| AHCY | SNV | Missense_Mutation | rs767274069 | c.1027N>T | p.Arg343Trp | p.R343W | P23526 | protein_coding | deleterious_low_confidence(0) | probably_damaging(0.966) | TCGA-2W-A8YY-01 | Cervix | cervical & endocervical cancer | Female | <65 | I/II | Chemotherapy | cisplatin | CR |
| AHCY | SNV | Missense_Mutation | novel | c.501G>A | p.Met167Ile | p.M167I | P23526 | protein_coding | deleterious_low_confidence(0) | benign(0.115) | TCGA-VS-A959-01 | Cervix | cervical & endocervical cancer | Female | >=65 | I/II | Unknown | Unknown | SD |
| AHCY | SNV | Missense_Mutation | novel | c.802G>C | p.Glu268Gln | p.E268Q | P23526 | protein_coding | tolerated_low_confidence(0.24) | benign(0.056) | TCGA-AA-3947-01 | Colorectum | colon adenocarcinoma | Female | <65 | I/II | Unknown | Unknown | SD |
| AHCY | SNV | Missense_Mutation | c.722N>C | p.Ile241Thr | p.I241T | P23526 | protein_coding | deleterious_low_confidence(0) | possibly_damaging(0.871) | TCGA-AA-3966-01 | Colorectum | colon adenocarcinoma | Female | >=65 | I/II | Unknown | Unknown | SD | |
| AHCY | SNV | Missense_Mutation | c.1094A>G | p.Gln365Arg | p.Q365R | P23526 | protein_coding | deleterious_low_confidence(0.01) | possibly_damaging(0.829) | TCGA-AA-A010-01 | Colorectum | colon adenocarcinoma | Female | <65 | I/II | Chemotherapy | folinic | CR |
| Page: 1 2 3 4 5 |
Top |
Related drugs of malignant transformation related genes |
| Identification of chemicals and drugs interact with genes involved in malignant transfromation |
| (DGIdb 4.0) |
| Entrez ID | Symbol | Category | Interaction Types | Drug Claim Name | Drug Name | PMIDs |
| 191 | AHCY | DRUGGABLE GENOME, G PROTEIN COUPLED RECEPTOR, ENZYME | inhibitor | 178101808 | CHEMBL202701 |
| Page: 1 |

Copyright 2023-Present -The University of Texas Health Science Center at Houston |