
|
|||||
|
 | |
| |
| |
| |
| |
| |
|
Gene: AHCTF1 |
Gene summary for AHCTF1 |
| Gene information | Species | Human | Gene symbol | AHCTF1 | Gene ID | 25909 |
| Gene name | AT-hook containing transcription factor 1 | |
| Gene Alias | ELYS | |
| Cytomap | 1q44 | |
| Gene Type | protein-coding | GO ID | GO:0000910 | UniProtAcc | Q8WYP5 |
Top |
Malignant transformation analysis |
| Identification of the aberrant gene expression in precancerous and cancerous lesions by comparing the gene expression of stem-like cells in diseased tissues with normal stem cells |
| Entrez ID | Symbol | Replicates | Species | Organ | Tissue | Adj P-value | Log2FC | Malignancy |
| 25909 | AHCTF1 | CCI_1 | Human | Cervix | CC | 1.88e-05 | 7.08e-01 | 0.528 |
| 25909 | AHCTF1 | CCI_2 | Human | Cervix | CC | 1.08e-04 | 8.04e-01 | 0.5249 |
| 25909 | AHCTF1 | CCI_3 | Human | Cervix | CC | 4.71e-06 | 7.70e-01 | 0.516 |
| 25909 | AHCTF1 | LZE2T | Human | Esophagus | ESCC | 1.10e-03 | 6.20e-01 | 0.082 |
| 25909 | AHCTF1 | LZE4T | Human | Esophagus | ESCC | 4.17e-06 | 2.32e-01 | 0.0811 |
| 25909 | AHCTF1 | LZE5T | Human | Esophagus | ESCC | 6.71e-03 | 1.78e-01 | 0.0514 |
| 25909 | AHCTF1 | LZE7T | Human | Esophagus | ESCC | 2.42e-07 | 6.41e-01 | 0.0667 |
| 25909 | AHCTF1 | LZE8T | Human | Esophagus | ESCC | 3.87e-05 | 4.30e-02 | 0.067 |
| 25909 | AHCTF1 | LZE20T | Human | Esophagus | ESCC | 1.60e-02 | -4.27e-03 | 0.0662 |
| 25909 | AHCTF1 | LZE22T | Human | Esophagus | ESCC | 1.84e-03 | 2.83e-01 | 0.068 |
| 25909 | AHCTF1 | LZE24T | Human | Esophagus | ESCC | 6.04e-04 | 2.87e-01 | 0.0596 |
| 25909 | AHCTF1 | P1T-E | Human | Esophagus | ESCC | 5.65e-04 | 2.74e-01 | 0.0875 |
| 25909 | AHCTF1 | P2T-E | Human | Esophagus | ESCC | 7.10e-16 | 3.74e-01 | 0.1177 |
| 25909 | AHCTF1 | P4T-E | Human | Esophagus | ESCC | 3.32e-09 | 2.74e-01 | 0.1323 |
| 25909 | AHCTF1 | P5T-E | Human | Esophagus | ESCC | 8.20e-24 | 6.10e-01 | 0.1327 |
| 25909 | AHCTF1 | P8T-E | Human | Esophagus | ESCC | 1.07e-12 | 1.89e-01 | 0.0889 |
| 25909 | AHCTF1 | P9T-E | Human | Esophagus | ESCC | 5.32e-15 | 2.78e-01 | 0.1131 |
| 25909 | AHCTF1 | P10T-E | Human | Esophagus | ESCC | 4.08e-16 | 2.86e-01 | 0.116 |
| 25909 | AHCTF1 | P11T-E | Human | Esophagus | ESCC | 1.29e-13 | 3.45e-01 | 0.1426 |
| 25909 | AHCTF1 | P12T-E | Human | Esophagus | ESCC | 4.76e-22 | 4.74e-01 | 0.1122 |
| Page: 1 2 3 4 5 |
| Tissue | Expression Dynamics | Abbreviation |
| Cervix | 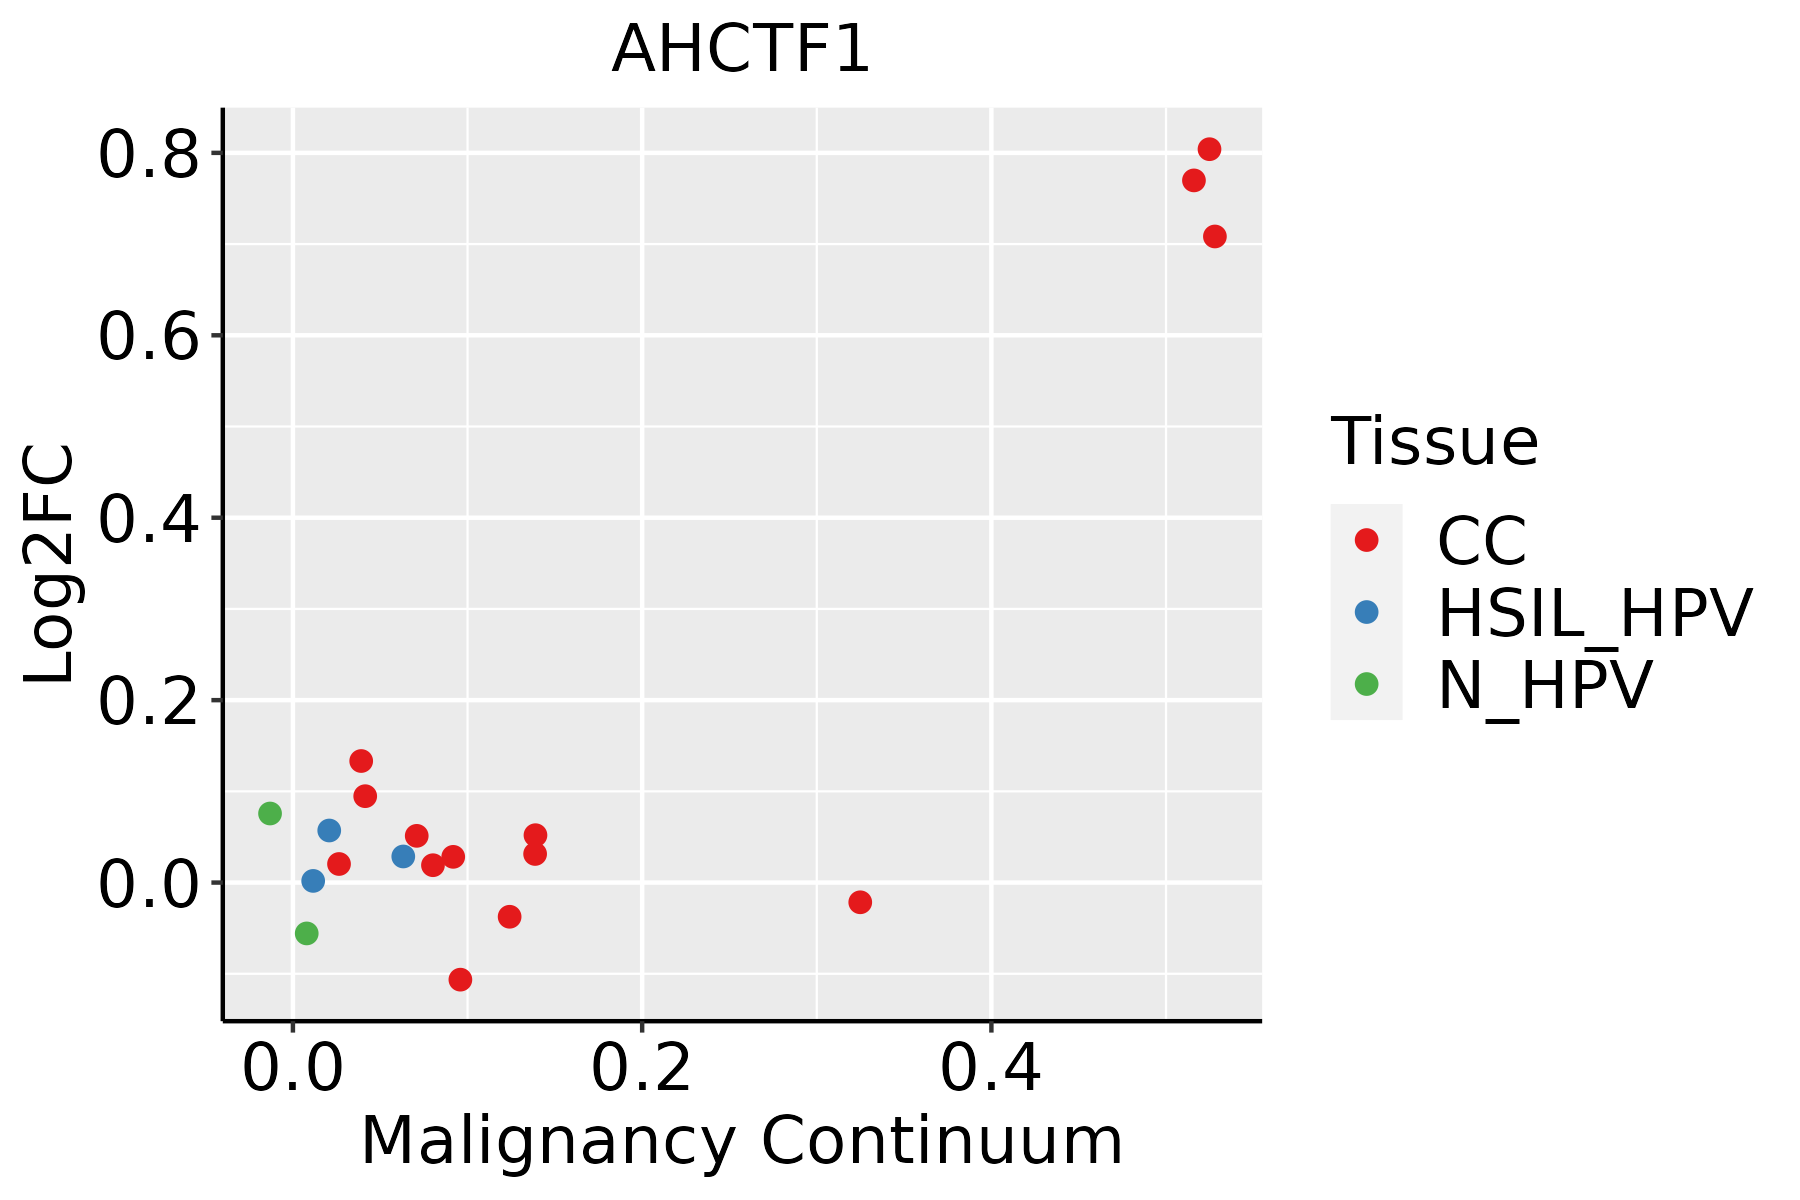 | CC: Cervix cancer |
| HSIL_HPV: HPV-infected high-grade squamous intraepithelial lesions | ||
| N_HPV: HPV-infected normal cervix | ||
| Esophagus | 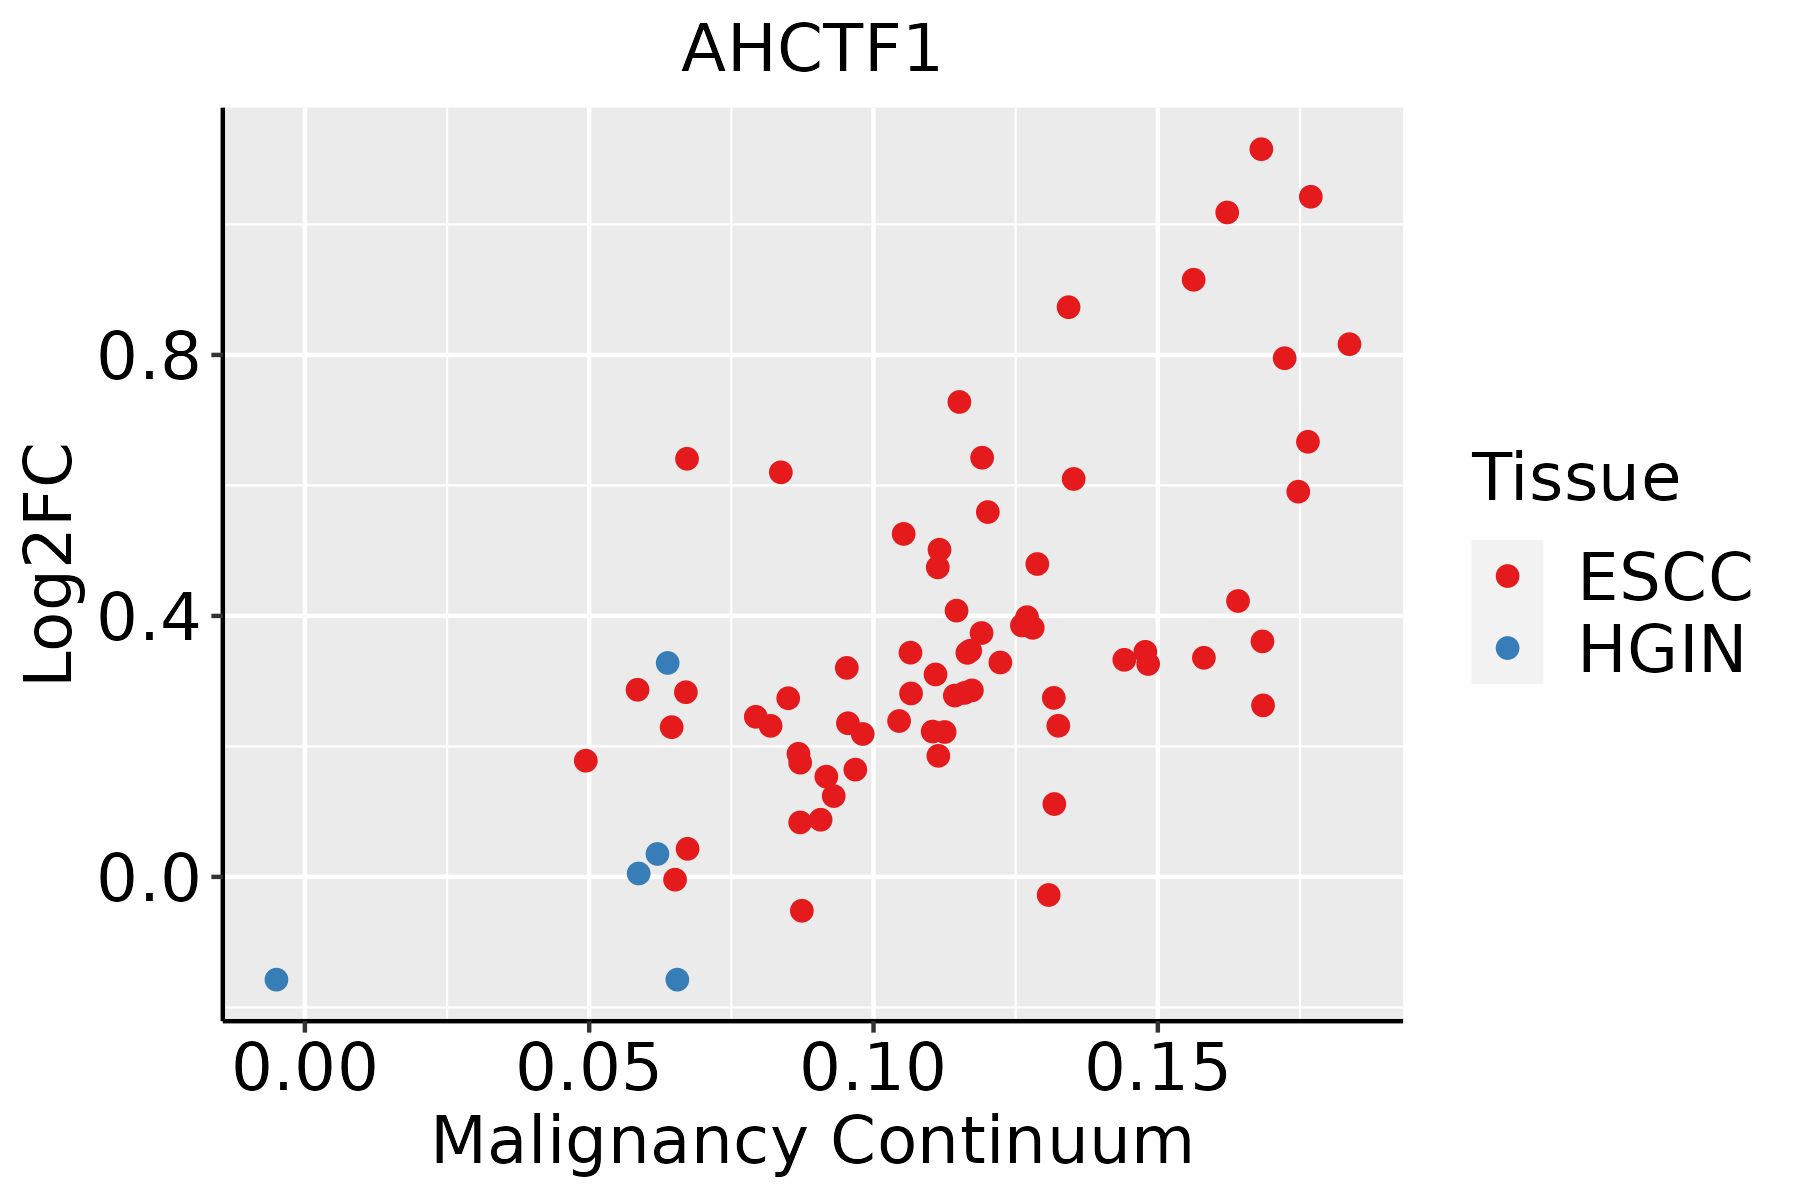 | ESCC: Esophageal squamous cell carcinoma |
| HGIN: High-grade intraepithelial neoplasias | ||
| LGIN: Low-grade intraepithelial neoplasias | ||
| Liver | 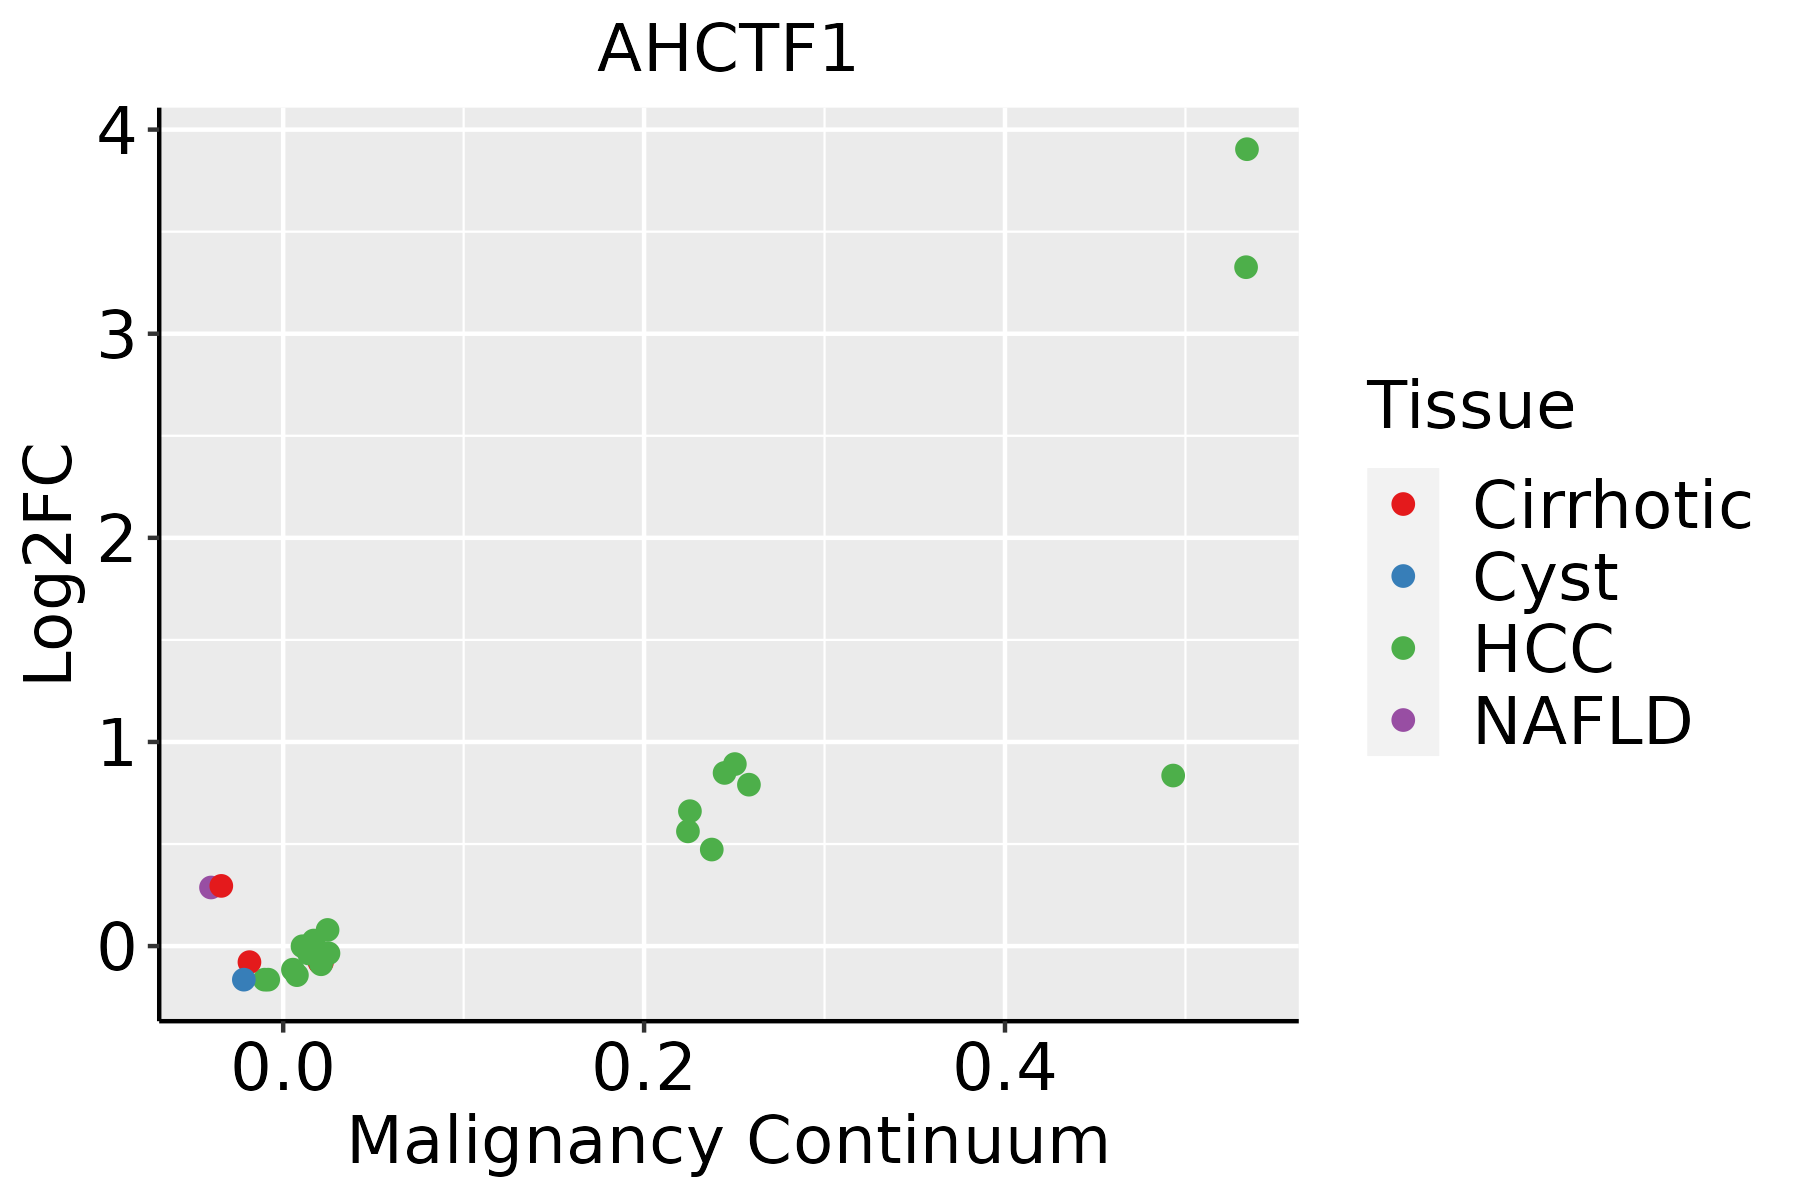 | HCC: Hepatocellular carcinoma |
| NAFLD: Non-alcoholic fatty liver disease | ||
| Oral Cavity |  | EOLP: Erosive Oral lichen planus |
| LP: leukoplakia | ||
| NEOLP: Non-erosive oral lichen planus | ||
| OSCC: Oral squamous cell carcinoma | ||
| Thyroid | 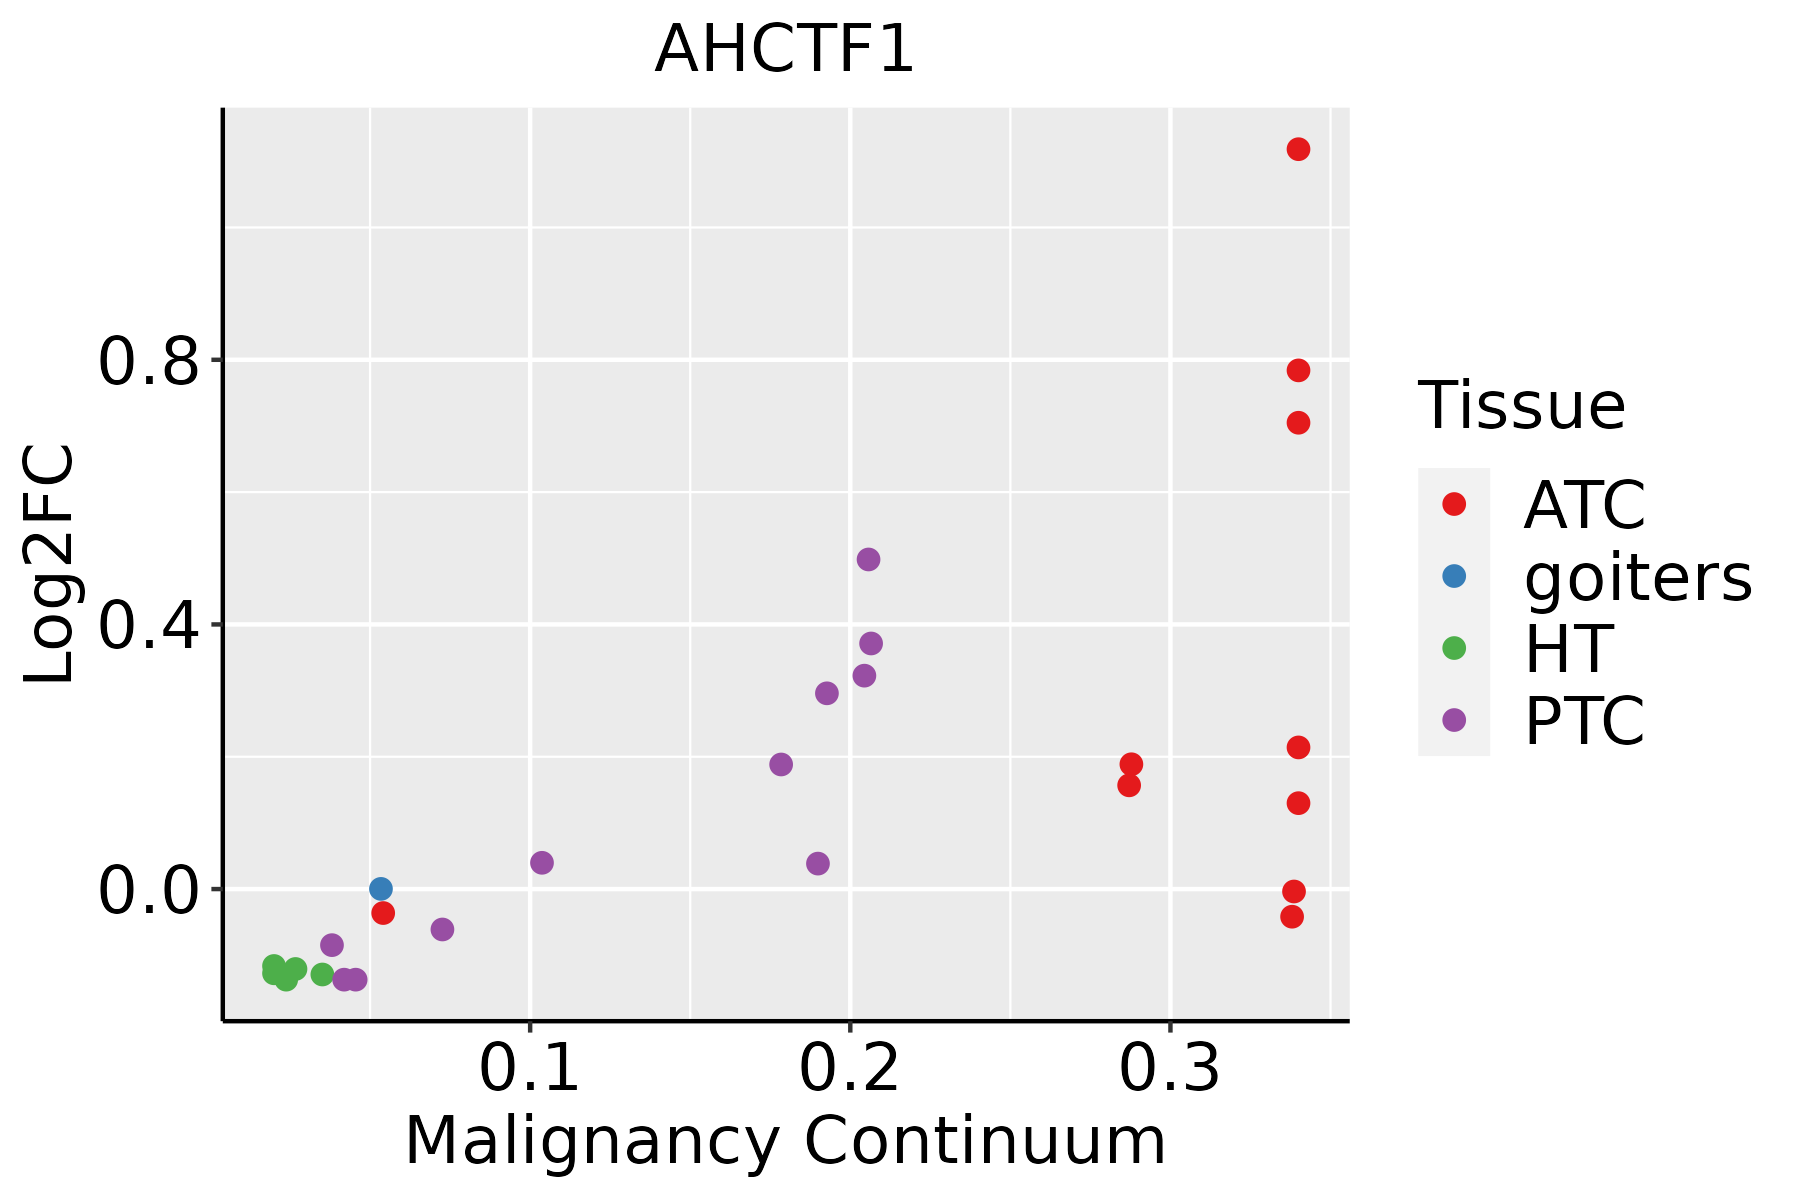 | ATC: Anaplastic thyroid cancer |
| HT: Hashimoto's thyroiditis | ||
| PTC: Papillary thyroid cancer |
| ∗log2FC in expression of this searched gene in stem-like cells from each diseased tissue sample relative to stem-like cells in normal samples in each tissue plotted against the malignancy continuum. Samples are colored based on if they are from different disease stage. |
Top |
Malignant transformation related pathway analysis |
| Find out the enriched GO biological processes and KEGG pathways involved in transition from healthy to precancer to cancer |
| Tissue | Disease Stage | Enriched GO biological Processes |
| Colorectum | AD |  |
| Colorectum | SER |  |
| Colorectum | MSS |  |
| Colorectum | MSI-H |  |
| Colorectum | FAP |  |
| ∗Top 15 enriched GO BP terms are showed in the bar plot of each disease state in each tissue. Each row represents a significant GO biological process which is colored according to the -log10(p.adjust). |
| Page: 1 2 3 4 5 6 7 8 9 |
| GO ID | Tissue | Disease Stage | Description | Gene Ratio | Bg Ratio | pvalue | p.adjust | Count |
| GO:00512368 | Cervix | CC | establishment of RNA localization | 39/2311 | 166/18723 | 4.76e-05 | 7.25e-04 | 39 |
| GO:00506578 | Cervix | CC | nucleic acid transport | 38/2311 | 163/18723 | 7.06e-05 | 9.85e-04 | 38 |
| GO:00506588 | Cervix | CC | RNA transport | 38/2311 | 163/18723 | 7.06e-05 | 9.85e-04 | 38 |
| GO:000640310 | Cervix | CC | RNA localization | 43/2311 | 201/18723 | 2.00e-04 | 2.29e-03 | 43 |
| GO:00510284 | Cervix | CC | mRNA transport | 31/2311 | 130/18723 | 2.05e-04 | 2.33e-03 | 31 |
| GO:00513021 | Cervix | CC | regulation of cell division | 39/2311 | 177/18723 | 2.05e-04 | 2.33e-03 | 39 |
| GO:00469312 | Cervix | CC | pore complex assembly | 9/2311 | 20/18723 | 3.06e-04 | 3.27e-03 | 9 |
| GO:00009107 | Cervix | CC | cytokinesis | 37/2311 | 173/18723 | 5.40e-04 | 5.23e-03 | 37 |
| GO:0032465 | Cervix | CC | regulation of cytokinesis | 22/2311 | 92/18723 | 1.55e-03 | 1.20e-02 | 22 |
| GO:00159318 | Cervix | CC | nucleobase-containing compound transport | 43/2311 | 222/18723 | 1.72e-03 | 1.30e-02 | 43 |
| GO:00069991 | Cervix | CC | nuclear pore organization | 6/2311 | 14/18723 | 4.36e-03 | 2.67e-02 | 6 |
| GO:0006403110 | Esophagus | ESCC | RNA localization | 166/8552 | 201/18723 | 1.95e-27 | 6.18e-25 | 166 |
| GO:005123617 | Esophagus | ESCC | establishment of RNA localization | 134/8552 | 166/18723 | 1.23e-20 | 1.81e-18 | 134 |
| GO:005102815 | Esophagus | ESCC | mRNA transport | 110/8552 | 130/18723 | 2.76e-20 | 3.80e-18 | 110 |
| GO:005065717 | Esophagus | ESCC | nucleic acid transport | 131/8552 | 163/18723 | 6.94e-20 | 8.46e-18 | 131 |
| GO:005065817 | Esophagus | ESCC | RNA transport | 131/8552 | 163/18723 | 6.94e-20 | 8.46e-18 | 131 |
| GO:001593117 | Esophagus | ESCC | nucleobase-containing compound transport | 162/8552 | 222/18723 | 9.87e-17 | 7.93e-15 | 162 |
| GO:000699713 | Esophagus | ESCC | nucleus organization | 96/8552 | 133/18723 | 4.66e-10 | 1.21e-08 | 96 |
| GO:000091016 | Esophagus | ESCC | cytokinesis | 115/8552 | 173/18723 | 2.48e-08 | 4.68e-07 | 115 |
| GO:00069994 | Esophagus | ESCC | nuclear pore organization | 14/8552 | 14/18723 | 1.71e-05 | 1.52e-04 | 14 |
| Page: 1 2 3 4 5 |
| Pathway ID | Tissue | Disease Stage | Description | Gene Ratio | Bg Ratio | pvalue | p.adjust | qvalue | Count |
| hsa0301321 | Esophagus | ESCC | Nucleocytoplasmic transport | 89/4205 | 108/8465 | 1.20e-12 | 2.37e-11 | 1.21e-11 | 89 |
| hsa0301331 | Esophagus | ESCC | Nucleocytoplasmic transport | 89/4205 | 108/8465 | 1.20e-12 | 2.37e-11 | 1.21e-11 | 89 |
| hsa03013 | Liver | HCC | Nucleocytoplasmic transport | 81/4020 | 108/8465 | 4.28e-09 | 6.83e-08 | 3.80e-08 | 81 |
| hsa030131 | Liver | HCC | Nucleocytoplasmic transport | 81/4020 | 108/8465 | 4.28e-09 | 6.83e-08 | 3.80e-08 | 81 |
| hsa030136 | Oral cavity | OSCC | Nucleocytoplasmic transport | 82/3704 | 108/8465 | 7.93e-12 | 1.33e-10 | 6.77e-11 | 82 |
| hsa0301311 | Oral cavity | OSCC | Nucleocytoplasmic transport | 82/3704 | 108/8465 | 7.93e-12 | 1.33e-10 | 6.77e-11 | 82 |
| hsa030134 | Oral cavity | EOLP | Nucleocytoplasmic transport | 34/1218 | 108/8465 | 4.24e-06 | 2.91e-05 | 1.72e-05 | 34 |
| hsa030135 | Oral cavity | EOLP | Nucleocytoplasmic transport | 34/1218 | 108/8465 | 4.24e-06 | 2.91e-05 | 1.72e-05 | 34 |
| Page: 1 |
Top |
Cell-cell communication analysis |
| Identification of potential cell-cell interactions between two cell types and their ligand-receptor pairs for different disease states |
| Ligand | Receptor | LRpair | Pathway | Tissue | Disease Stage |
| Page: 1 |
Top |
Single-cell gene regulatory network inference analysis |
| Find out the significant the regulons (TFs) and the target genes of each regulon across cell types for different disease states |
| TF | Cell Type | Tissue | Disease Stage | Target Gene | RSS | Regulon Activity |
| ∗The dot plots of a searched regulon are shown for all cell subpopulations in each disease state of each tissue based on the regulon specific score inferred using pySCENIC and by calculating the average expression. |
| Page: 1 |
Top |
Somatic mutation of malignant transformation related genes |
| Annotation of somatic variants for genes involved in malignant transformation |
| Hugo Symbol | Variant Class | Variant Classification | dbSNP RS | HGVSc | HGVSp | HGVSp Short | SWISSPROT | BIOTYPE | SIFT | PolyPhen | Tumor Sample Barcode | Tissue | Histology | Sex | Age | Stage | Therapy Types | Drugs | Outcome |
| AHCTF1 | SNV | Missense_Mutation | c.6776N>C | p.Arg2259Thr | p.R2259T | Q8WYP5 | protein_coding | deleterious(0.01) | possibly_damaging(0.637) | TCGA-3C-AALI-01 | Breast | breast invasive carcinoma | Female | <65 | I/II | Unspecific | Poly E | Complete Response | |
| AHCTF1 | SNV | Missense_Mutation | c.1327G>C | p.Glu443Gln | p.E443Q | Q8WYP5 | protein_coding | deleterious(0) | benign(0.253) | TCGA-A2-A0CX-01 | Breast | breast invasive carcinoma | Female | <65 | I/II | Chemotherapy | adriamycin | SD | |
| AHCTF1 | SNV | Missense_Mutation | c.962A>T | p.Lys321Met | p.K321M | Q8WYP5 | protein_coding | deleterious(0) | probably_damaging(0.917) | TCGA-A2-A0T0-01 | Breast | breast invasive carcinoma | Female | <65 | I/II | Chemotherapy | taxotere | SD | |
| AHCTF1 | SNV | Missense_Mutation | novel | c.6223G>C | p.Glu2075Gln | p.E2075Q | Q8WYP5 | protein_coding | deleterious(0.03) | probably_damaging(0.959) | TCGA-AC-A23H-01 | Breast | breast invasive carcinoma | Female | >=65 | I/II | Unknown | Unknown | PD |
| AHCTF1 | SNV | Missense_Mutation | c.3646C>G | p.Leu1216Val | p.L1216V | Q8WYP5 | protein_coding | tolerated(0.13) | benign(0.272) | TCGA-AC-A23H-01 | Breast | breast invasive carcinoma | Female | >=65 | I/II | Unknown | Unknown | PD | |
| AHCTF1 | SNV | Missense_Mutation | novel | c.6104C>T | p.Ala2035Val | p.A2035V | Q8WYP5 | protein_coding | tolerated(0.24) | benign(0.041) | TCGA-AC-A3QQ-01 | Breast | breast invasive carcinoma | Female | <65 | I/II | Unknown | Unknown | SD |
| AHCTF1 | SNV | Missense_Mutation | novel | c.455A>T | p.Gln152Leu | p.Q152L | Q8WYP5 | protein_coding | deleterious(0.01) | possibly_damaging(0.84) | TCGA-AC-A3W5-01 | Breast | breast invasive carcinoma | Female | >=65 | I/II | Chemotherapy | docetaxel | CR |
| AHCTF1 | SNV | Missense_Mutation | novel | c.476G>A | p.Arg159Gln | p.R159Q | Q8WYP5 | protein_coding | deleterious(0.01) | possibly_damaging(0.766) | TCGA-AN-A046-01 | Breast | breast invasive carcinoma | Female | >=65 | I/II | Unknown | Unknown | SD |
| AHCTF1 | SNV | Missense_Mutation | c.1190N>C | p.Asn397Thr | p.N397T | Q8WYP5 | protein_coding | deleterious(0.05) | benign(0.047) | TCGA-AR-A1AL-01 | Breast | breast invasive carcinoma | Female | <65 | III/IV | Hormone Therapy | anastrozole | SD | |
| AHCTF1 | SNV | Missense_Mutation | c.4000C>G | p.Pro1334Ala | p.P1334A | Q8WYP5 | protein_coding | deleterious(0.01) | possibly_damaging(0.602) | TCGA-AR-A24Q-01 | Breast | breast invasive carcinoma | Female | <65 | I/II | Chemotherapy | doxorubicin | SD |
| Page: 1 2 3 4 5 6 7 8 9 10 11 12 13 14 15 16 17 18 19 20 21 22 23 24 25 26 |
Top |
Related drugs of malignant transformation related genes |
| Identification of chemicals and drugs interact with genes involved in malignant transfromation |
| (DGIdb 4.0) |
| Entrez ID | Symbol | Category | Interaction Types | Drug Claim Name | Drug Name | PMIDs |
| Page: 1 |

Copyright 2023-Present -The University of Texas Health Science Center at Houston |