Schematic overview of the cellular and molecular mechanisms involved in the cancer progression, including the proposed cellular and molecular mechanisms in cancer cells trajectory. AT1: alveolar type 1 cells; AT2: alveolar type 2 cells; AAH: atypical adenomatous hyperplasia; AIS: adenocarcinoma in situ; MIA: minimally invasive adenocarcinoma; IA: invasive adenocarcinoma; EMT: epithelial-mesenchymal transition

Home

Download

Statistics

Help

Contact

Center for Computational Systems Medicine
leaf

Gene summary

leaf

Malignant transformation analysis

leaf

Malignant transformation related pathway analysis

leaf

Cell-cell communication analysis

leaf

Single-cell gene regulatory network inference analysis

leaf

Somatic mutation of malignant transformation related genes

leaf

Related drugs of malignant transformation related genes

Gene: AGTRAP

Gene summary for AGTRAP

check button Gene summary.

Gene informationSpeciesHuman
Gene symbol

AGTRAP

Gene ID

57085

Gene nameangiotensin II receptor associated protein
Gene AliasATRAP
Cytomap1p36.22
Gene Typeprotein-coding
GO ID

GO:0001666

UniProtAcc

Q6RW13


Top

Malignant transformation analysis

check button Identification of the aberrant gene expression in precancerous and cancerous lesions by comparing the gene expression of stem-like cells in diseased tissues with normal stem cells
check button Malignant transformation involving gene list.
Entrez IDSymbolReplicatesSpeciesOrganTissueAdj P-valueLog2FCMalignancy
57085AGTRAPLZE2THumanEsophagusESCC1.79e-024.79e-010.082
57085AGTRAPLZE4THumanEsophagusESCC4.72e-154.08e-010.0811
57085AGTRAPLZE5THumanEsophagusESCC4.56e-074.79e-010.0514
57085AGTRAPLZE7THumanEsophagusESCC1.78e-144.38e-010.0667
57085AGTRAPLZE8THumanEsophagusESCC5.39e-032.34e-010.067
57085AGTRAPLZE20THumanEsophagusESCC2.50e-052.78e-010.0662
57085AGTRAPLZE22D1HumanEsophagusHGIN7.63e-052.09e-010.0595
57085AGTRAPLZE22THumanEsophagusESCC7.30e-065.02e-010.068
57085AGTRAPLZE24THumanEsophagusESCC1.66e-331.17e+000.0596
57085AGTRAPLZE22D3HumanEsophagusHGIN1.06e-023.58e-010.0653
57085AGTRAPLZE6THumanEsophagusESCC5.34e-201.06e+000.0845
57085AGTRAPP1T-EHumanEsophagusESCC2.85e-127.06e-010.0875
57085AGTRAPP2T-EHumanEsophagusESCC2.65e-751.48e+000.1177
57085AGTRAPP4T-EHumanEsophagusESCC3.14e-317.29e-010.1323
57085AGTRAPP5T-EHumanEsophagusESCC1.09e-531.18e+000.1327
57085AGTRAPP8T-EHumanEsophagusESCC1.65e-245.22e-010.0889
57085AGTRAPP9T-EHumanEsophagusESCC2.69e-267.51e-010.1131
57085AGTRAPP10T-EHumanEsophagusESCC4.66e-193.31e-010.116
57085AGTRAPP11T-EHumanEsophagusESCC2.05e-341.51e+000.1426
57085AGTRAPP12T-EHumanEsophagusESCC3.01e-204.14e-010.1122
Page: 1 2 3 4 5 6 

check button Transcriptomic changes along malignancy continuum.
TissueExpression DynamicsAbbreviation
EsophagusThe image shows the transcriptomic changes along malignancy continuum.log2FC in expression of this searched gene in stem-like cells from each diseased tissue sample relative to stem-like cells in normal samples in each tissue plotted against the malignancy continuum. Samples are colored based on if they are from different disease stage.
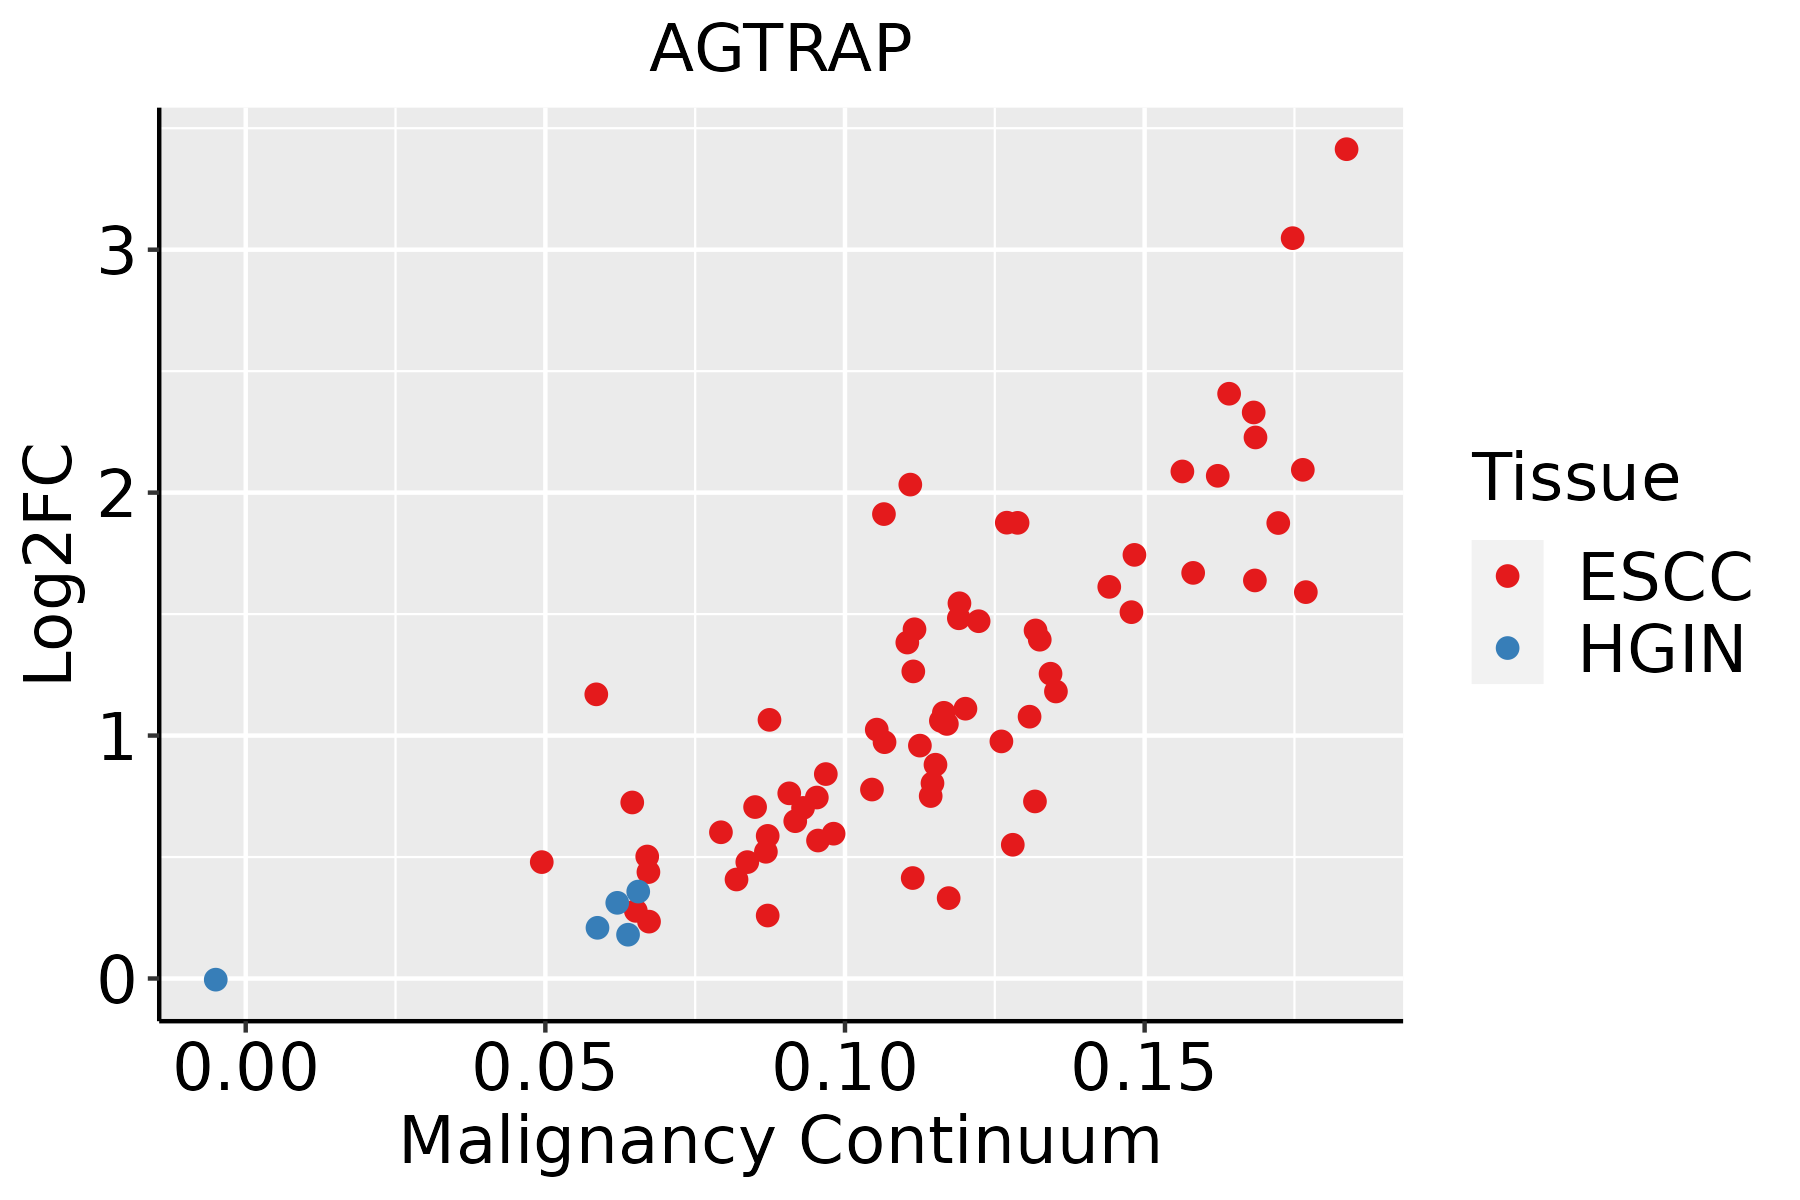
ESCC: Esophageal squamous cell carcinoma
HGIN: High-grade intraepithelial neoplasias
LGIN: Low-grade intraepithelial neoplasias
LiverThe image shows the transcriptomic changes along malignancy continuum.log2FC in expression of this searched gene in stem-like cells from each diseased tissue sample relative to stem-like cells in normal samples in each tissue plotted against the malignancy continuum. Samples are colored based on if they are from different disease stage.
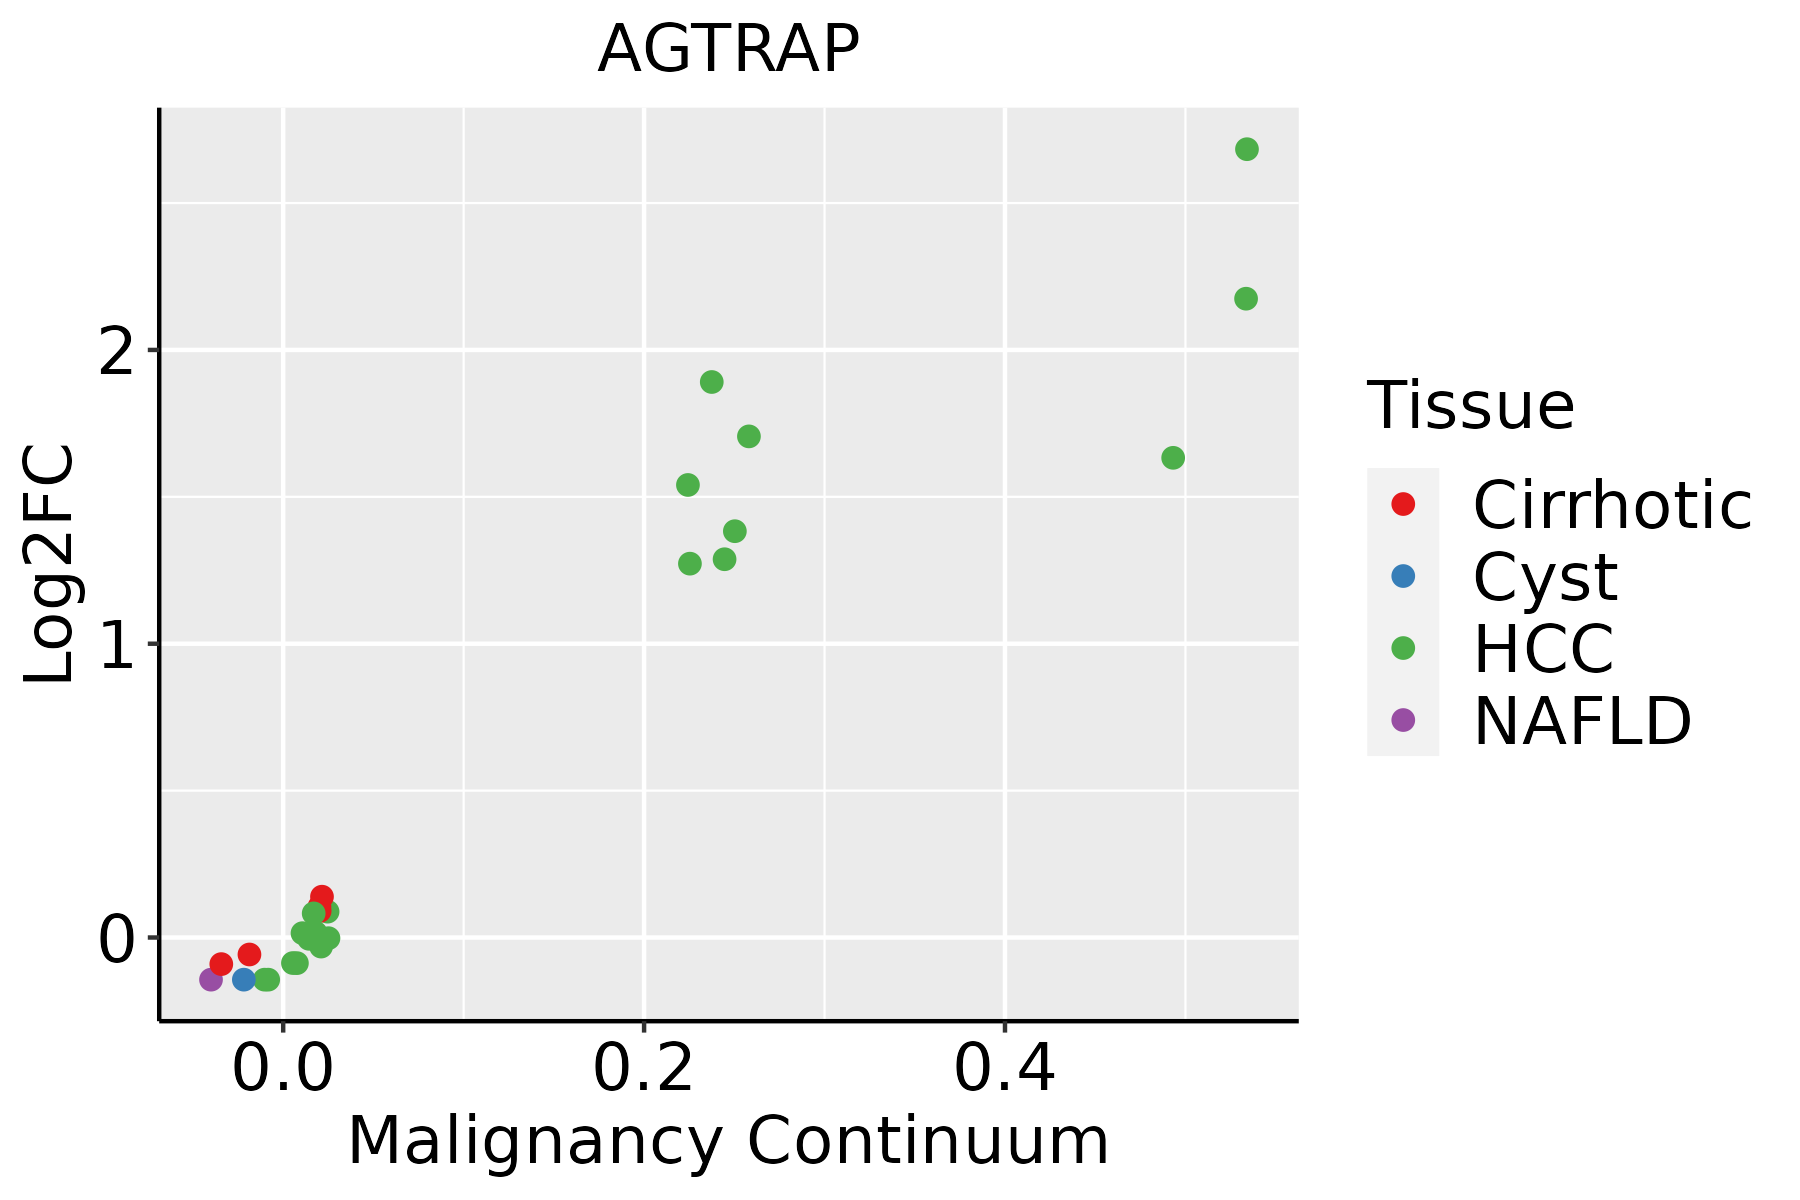
HCC: Hepatocellular carcinoma
NAFLD: Non-alcoholic fatty liver disease
Oral CavityThe image shows the transcriptomic changes along malignancy continuum.log2FC in expression of this searched gene in stem-like cells from each diseased tissue sample relative to stem-like cells in normal samples in each tissue plotted against the malignancy continuum. Samples are colored based on if they are from different disease stage.
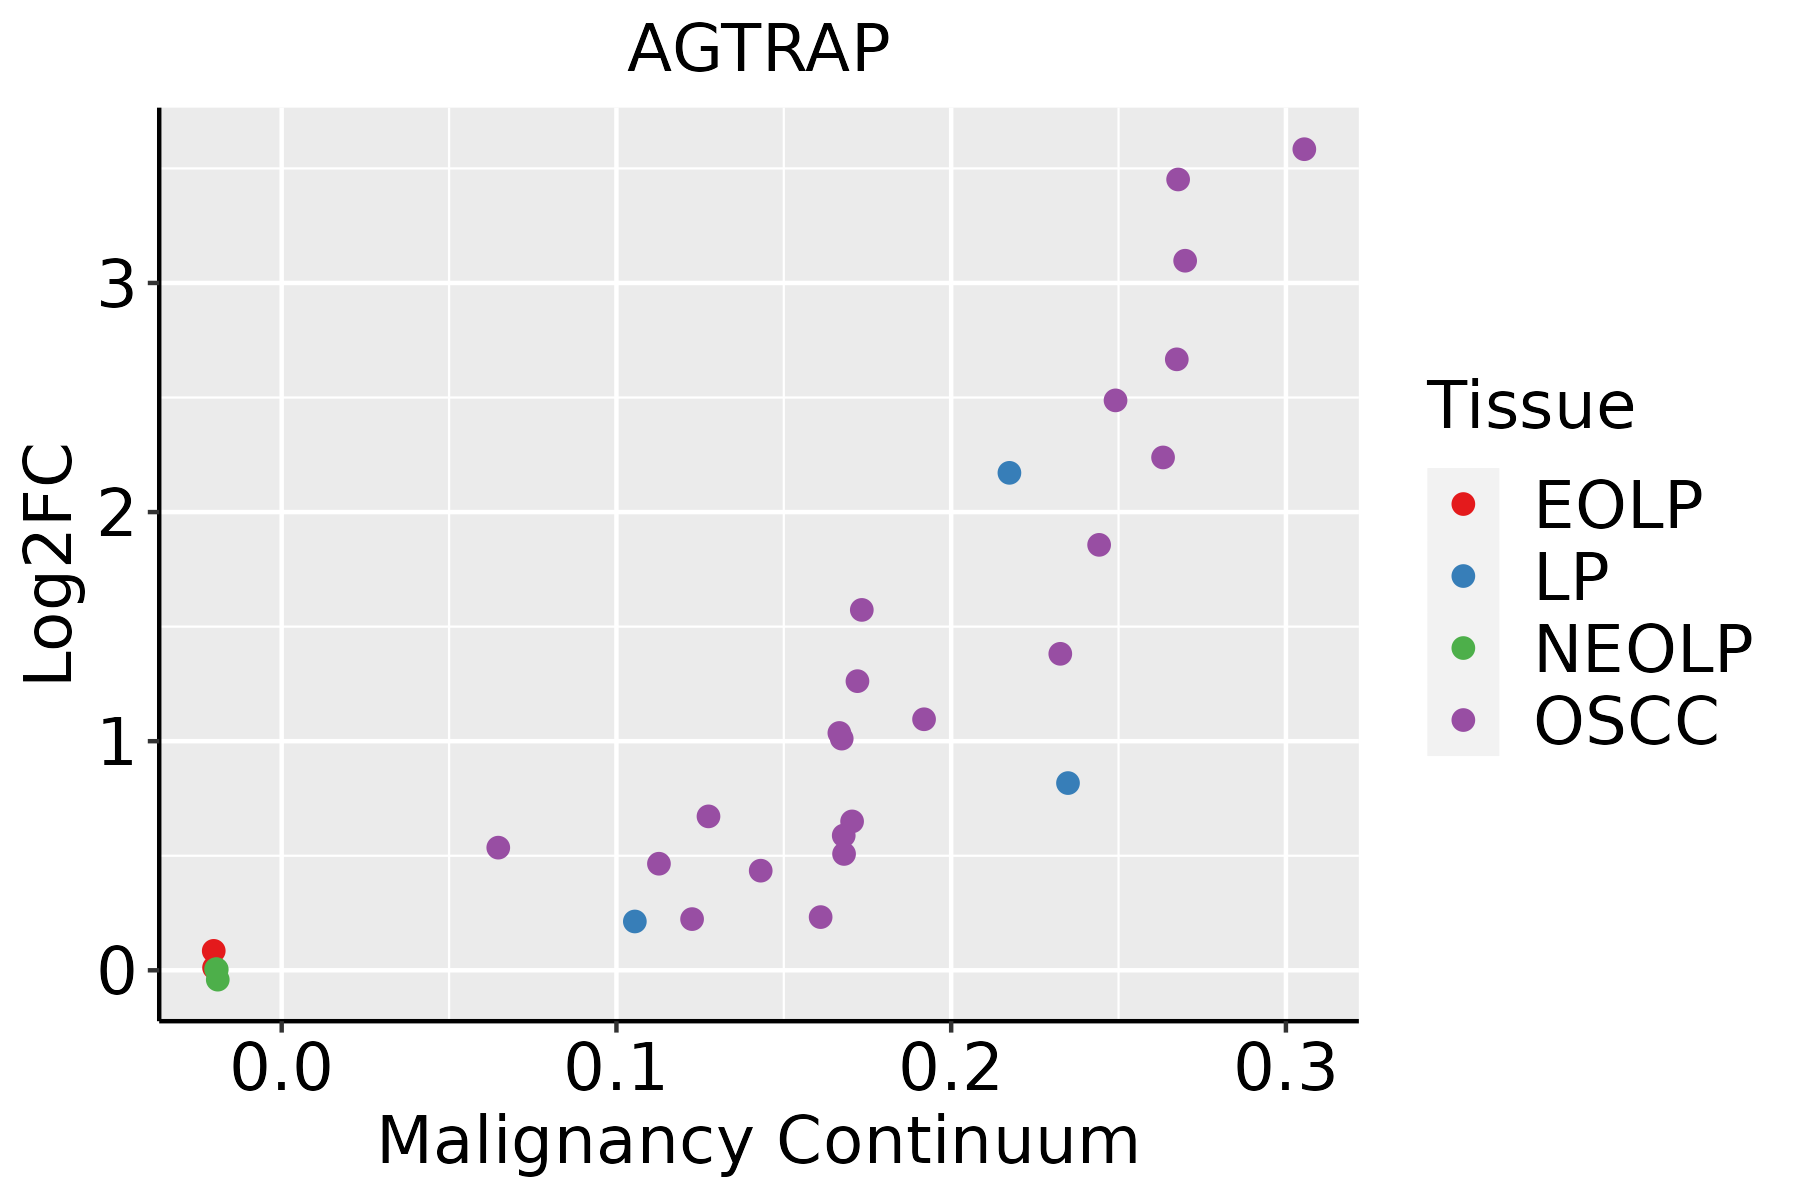
EOLP: Erosive Oral lichen planus
LP: leukoplakia
NEOLP: Non-erosive oral lichen planus
OSCC: Oral squamous cell carcinoma
ProstateThe image shows the transcriptomic changes along malignancy continuum.log2FC in expression of this searched gene in stem-like cells from each diseased tissue sample relative to stem-like cells in normal samples in each tissue plotted against the malignancy continuum. Samples are colored based on if they are from different disease stage.
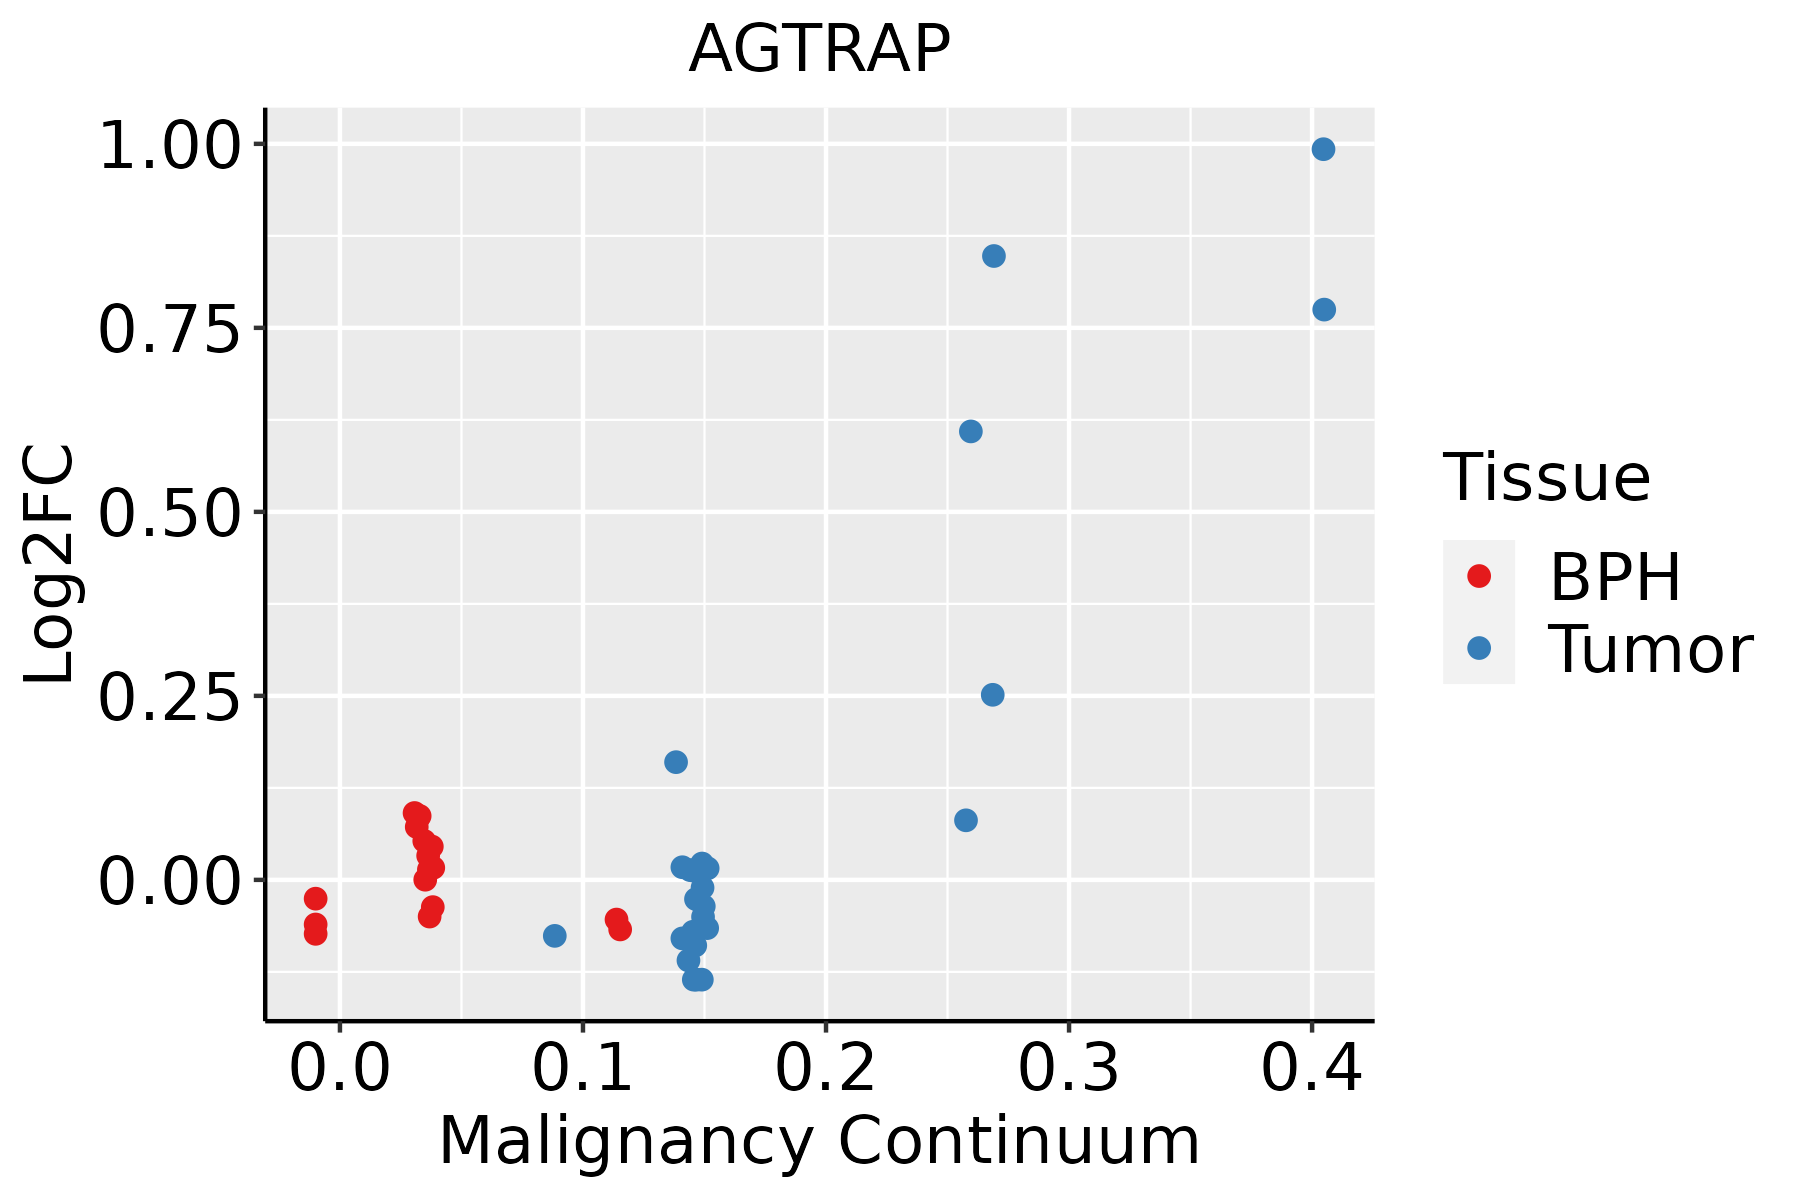
BPH: Benign Prostatic Hyperplasia
SkinThe image shows the transcriptomic changes along malignancy continuum.log2FC in expression of this searched gene in stem-like cells from each diseased tissue sample relative to stem-like cells in normal samples in each tissue plotted against the malignancy continuum. Samples are colored based on if they are from different disease stage.
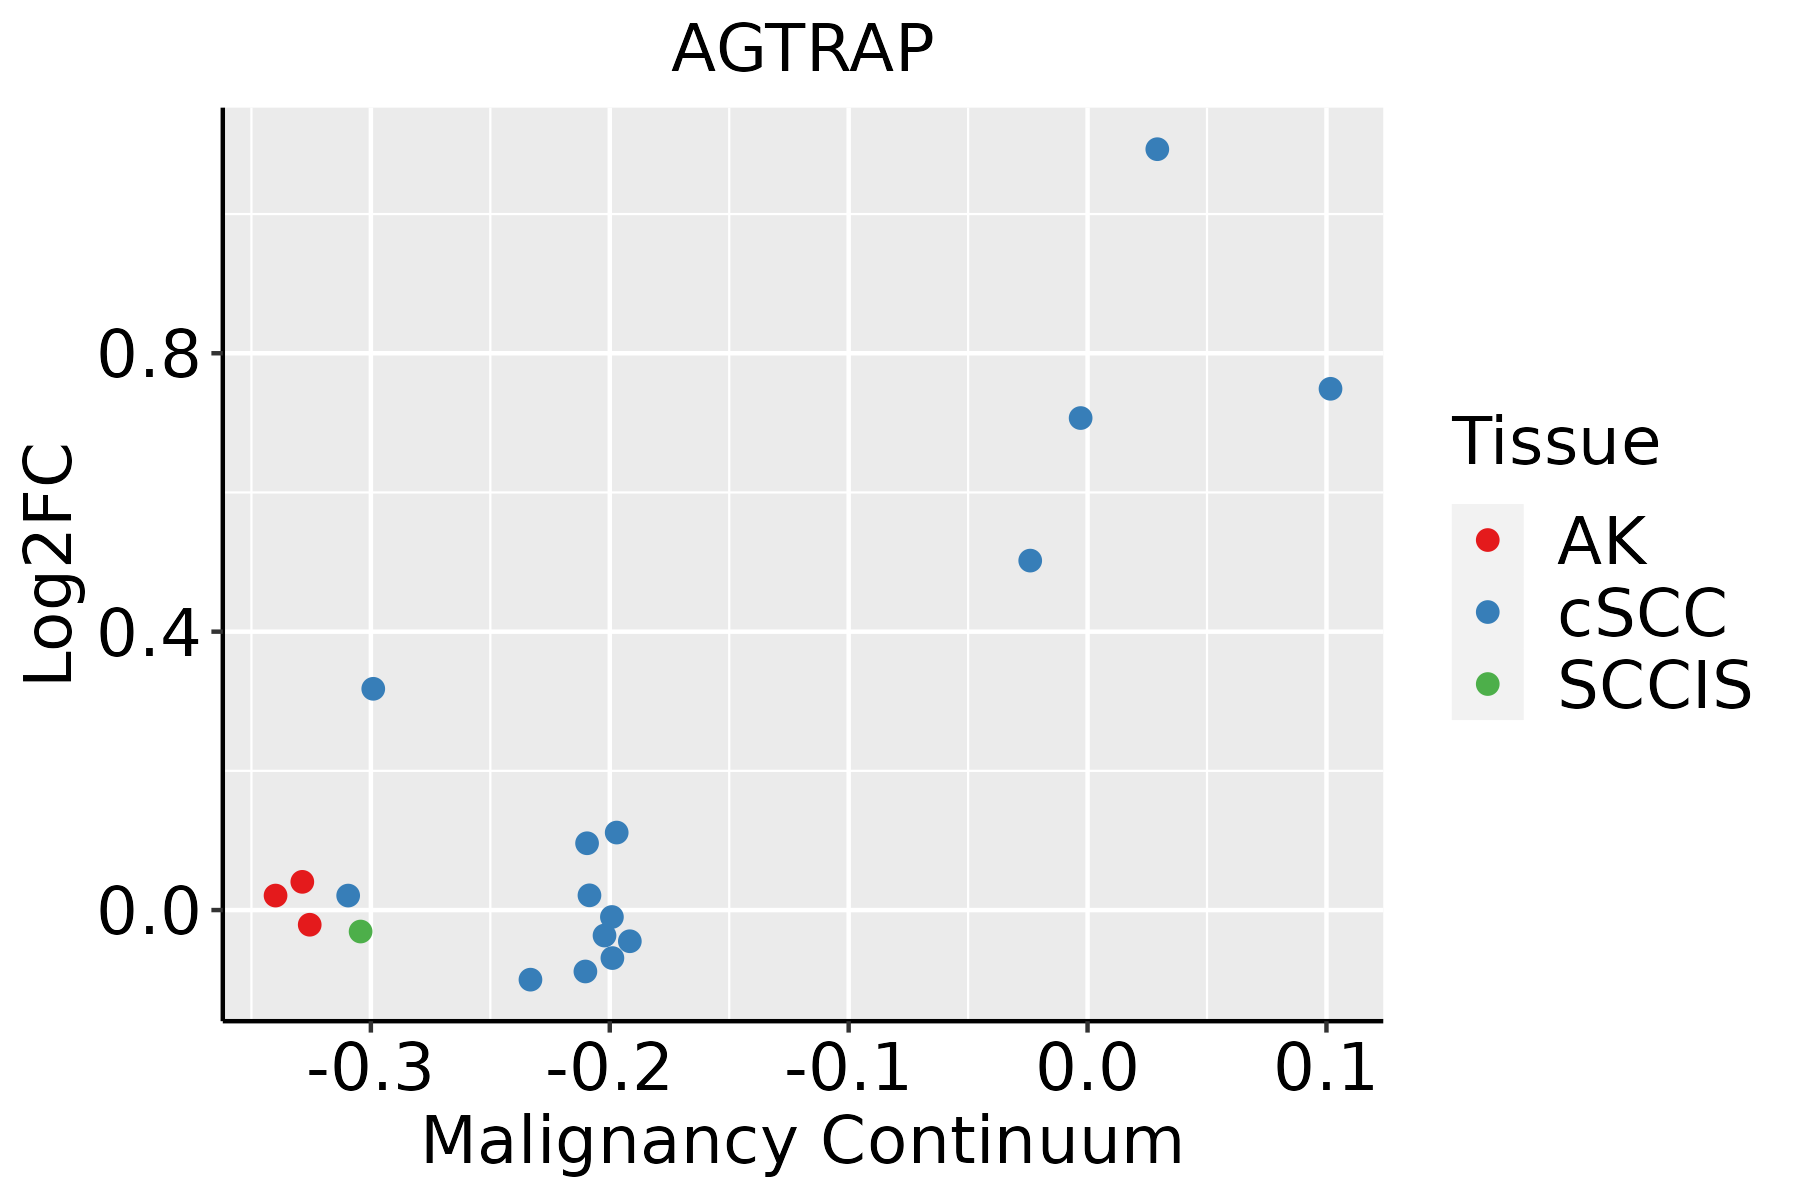
AK: Actinic keratosis
cSCC: Cutaneous squamous cell carcinoma
SCCIS:squamous cell carcinoma in situ
ThyroidThe image shows the transcriptomic changes along malignancy continuum.log2FC in expression of this searched gene in stem-like cells from each diseased tissue sample relative to stem-like cells in normal samples in each tissue plotted against the malignancy continuum. Samples are colored based on if they are from different disease stage.
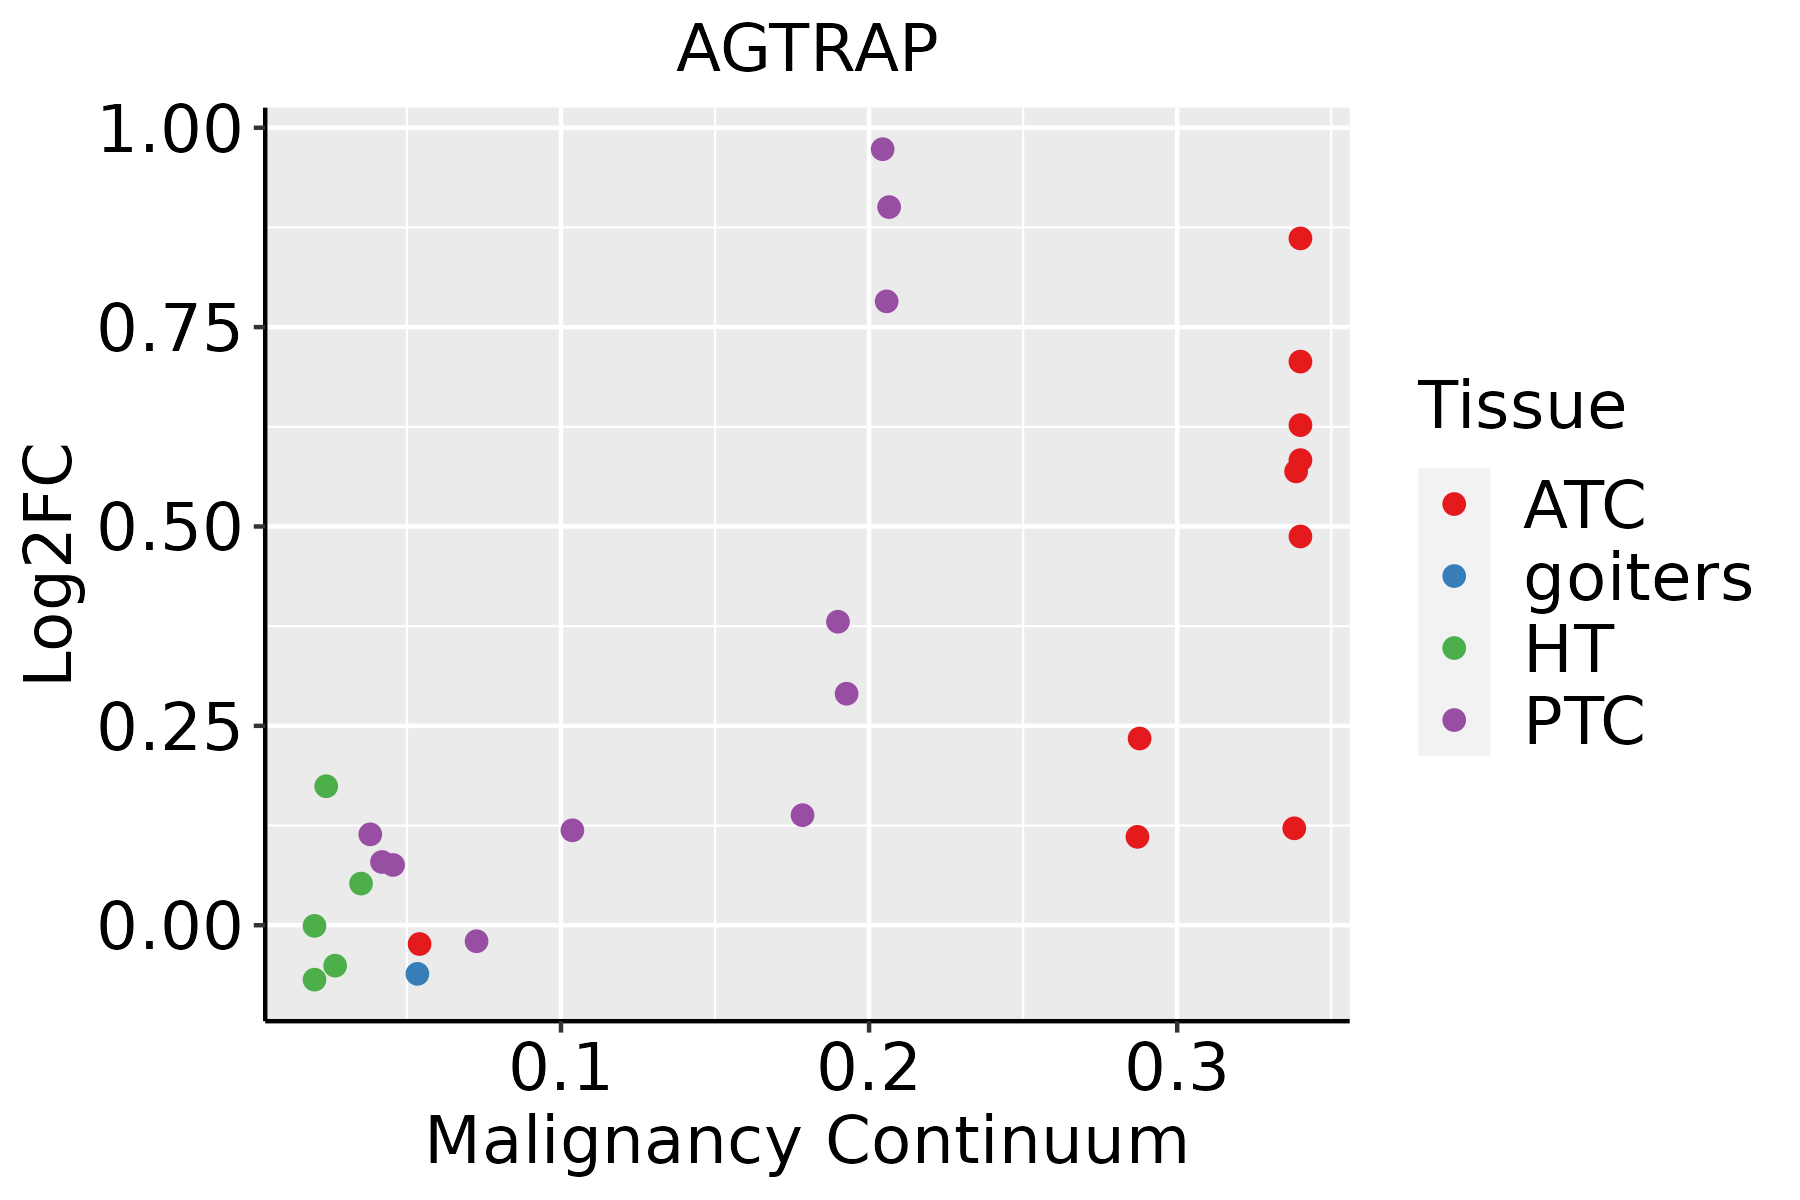
ATC: Anaplastic thyroid cancer
HT: Hashimoto's thyroiditis
PTC: Papillary thyroid cancer
∗log2FC in expression of this searched gene in stem-like cells from each diseased tissue sample relative to stem-like cells in normal samples in each tissue plotted against the malignancy continuum. Samples are colored based on if they are from different disease stage.

Top

Malignant transformation related pathway analysis

check buttonFind out the enriched GO biological processes and KEGG pathways involved in transition from healthy to precancer to cancer
check button Figure of enriched GO biological processes.
TissueDisease StageEnriched GO biological Processes
ColorectumADGO analysis - Figure of enriched GO biological processes: Top 15 enriched GO BP terms are showed in the bar plot of each disease state in each tissue. Each row represents a significant GO biological process which is colored according to the -log10(p.adjust).
ColorectumSERGO analysis - Figure of enriched GO biological processes: Top 15 enriched GO BP terms are showed in the bar plot of each disease state in each tissue. Each row represents a significant GO biological process which is colored according to the -log10(p.adjust).
ColorectumMSSGO analysis - Figure of enriched GO biological processes: Top 15 enriched GO BP terms are showed in the bar plot of each disease state in each tissue. Each row represents a significant GO biological process which is colored according to the -log10(p.adjust).
ColorectumMSI-HGO analysis - Figure of enriched GO biological processes: Top 15 enriched GO BP terms are showed in the bar plot of each disease state in each tissue. Each row represents a significant GO biological process which is colored according to the -log10(p.adjust).
ColorectumFAPGO analysis - Figure of enriched GO biological processes: Top 15 enriched GO BP terms are showed in the bar plot of each disease state in each tissue. Each row represents a significant GO biological process which is colored according to the -log10(p.adjust).
∗Top 15 enriched GO BP terms are showed in the bar plot of each disease state in each tissue. Each row represents a significant GO biological process which is colored according to the -log10(p.adjust).
Page: 1 2 3 4 5 6 7 8 9 

check button Enriched GO biological processes.
GO IDTissueDisease StageDescriptionGene RatioBg Ratiopvaluep.adjustCount
GO:007048220EsophagusHGINresponse to oxygen levels76/2587347/187232.36e-056.25e-0476
GO:003629320EsophagusHGINresponse to decreased oxygen levels70/2587322/187236.23e-051.44e-0370
GO:000166620EsophagusHGINresponse to hypoxia67/2587307/187237.82e-051.75e-0367
GO:004343420EsophagusHGINresponse to peptide hormone79/2587414/187231.60e-031.79e-0279
GO:190165318EsophagusHGINcellular response to peptide68/2587359/187233.88e-033.54e-0268
GO:0070482111EsophagusESCCresponse to oxygen levels218/8552347/187236.91e-112.17e-09218
GO:0036293111EsophagusESCCresponse to decreased oxygen levels201/8552322/187238.37e-102.04e-08201
GO:0001666111EsophagusESCCresponse to hypoxia192/8552307/187231.59e-093.69e-08192
GO:190165319EsophagusESCCcellular response to peptide208/8552359/187231.68e-062.01e-05208
GO:0043434111EsophagusESCCresponse to peptide hormone234/8552414/187234.93e-065.21e-05234
GO:007137516EsophagusESCCcellular response to peptide hormone stimulus166/8552290/187234.48e-053.55e-04166
GO:004343412LiverCirrhoticresponse to peptide hormone149/4634414/187231.70e-074.49e-06149
GO:007137511LiverCirrhoticcellular response to peptide hormone stimulus110/4634290/187233.73e-078.82e-06110
GO:190165311LiverCirrhoticcellular response to peptide129/4634359/187231.23e-062.49e-05129
GO:00704827LiverCirrhoticresponse to oxygen levels125/4634347/187231.55e-063.02e-05125
GO:00362937LiverCirrhoticresponse to decreased oxygen levels113/4634322/187231.87e-052.52e-04113
GO:00016667LiverCirrhoticresponse to hypoxia108/4634307/187232.51e-053.26e-04108
GO:19043851LiverCirrhoticcellular response to angiotensin14/463425/187238.15e-045.95e-0314
GO:19907761LiverCirrhoticresponse to angiotensin15/463428/187239.91e-046.98e-0315
GO:004343422LiverHCCresponse to peptide hormone247/7958414/187239.55e-134.77e-11247
Page: 1 2 3 4 

check button Enriched KEGG pathways.
Pathway IDTissueDisease StageDescriptionGene RatioBg Ratiopvaluep.adjustqvalueCount
Page: 1 

Top

Cell-cell communication analysis

check buttonIdentification of potential cell-cell interactions between two cell types and their ligand-receptor pairs for different disease states
LigandReceptorLRpairPathwayTissueDisease Stage
Page: 1 

Top

Single-cell gene regulatory network inference analysis

check buttonFind out the significant the regulons (TFs) and the target genes of each regulon across cell types for different disease states
TFCell TypeTissueDisease StageTarget GeneRSSRegulon Activity
∗The dot plots of a searched regulon are shown for all cell subpopulations in each disease state of each tissue based on the regulon specific score inferred using pySCENIC and by calculating the average expression.
Page: 1 

Top

Somatic mutation of malignant transformation related genes

check buttonAnnotation of somatic variants for genes involved in malignant transformation
Hugo SymbolVariant ClassVariant ClassificationdbSNP RSHGVScHGVSpHGVSp ShortSWISSPROTBIOTYPESIFTPolyPhenTumor Sample BarcodeTissueHistologySexAgeStageTherapy TypesDrugsOutcome
AGTRAPSNVMissense_Mutationrs146377549c.143N>Ap.Arg48Glnp.R48QQ6RW13protein_codingdeleterious(0.01)possibly_damaging(0.449)TCGA-EA-A410-01Cervixcervical & endocervical cancerFemale<65I/IIUnknownUnknownSD
AGTRAPSNVMissense_Mutationc.415G>Ap.Ala139Thrp.A139TQ6RW13protein_codingtolerated(0.43)benign(0.003)TCGA-DM-A1HB-01Colorectumcolon adenocarcinomaMale>=65III/IVUnknownUnknownSD
AGTRAPSNVMissense_Mutationc.154N>Tp.Asp52Tyrp.D52YQ6RW13protein_codingdeleterious(0)probably_damaging(0.999)TCGA-AX-A0J0-01Endometriumuterine corpus endometrioid carcinomaFemale<65I/IIUnknownUnknownSD
AGTRAPSNVMissense_Mutationrs750218314c.332G>Ap.Arg111Glnp.R111QQ6RW13protein_codingtolerated(0.13)benign(0.072)TCGA-BG-A0MG-01Endometriumuterine corpus endometrioid carcinomaFemale>=65I/IIUnknownUnknownSD
AGTRAPSNVMissense_Mutationnovelc.409N>Cp.Asp137Hisp.D137HQ6RW13protein_codingdeleterious(0)probably_damaging(0.989)TCGA-DF-A2KS-01Endometriumuterine corpus endometrioid carcinomaFemale>=65I/IIUnknownUnknownPD
AGTRAPSNVMissense_Mutationnovelc.280N>Ap.Leu94Ilep.L94IQ6RW13protein_codingdeleterious(0.01)benign(0.37)TCGA-EY-A215-01Endometriumuterine corpus endometrioid carcinomaFemale<65I/IIUnknownUnknownSD
AGTRAPSNVMissense_Mutationnovelc.344N>Tp.Gly115Valp.G115VQ6RW13protein_codingdeleterious(0)probably_damaging(1)TCGA-ZP-A9CZ-01Liverliver hepatocellular carcinomaMale>=65I/IIUnknownUnknownSD
AGTRAPSNVMissense_Mutationnovelc.140N>Tp.Gln47Leup.Q47LQ6RW13protein_codingdeleterious(0)probably_damaging(0.99)TCGA-22-1005-01Lunglung squamous cell carcinomaMale<65I/IIUnknownUnknownSD
AGTRAPSNVMissense_Mutationc.364N>Tp.Gly122Cysp.G122CQ6RW13protein_codingdeleterious(0)probably_damaging(0.999)TCGA-34-5240-01Lunglung squamous cell carcinomaFemale>=65I/IIChemotherapycisplatinCR
AGTRAPSNVMissense_Mutationnovelc.320A>Gp.Tyr107Cysp.Y107CQ6RW13protein_codingdeleterious(0)probably_damaging(0.964)TCGA-F7-A624-01Oral cavityhead & neck squamous cell carcinomaMale>=65I/IIUnknownUnknownSD
Page: 1 2 

Top

Related drugs of malignant transformation related genes

check buttonIdentification of chemicals and drugs interact with genes involved in malignant transfromation
(DGIdb 4.0)
Entrez IDSymbolCategoryInteraction TypesDrug Claim NameDrug NamePMIDs
Page: 1