
|
|||||
|
 | |
| |
| |
| |
| |
| |
|
Gene: AGTR1 |
Gene summary for AGTR1 |
| Gene information | Species | Human | Gene symbol | AGTR1 | Gene ID | 185 |
| Gene name | angiotensin II receptor type 1 | |
| Gene Alias | AG2S | |
| Cytomap | 3q24 | |
| Gene Type | protein-coding | GO ID | GO:0001525 | UniProtAcc | P30556 |
Top |
Malignant transformation analysis |
| Identification of the aberrant gene expression in precancerous and cancerous lesions by comparing the gene expression of stem-like cells in diseased tissues with normal stem cells |
| Entrez ID | Symbol | Replicates | Species | Organ | Tissue | Adj P-value | Log2FC | Malignancy |
| 185 | AGTR1 | NAFLD1 | Human | Liver | NAFLD | 1.17e-07 | 7.31e-01 | -0.04 |
| 185 | AGTR1 | S43 | Human | Liver | Cirrhotic | 4.38e-02 | -1.45e-01 | -0.0187 |
| 185 | AGTR1 | HCC1_Meng | Human | Liver | HCC | 5.76e-70 | 1.30e-01 | 0.0246 |
| 185 | AGTR1 | HCC2_Meng | Human | Liver | HCC | 2.33e-07 | -2.25e-01 | 0.0107 |
| 185 | AGTR1 | cirrhotic1 | Human | Liver | Cirrhotic | 1.54e-02 | -1.90e-01 | 0.0202 |
| 185 | AGTR1 | Pt13.b | Human | Liver | HCC | 1.38e-02 | -8.70e-03 | 0.0251 |
| 185 | AGTR1 | S027 | Human | Liver | HCC | 7.00e-06 | 7.61e-01 | 0.2446 |
| 185 | AGTR1 | S028 | Human | Liver | HCC | 7.30e-10 | 6.29e-01 | 0.2503 |
| 185 | AGTR1 | S029 | Human | Liver | HCC | 1.83e-03 | 5.48e-01 | 0.2581 |
| 185 | AGTR1 | HTA12-25-1 | Human | Pancreas | PDAC | 3.64e-05 | 4.65e-01 | 0.313 |
| 185 | AGTR1 | HTA12-26-1 | Human | Pancreas | PDAC | 1.03e-14 | 6.63e-01 | 0.3728 |
| 185 | AGTR1 | HTA12-29-1 | Human | Pancreas | PDAC | 6.39e-34 | 7.97e-01 | 0.3722 |
| Page: 1 |
| Tissue | Expression Dynamics | Abbreviation |
| Liver | 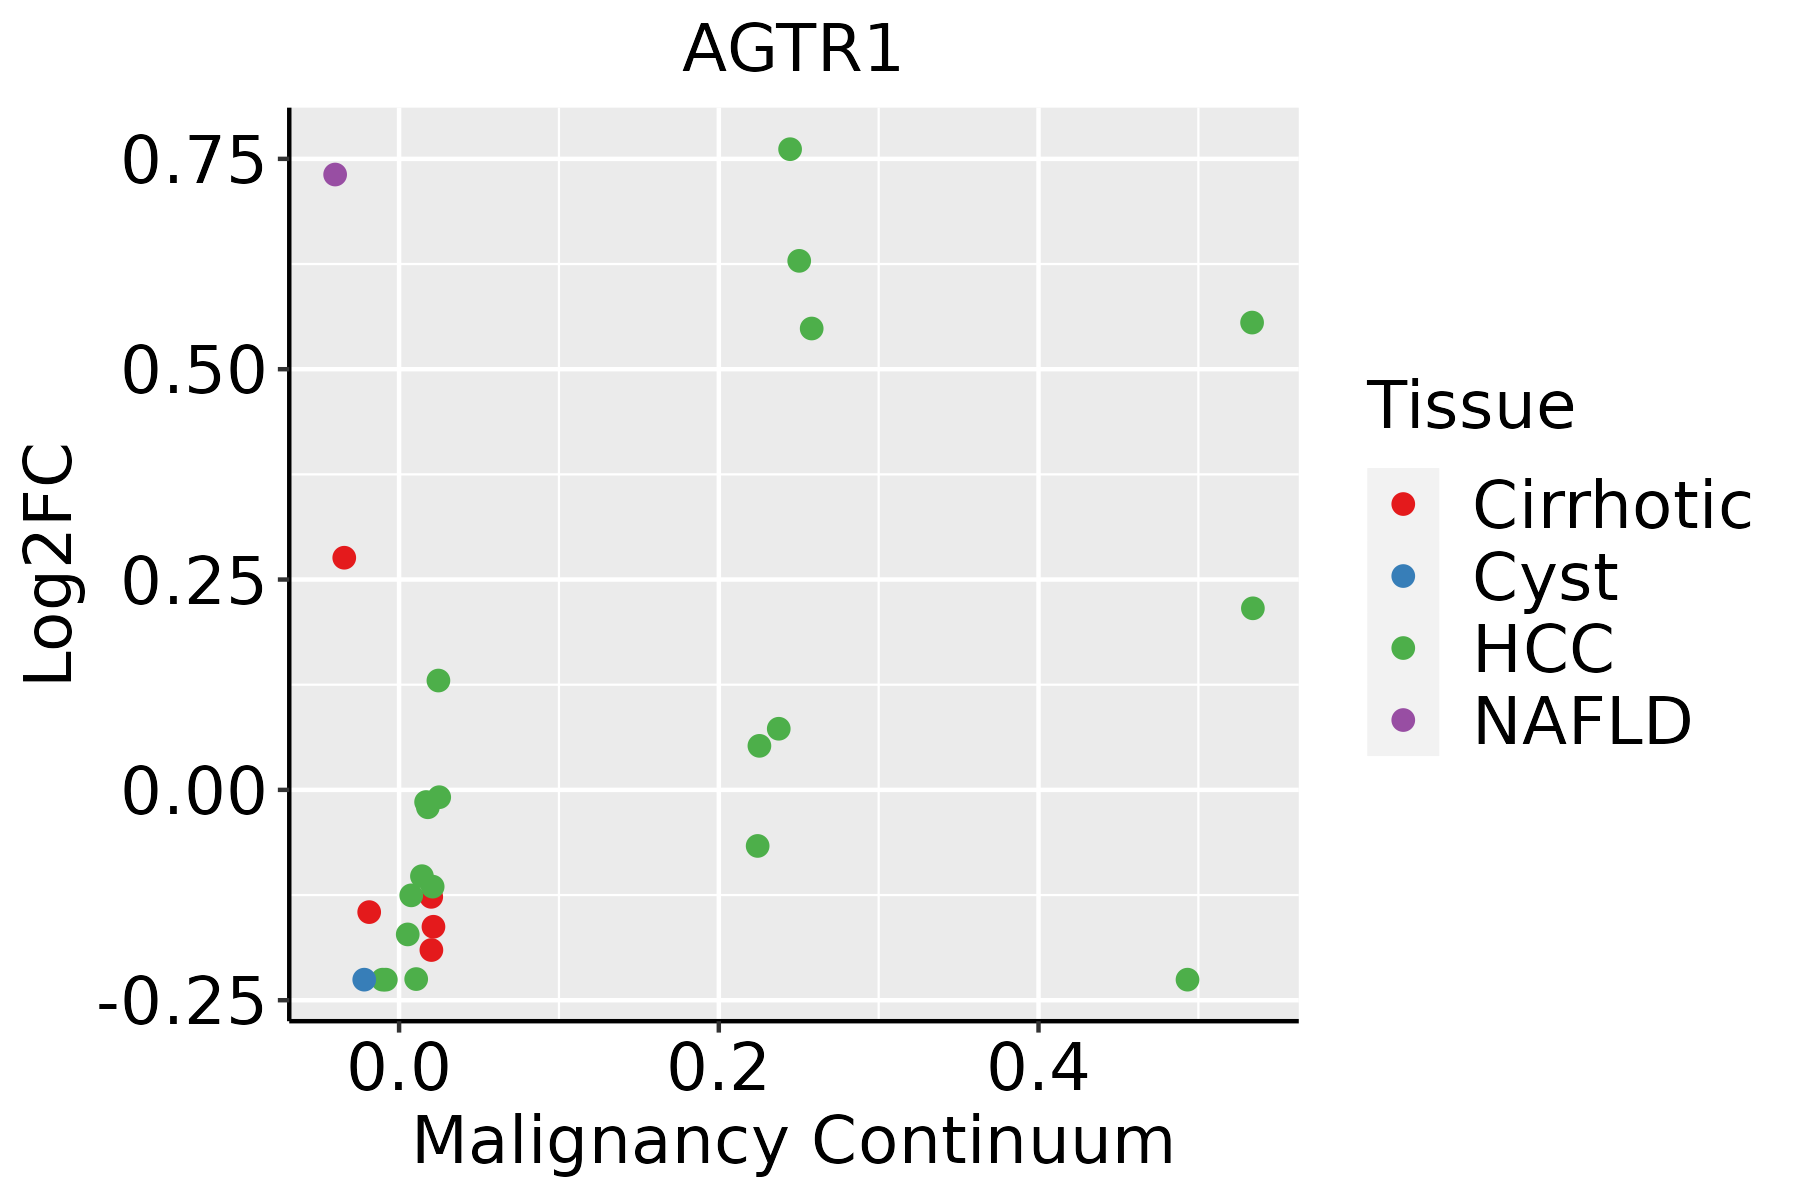 | HCC: Hepatocellular carcinoma |
| NAFLD: Non-alcoholic fatty liver disease |
| ∗log2FC in expression of this searched gene in stem-like cells from each diseased tissue sample relative to stem-like cells in normal samples in each tissue plotted against the malignancy continuum. Samples are colored based on if they are from different disease stage. |
Top |
Malignant transformation related pathway analysis |
| Find out the enriched GO biological processes and KEGG pathways involved in transition from healthy to precancer to cancer |
| Tissue | Disease Stage | Enriched GO biological Processes |
| Colorectum | AD |  |
| Colorectum | SER |  |
| Colorectum | MSS |  |
| Colorectum | MSI-H |  |
| Colorectum | FAP |  |
| ∗Top 15 enriched GO BP terms are showed in the bar plot of each disease state in each tissue. Each row represents a significant GO biological process which is colored according to the -log10(p.adjust). |
| Page: 1 2 3 4 5 6 7 8 9 |
| GO ID | Tissue | Disease Stage | Description | Gene Ratio | Bg Ratio | pvalue | p.adjust | Count |
| GO:00713755 | Liver | NAFLD | cellular response to peptide hormone stimulus | 65/1882 | 290/18723 | 3.95e-10 | 9.62e-08 | 65 |
| GO:00082023 | Liver | NAFLD | steroid metabolic process | 69/1882 | 319/18723 | 5.90e-10 | 1.28e-07 | 69 |
| GO:00160327 | Liver | NAFLD | viral process | 80/1882 | 415/18723 | 7.71e-09 | 1.07e-06 | 80 |
| GO:19016536 | Liver | NAFLD | cellular response to peptide | 71/1882 | 359/18723 | 1.82e-08 | 2.09e-06 | 71 |
| GO:00302585 | Liver | NAFLD | lipid modification | 49/1882 | 212/18723 | 1.97e-08 | 2.17e-06 | 49 |
| GO:00072654 | Liver | NAFLD | Ras protein signal transduction | 66/1882 | 337/18723 | 8.43e-08 | 7.09e-06 | 66 |
| GO:00434346 | Liver | NAFLD | response to peptide hormone | 76/1882 | 414/18723 | 1.51e-07 | 1.09e-05 | 76 |
| GO:00160495 | Liver | NAFLD | cell growth | 85/1882 | 482/18723 | 1.75e-07 | 1.25e-05 | 85 |
| GO:00108765 | Liver | NAFLD | lipid localization | 79/1882 | 448/18723 | 4.75e-07 | 2.92e-05 | 79 |
| GO:00068694 | Liver | NAFLD | lipid transport | 71/1882 | 398/18723 | 1.16e-06 | 5.59e-05 | 71 |
| GO:00192163 | Liver | NAFLD | regulation of lipid metabolic process | 61/1882 | 331/18723 | 2.18e-06 | 9.24e-05 | 61 |
| GO:00718252 | Liver | NAFLD | protein-lipid complex subunit organization | 17/1882 | 50/18723 | 3.92e-06 | 1.54e-04 | 17 |
| GO:00718272 | Liver | NAFLD | plasma lipoprotein particle organization | 16/1882 | 46/18723 | 5.37e-06 | 1.95e-04 | 16 |
| GO:00190587 | Liver | NAFLD | viral life cycle | 57/1882 | 317/18723 | 1.00e-05 | 3.18e-04 | 57 |
| GO:00072664 | Liver | NAFLD | Rho protein signal transduction | 31/1882 | 137/18723 | 1.19e-05 | 3.67e-04 | 31 |
| GO:00343682 | Liver | NAFLD | protein-lipid complex remodeling | 12/1882 | 30/18723 | 1.58e-05 | 4.56e-04 | 12 |
| GO:00343692 | Liver | NAFLD | plasma lipoprotein particle remodeling | 12/1882 | 30/18723 | 1.58e-05 | 4.56e-04 | 12 |
| GO:00343672 | Liver | NAFLD | protein-containing complex remodeling | 12/1882 | 32/18723 | 3.40e-05 | 8.80e-04 | 12 |
| GO:0015850 | Liver | NAFLD | organic hydroxy compound transport | 50/1882 | 284/18723 | 6.01e-05 | 1.32e-03 | 50 |
| GO:00444037 | Liver | NAFLD | biological process involved in symbiotic interaction | 50/1882 | 290/18723 | 1.03e-04 | 2.04e-03 | 50 |
| Page: 1 2 3 4 5 6 |
| Pathway ID | Tissue | Disease Stage | Description | Gene Ratio | Bg Ratio | pvalue | p.adjust | qvalue | Count |
| hsa0517114 | Liver | NAFLD | Coronavirus disease - COVID-19 | 111/1043 | 232/8465 | 1.01e-41 | 3.32e-39 | 2.67e-39 | 111 |
| hsa0517115 | Liver | NAFLD | Coronavirus disease - COVID-19 | 111/1043 | 232/8465 | 1.01e-41 | 3.32e-39 | 2.67e-39 | 111 |
| hsa0517122 | Liver | Cirrhotic | Coronavirus disease - COVID-19 | 136/2530 | 232/8465 | 3.28e-20 | 1.82e-18 | 1.12e-18 | 136 |
| hsa0541514 | Liver | Cirrhotic | Diabetic cardiomyopathy | 108/2530 | 203/8465 | 1.99e-12 | 4.41e-11 | 2.72e-11 | 108 |
| hsa0517132 | Liver | Cirrhotic | Coronavirus disease - COVID-19 | 136/2530 | 232/8465 | 3.28e-20 | 1.82e-18 | 1.12e-18 | 136 |
| hsa0541515 | Liver | Cirrhotic | Diabetic cardiomyopathy | 108/2530 | 203/8465 | 1.99e-12 | 4.41e-11 | 2.72e-11 | 108 |
| hsa0541522 | Liver | HCC | Diabetic cardiomyopathy | 151/4020 | 203/8465 | 2.72e-15 | 1.01e-13 | 5.63e-14 | 151 |
| hsa0517142 | Liver | HCC | Coronavirus disease - COVID-19 | 167/4020 | 232/8465 | 1.50e-14 | 4.19e-13 | 2.33e-13 | 167 |
| hsa049334 | Liver | HCC | AGE-RAGE signaling pathway in diabetic complications | 62/4020 | 100/8465 | 2.35e-03 | 7.95e-03 | 4.42e-03 | 62 |
| hsa0541532 | Liver | HCC | Diabetic cardiomyopathy | 151/4020 | 203/8465 | 2.72e-15 | 1.01e-13 | 5.63e-14 | 151 |
| hsa0517152 | Liver | HCC | Coronavirus disease - COVID-19 | 167/4020 | 232/8465 | 1.50e-14 | 4.19e-13 | 2.33e-13 | 167 |
| hsa0493311 | Liver | HCC | AGE-RAGE signaling pathway in diabetic complications | 62/4020 | 100/8465 | 2.35e-03 | 7.95e-03 | 4.42e-03 | 62 |
| Page: 1 |
Top |
Cell-cell communication analysis |
| Identification of potential cell-cell interactions between two cell types and their ligand-receptor pairs for different disease states |
| Ligand | Receptor | LRpair | Pathway | Tissue | Disease Stage |
| AGT | AGTR1 | AGT_AGTR1B | AGT | Esophagus | ESCC |
| AGT | AGTR1 | AGT_AGTR1B | AGT | HNSCC | ADJ |
| AGT | AGTR1 | AGT_AGTR1B | AGT | Liver | Healthy |
| AGT | AGTR1 | AGT_AGTR1B | AGT | Liver | Precancer |
| AGT | AGTR1 | AGT_AGTR1B | AGT | THCA | Precancer |
| Page: 1 |
Top |
Single-cell gene regulatory network inference analysis |
| Find out the significant the regulons (TFs) and the target genes of each regulon across cell types for different disease states |
| TF | Cell Type | Tissue | Disease Stage | Target Gene | RSS | Regulon Activity |
| ∗The dot plots of a searched regulon are shown for all cell subpopulations in each disease state of each tissue based on the regulon specific score inferred using pySCENIC and by calculating the average expression. |
| Page: 1 |
Top |
Somatic mutation of malignant transformation related genes |
| Annotation of somatic variants for genes involved in malignant transformation |
| Hugo Symbol | Variant Class | Variant Classification | dbSNP RS | HGVSc | HGVSp | HGVSp Short | SWISSPROT | BIOTYPE | SIFT | PolyPhen | Tumor Sample Barcode | Tissue | Histology | Sex | Age | Stage | Therapy Types | Drugs | Outcome |
| AGTR1 | SNV | Missense_Mutation | c.855N>G | p.Phe285Leu | p.F285L | protein_coding | tolerated(0.58) | benign(0.401) | TCGA-AC-A23H-01 | Breast | breast invasive carcinoma | Female | >=65 | I/II | Unknown | Unknown | PD | ||
| AGTR1 | SNV | Missense_Mutation | rs762020328 | c.482N>A | p.Arg161Gln | p.R161Q | protein_coding | deleterious(0) | probably_damaging(1) | TCGA-AN-A046-01 | Breast | breast invasive carcinoma | Female | >=65 | I/II | Unknown | Unknown | SD | |
| AGTR1 | SNV | Missense_Mutation | rs200184769 | c.605N>A | p.Arg202Gln | p.R202Q | protein_coding | deleterious(0) | probably_damaging(0.998) | TCGA-AN-A046-01 | Breast | breast invasive carcinoma | Female | >=65 | I/II | Unknown | Unknown | SD | |
| AGTR1 | SNV | Missense_Mutation | rs770227887 | c.485N>G | p.Tyr162Cys | p.Y162C | protein_coding | deleterious(0.02) | probably_damaging(1) | TCGA-D8-A1XQ-01 | Breast | breast invasive carcinoma | Female | >=65 | I/II | Unknown | Unknown | SD | |
| AGTR1 | SNV | Missense_Mutation | novel | c.1021N>T | p.Gly341Trp | p.G341W | protein_coding | deleterious(0) | probably_damaging(0.999) | TCGA-GI-A2C9-01 | Breast | breast invasive carcinoma | Female | <65 | I/II | Unspecific | SD | ||
| AGTR1 | SNV | Missense_Mutation | novel | c.61N>T | p.Val21Leu | p.V21L | protein_coding | unknown(0) | TCGA-PL-A8LZ-01 | Breast | breast invasive carcinoma | Female | <65 | III/IV | Chemotherapy | paclitaxel | SD | ||
| AGTR1 | insertion | Frame_Shift_Ins | novel | c.253_254insTCATTTACTTTTATATGAAGCTGAAGACAGCT | p.Val87TyrfsTer10 | p.V87Yfs*10 | protein_coding | TCGA-AO-A0J4-01 | Breast | breast invasive carcinoma | Female | <65 | I/II | Chemotherapy | doxorubicin | SD | |||
| AGTR1 | SNV | Missense_Mutation | c.143N>T | p.Arg48Ile | p.R48I | protein_coding | tolerated(0.09) | benign(0.05) | TCGA-FU-A3HZ-01 | Cervix | cervical & endocervical cancer | Female | <65 | I/II | Chemotherapy | cisplatin | CR | ||
| AGTR1 | SNV | Missense_Mutation | novel | c.414N>G | p.Ile138Met | p.I138M | protein_coding | tolerated(0.11) | benign(0.403) | TCGA-MA-AA41-01 | Cervix | cervical & endocervical cancer | Female | <65 | I/II | Unknown | Unknown | SD | |
| AGTR1 | SNV | Missense_Mutation | novel | c.947N>G | p.Asp316Gly | p.D316G | protein_coding | deleterious(0.04) | probably_damaging(0.992) | TCGA-VS-A957-01 | Cervix | cervical & endocervical cancer | Female | <65 | I/II | Chemotherapy | cisplatin | CR |
| Page: 1 2 3 4 5 6 7 8 9 |
Top |
Related drugs of malignant transformation related genes |
| Identification of chemicals and drugs interact with genes involved in malignant transfromation |
| (DGIdb 4.0) |
| Entrez ID | Symbol | Category | Interaction Types | Drug Claim Name | Drug Name | PMIDs |
| 185 | AGTR1 | DRUGGABLE GENOME, G PROTEIN COUPLED RECEPTOR | TASOSARTAN | TASOSARTAN | ||
| 185 | AGTR1 | DRUGGABLE GENOME, G PROTEIN COUPLED RECEPTOR | antagonist | 178103498 | ||
| 185 | AGTR1 | DRUGGABLE GENOME, G PROTEIN COUPLED RECEPTOR | atorvastatin | ATORVASTATIN | ||
| 185 | AGTR1 | DRUGGABLE GENOME, G PROTEIN COUPLED RECEPTOR | CSA | CYCLOSPORINE | 17477024 | |
| 185 | AGTR1 | DRUGGABLE GENOME, G PROTEIN COUPLED RECEPTOR | Losartan | LOSARTAN | ||
| 185 | AGTR1 | DRUGGABLE GENOME, G PROTEIN COUPLED RECEPTOR | DEXAMETHASONE | DEXAMETHASONE | 16482568 | |
| 185 | AGTR1 | DRUGGABLE GENOME, G PROTEIN COUPLED RECEPTOR | antagonist | CHEMBL2103795 | AZILSARTAN KAMEDOXOMIL | |
| 185 | AGTR1 | DRUGGABLE GENOME, G PROTEIN COUPLED RECEPTOR | antagonist | 178103487 | ||
| 185 | AGTR1 | DRUGGABLE GENOME, G PROTEIN COUPLED RECEPTOR | antagonist | 178103483 | AZILSARTAN | |
| 185 | AGTR1 | DRUGGABLE GENOME, G PROTEIN COUPLED RECEPTOR | ANTISENSE C-FOS | 12215476 |
| Page: 1 2 3 4 5 6 7 8 9 10 11 12 13 |

Copyright 2023-Present -The University of Texas Health Science Center at Houston |