
|
|||||
|
 | |
| |
| |
| |
| |
| |
|
Gene: AGRN |
Gene summary for AGRN |
| Gene information | Species | Human | Gene symbol | AGRN | Gene ID | 375790 |
| Gene name | agrin | |
| Gene Alias | AGRIN | |
| Cytomap | 1p36.33 | |
| Gene Type | protein-coding | GO ID | GO:0006139 | UniProtAcc | O00468 |
Top |
Malignant transformation analysis |
| Identification of the aberrant gene expression in precancerous and cancerous lesions by comparing the gene expression of stem-like cells in diseased tissues with normal stem cells |
| Entrez ID | Symbol | Replicates | Species | Organ | Tissue | Adj P-value | Log2FC | Malignancy |
| 375790 | AGRN | LZE2T | Human | Esophagus | ESCC | 1.09e-10 | 6.56e-01 | 0.082 |
| 375790 | AGRN | LZE4T | Human | Esophagus | ESCC | 2.10e-05 | 1.93e-01 | 0.0811 |
| 375790 | AGRN | LZE5T | Human | Esophagus | ESCC | 4.28e-02 | 3.76e-01 | 0.0514 |
| 375790 | AGRN | LZE7T | Human | Esophagus | ESCC | 8.79e-05 | 4.67e-01 | 0.0667 |
| 375790 | AGRN | LZE8T | Human | Esophagus | ESCC | 8.54e-15 | 4.95e-01 | 0.067 |
| 375790 | AGRN | LZE20T | Human | Esophagus | ESCC | 5.09e-09 | 5.04e-01 | 0.0662 |
| 375790 | AGRN | LZE21D1 | Human | Esophagus | HGIN | 2.10e-03 | 5.60e-01 | 0.0632 |
| 375790 | AGRN | LZE22T | Human | Esophagus | ESCC | 1.33e-08 | 4.76e-01 | 0.068 |
| 375790 | AGRN | LZE24T | Human | Esophagus | ESCC | 2.89e-21 | 6.15e-01 | 0.0596 |
| 375790 | AGRN | LZE21T | Human | Esophagus | ESCC | 2.09e-03 | 4.31e-01 | 0.0655 |
| 375790 | AGRN | P1T-E | Human | Esophagus | ESCC | 2.66e-20 | 1.03e+00 | 0.0875 |
| 375790 | AGRN | P2T-E | Human | Esophagus | ESCC | 6.06e-36 | 5.45e-01 | 0.1177 |
| 375790 | AGRN | P4T-E | Human | Esophagus | ESCC | 2.20e-22 | 4.69e-01 | 0.1323 |
| 375790 | AGRN | P5T-E | Human | Esophagus | ESCC | 5.00e-15 | 2.01e-01 | 0.1327 |
| 375790 | AGRN | P8T-E | Human | Esophagus | ESCC | 8.75e-93 | 1.67e+00 | 0.0889 |
| 375790 | AGRN | P9T-E | Human | Esophagus | ESCC | 1.18e-17 | 3.97e-01 | 0.1131 |
| 375790 | AGRN | P10T-E | Human | Esophagus | ESCC | 3.31e-40 | 7.28e-01 | 0.116 |
| 375790 | AGRN | P11T-E | Human | Esophagus | ESCC | 4.07e-23 | 1.27e+00 | 0.1426 |
| 375790 | AGRN | P12T-E | Human | Esophagus | ESCC | 1.77e-20 | 3.74e-01 | 0.1122 |
| 375790 | AGRN | P15T-E | Human | Esophagus | ESCC | 3.48e-43 | 9.87e-01 | 0.1149 |
| Page: 1 2 3 4 5 6 7 |
| Tissue | Expression Dynamics | Abbreviation |
| Esophagus | 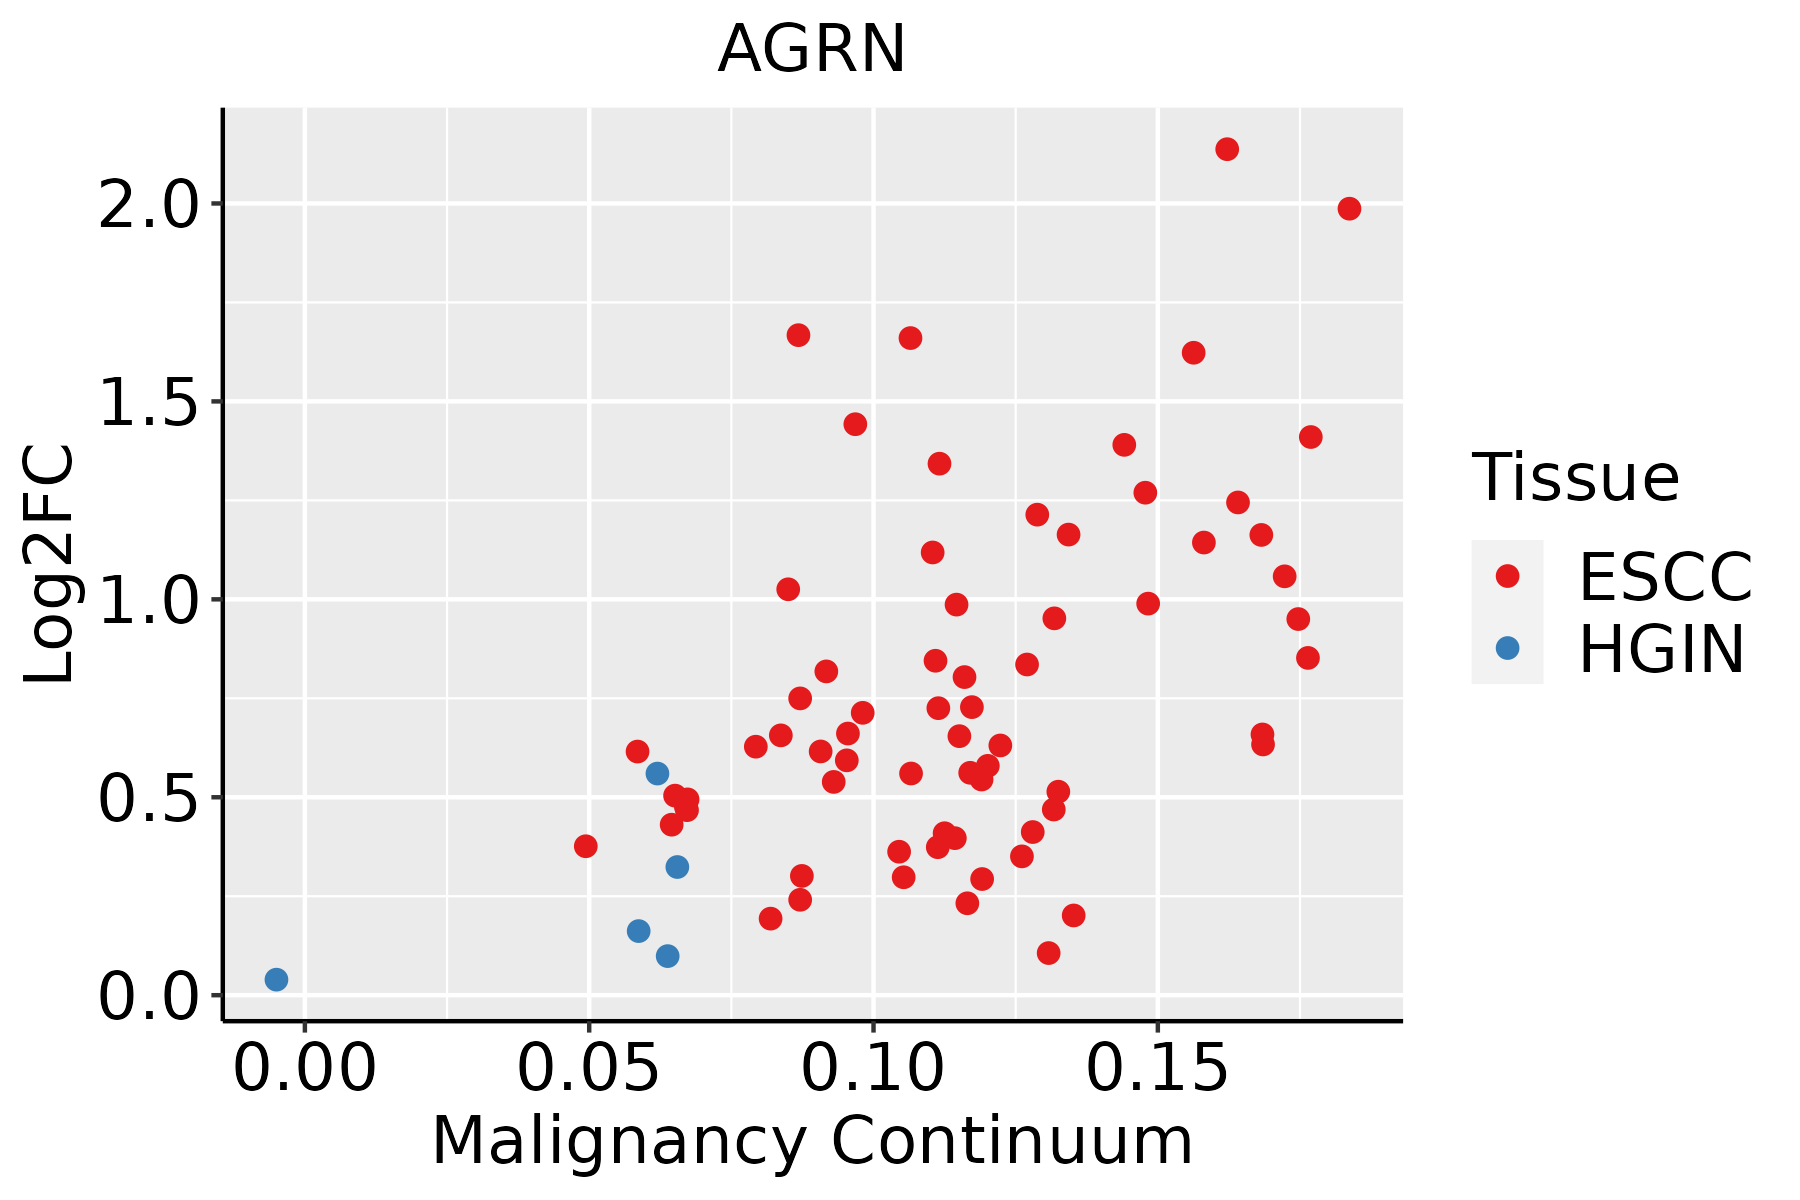 | ESCC: Esophageal squamous cell carcinoma |
| HGIN: High-grade intraepithelial neoplasias | ||
| LGIN: Low-grade intraepithelial neoplasias | ||
| Liver | 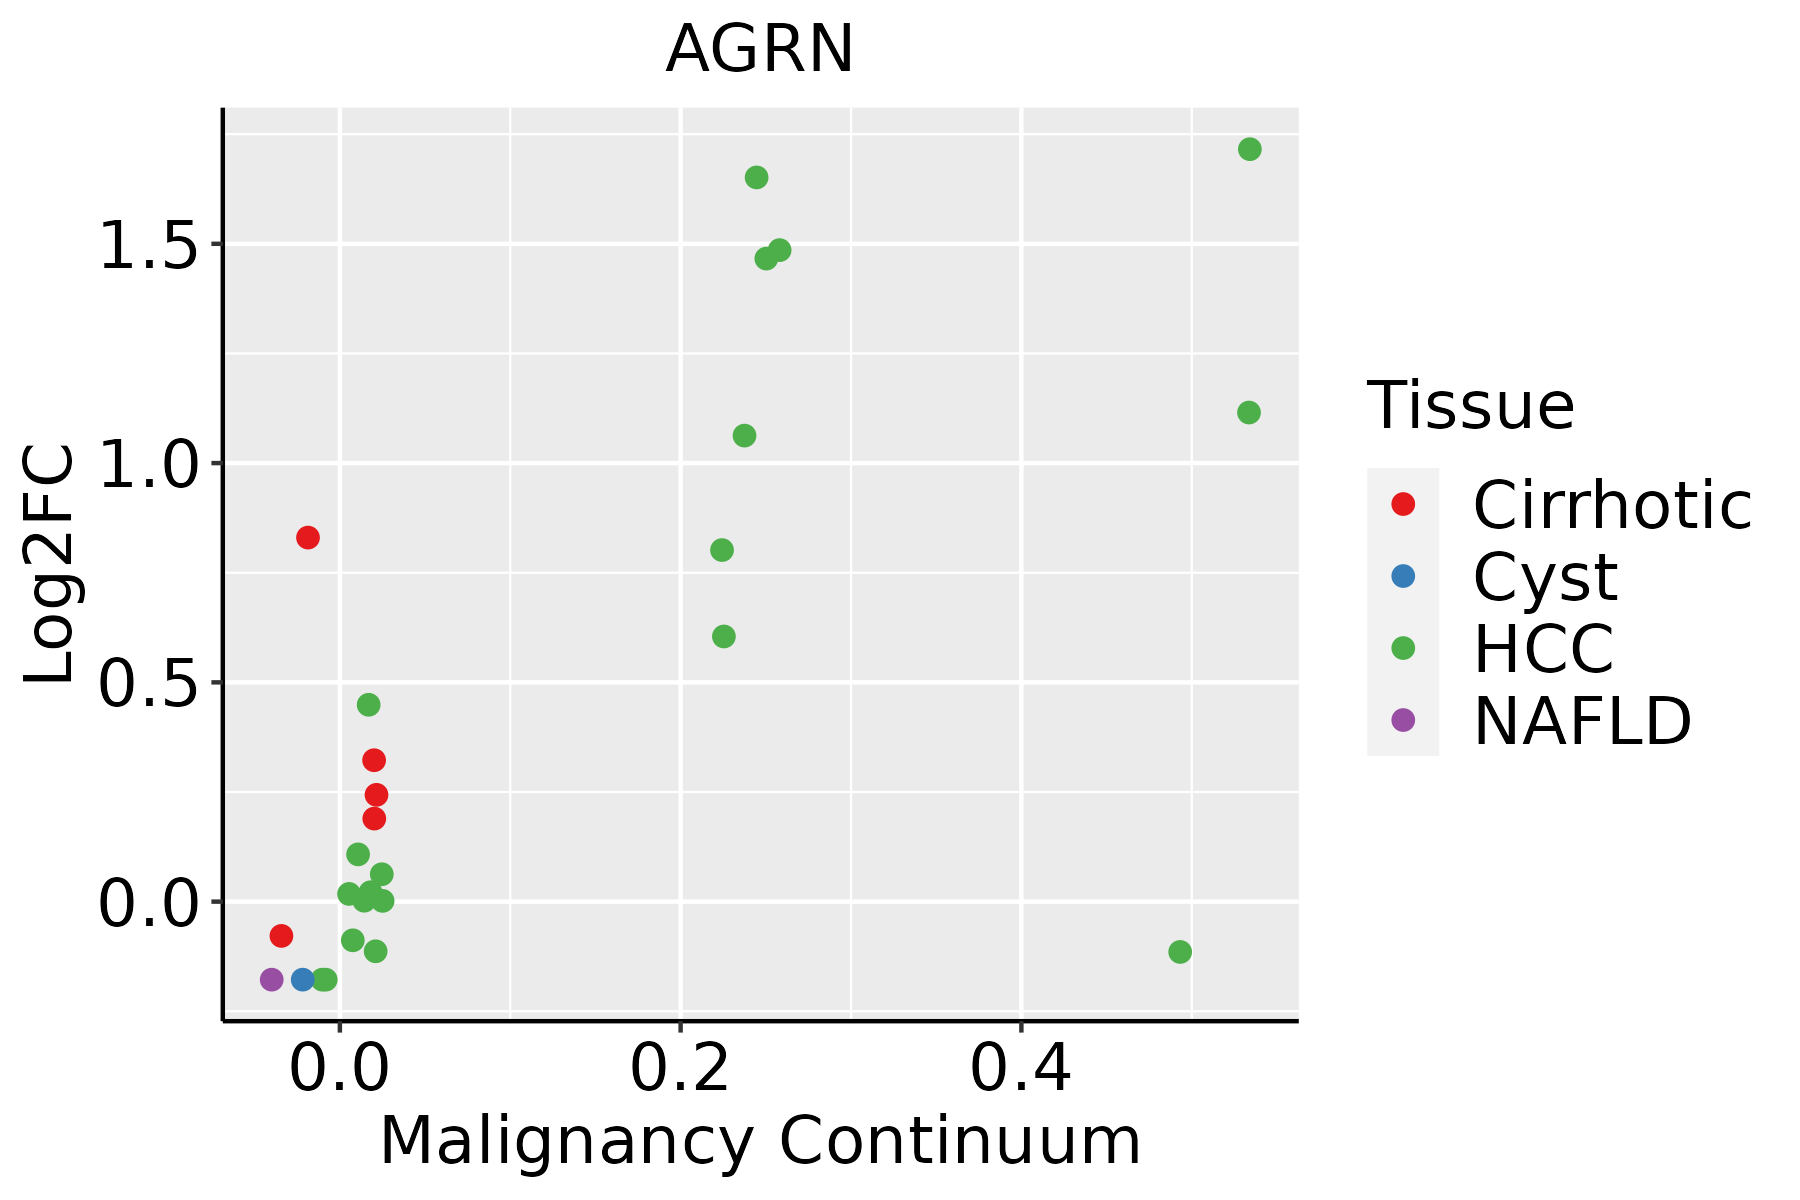 | HCC: Hepatocellular carcinoma |
| NAFLD: Non-alcoholic fatty liver disease | ||
| Oral Cavity |  | EOLP: Erosive Oral lichen planus |
| LP: leukoplakia | ||
| NEOLP: Non-erosive oral lichen planus | ||
| OSCC: Oral squamous cell carcinoma | ||
| Skin |  | AK: Actinic keratosis |
| cSCC: Cutaneous squamous cell carcinoma | ||
| SCCIS:squamous cell carcinoma in situ | ||
| Thyroid |  | ATC: Anaplastic thyroid cancer |
| HT: Hashimoto's thyroiditis | ||
| PTC: Papillary thyroid cancer |
| ∗log2FC in expression of this searched gene in stem-like cells from each diseased tissue sample relative to stem-like cells in normal samples in each tissue plotted against the malignancy continuum. Samples are colored based on if they are from different disease stage. |
Top |
Malignant transformation related pathway analysis |
| Find out the enriched GO biological processes and KEGG pathways involved in transition from healthy to precancer to cancer |
| Tissue | Disease Stage | Enriched GO biological Processes |
| Colorectum | AD |  |
| Colorectum | SER |  |
| Colorectum | MSS |  |
| Colorectum | MSI-H |  |
| Colorectum | FAP |  |
| ∗Top 15 enriched GO BP terms are showed in the bar plot of each disease state in each tissue. Each row represents a significant GO biological process which is colored according to the -log10(p.adjust). |
| Page: 1 2 3 4 5 6 7 8 9 |
| GO ID | Tissue | Disease Stage | Description | Gene Ratio | Bg Ratio | pvalue | p.adjust | Count |
| GO:006049117 | Esophagus | HGIN | regulation of cell projection assembly | 39/2587 | 188/18723 | 5.61e-03 | 4.57e-02 | 39 |
| GO:003134616 | Esophagus | ESCC | positive regulation of cell projection organization | 201/8552 | 353/18723 | 1.19e-05 | 1.11e-04 | 201 |
| GO:006049118 | Esophagus | ESCC | regulation of cell projection assembly | 110/8552 | 188/18723 | 2.60e-04 | 1.58e-03 | 110 |
| GO:003432918 | Esophagus | ESCC | cell junction assembly | 227/8552 | 420/18723 | 3.06e-04 | 1.83e-03 | 227 |
| GO:012003218 | Esophagus | ESCC | regulation of plasma membrane bounded cell projection assembly | 108/8552 | 186/18723 | 4.37e-04 | 2.46e-03 | 108 |
| GO:00519606 | Esophagus | ESCC | regulation of nervous system development | 237/8552 | 443/18723 | 5.02e-04 | 2.78e-03 | 237 |
| GO:01200347 | Esophagus | ESCC | positive regulation of plasma membrane bounded cell projection assembly | 64/8552 | 105/18723 | 1.15e-03 | 5.70e-03 | 64 |
| GO:00519625 | Esophagus | ESCC | positive regulation of nervous system development | 149/8552 | 272/18723 | 1.50e-03 | 7.06e-03 | 149 |
| GO:004308715 | Esophagus | ESCC | regulation of GTPase activity | 183/8552 | 348/18723 | 5.34e-03 | 2.00e-02 | 183 |
| GO:004592717 | Esophagus | ESCC | positive regulation of growth | 137/8552 | 259/18723 | 1.13e-02 | 3.80e-02 | 137 |
| GO:190188810 | Esophagus | ESCC | regulation of cell junction assembly | 109/8552 | 204/18723 | 1.53e-02 | 4.96e-02 | 109 |
| GO:01200326 | Liver | Cirrhotic | regulation of plasma membrane bounded cell projection assembly | 63/4634 | 186/18723 | 3.16e-03 | 1.78e-02 | 63 |
| GO:00604915 | Liver | Cirrhotic | regulation of cell projection assembly | 63/4634 | 188/18723 | 4.17e-03 | 2.22e-02 | 63 |
| GO:003134611 | Liver | HCC | positive regulation of cell projection organization | 193/7958 | 353/18723 | 2.28e-06 | 3.08e-05 | 193 |
| GO:006049112 | Liver | HCC | regulation of cell projection assembly | 101/7958 | 188/18723 | 1.20e-03 | 6.69e-03 | 101 |
| GO:012003212 | Liver | HCC | regulation of plasma membrane bounded cell projection assembly | 100/7958 | 186/18723 | 1.23e-03 | 6.81e-03 | 100 |
| GO:01200344 | Liver | HCC | positive regulation of plasma membrane bounded cell projection assembly | 58/7958 | 105/18723 | 5.66e-03 | 2.36e-02 | 58 |
| GO:004592711 | Liver | HCC | positive regulation of growth | 128/7958 | 259/18723 | 1.41e-02 | 4.99e-02 | 128 |
| GO:003134610 | Oral cavity | OSCC | positive regulation of cell projection organization | 176/7305 | 353/18723 | 1.94e-05 | 1.87e-04 | 176 |
| GO:006049110 | Oral cavity | OSCC | regulation of cell projection assembly | 100/7305 | 188/18723 | 5.27e-05 | 4.38e-04 | 100 |
| Page: 1 2 3 4 |
| Pathway ID | Tissue | Disease Stage | Description | Gene Ratio | Bg Ratio | pvalue | p.adjust | qvalue | Count |
| Page: 1 |
Top |
Cell-cell communication analysis |
| Identification of potential cell-cell interactions between two cell types and their ligand-receptor pairs for different disease states |
| Ligand | Receptor | LRpair | Pathway | Tissue | Disease Stage |
| AGRN | DAG1 | AGRN_DAG1 | AGRN | Cervix | Precancer |
| AGRN | DAG1 | AGRN_DAG1 | AGRN | CRC | MSI-H |
| AGRN | DAG1 | AGRN_DAG1 | AGRN | Esophagus | ADJ |
| AGRN | DAG1 | AGRN_DAG1 | AGRN | Esophagus | ESCC |
| AGRN | DAG1 | AGRN_DAG1 | AGRN | HNSCC | ADJ |
| AGRN | DAG1 | AGRN_DAG1 | AGRN | HNSCC | OSCC |
| AGRN | DAG1 | AGRN_DAG1 | AGRN | HNSCC | Precancer |
| AGRN | DAG1 | AGRN_DAG1 | AGRN | Liver | HCC |
| AGRN | DAG1 | AGRN_DAG1 | AGRN | Lung | AAH |
| AGRN | DAG1 | AGRN_DAG1 | AGRN | Prostate | Tumor |
| AGRN | DAG1 | AGRN_DAG1 | AGRN | Skin | cSCC |
| AGRN | DAG1 | AGRN_DAG1 | AGRN | THCA | ADJ |
| AGRN | DAG1 | AGRN_DAG1 | AGRN | THCA | Cancer |
| Page: 1 |
Top |
Single-cell gene regulatory network inference analysis |
| Find out the significant the regulons (TFs) and the target genes of each regulon across cell types for different disease states |
| TF | Cell Type | Tissue | Disease Stage | Target Gene | RSS | Regulon Activity |
| ∗The dot plots of a searched regulon are shown for all cell subpopulations in each disease state of each tissue based on the regulon specific score inferred using pySCENIC and by calculating the average expression. |
| Page: 1 |
Top |
Somatic mutation of malignant transformation related genes |
| Annotation of somatic variants for genes involved in malignant transformation |
| Hugo Symbol | Variant Class | Variant Classification | dbSNP RS | HGVSc | HGVSp | HGVSp Short | SWISSPROT | BIOTYPE | SIFT | PolyPhen | Tumor Sample Barcode | Tissue | Histology | Sex | Age | Stage | Therapy Types | Drugs | Outcome |
| AGRN | SNV | Missense_Mutation | novel | c.537N>A | p.Phe179Leu | p.F179L | O00468 | protein_coding | deleterious(0) | probably_damaging(0.983) | TCGA-5L-AAT1-01 | Breast | breast invasive carcinoma | Female | <65 | III/IV | Hormone Therapy | letrozol | SD |
| AGRN | SNV | Missense_Mutation | rs140789461 | c.1865N>A | p.Arg622Gln | p.R622Q | O00468 | protein_coding | tolerated(0.33) | benign(0.2) | TCGA-AC-A2FM-01 | Breast | breast invasive carcinoma | Female | >=65 | I/II | Unknown | Unknown | PD |
| AGRN | SNV | Missense_Mutation | novel | c.4980G>T | p.Glu1660Asp | p.E1660D | O00468 | protein_coding | tolerated(0.58) | benign(0.003) | TCGA-AR-A1AI-01 | Breast | breast invasive carcinoma | Female | <65 | I/II | Chemotherapy | cytoxan | PD |
| AGRN | SNV | Missense_Mutation | c.4418A>T | p.Glu1473Val | p.E1473V | O00468 | protein_coding | deleterious(0) | probably_damaging(0.999) | TCGA-D8-A27M-01 | Breast | breast invasive carcinoma | Female | <65 | I/II | Chemotherapy | methotrexate+5 | SD | |
| AGRN | SNV | Missense_Mutation | c.490G>T | p.Val164Leu | p.V164L | O00468 | protein_coding | tolerated(0.08) | benign(0.12) | TCGA-GM-A2DD-01 | Breast | breast invasive carcinoma | Female | <65 | I/II | Chemotherapy | fluorouracil | CR | |
| AGRN | SNV | Missense_Mutation | rs139302553 | c.1460C>T | p.Ala487Val | p.A487V | O00468 | protein_coding | tolerated(1) | benign(0.005) | TCGA-OL-A5RW-01 | Breast | breast invasive carcinoma | Female | <65 | I/II | Chemotherapy | adriamycin | CR |
| AGRN | SNV | Missense_Mutation | rs750603697 | c.1784N>T | p.Ser595Leu | p.S595L | O00468 | protein_coding | deleterious(0.03) | probably_damaging(0.932) | TCGA-C5-A1BF-01 | Cervix | cervical & endocervical cancer | Female | <65 | I/II | Chemotherapy | cisplatin | PD |
| AGRN | SNV | Missense_Mutation | novel | c.2719G>A | p.Glu907Lys | p.E907K | O00468 | protein_coding | tolerated(0.18) | benign(0.023) | TCGA-C5-A902-01 | Cervix | cervical & endocervical cancer | Female | <65 | I/II | Chemotherapy | cisplatin | SD |
| AGRN | SNV | Missense_Mutation | c.3610N>C | p.Val1204Leu | p.V1204L | O00468 | protein_coding | deleterious(0.01) | possibly_damaging(0.675) | TCGA-DG-A2KM-01 | Cervix | cervical & endocervical cancer | Female | <65 | I/II | Chemotherapy | cisplatin | SD | |
| AGRN | SNV | Missense_Mutation | rs374026237 | c.6097N>A | p.Ala2033Thr | p.A2033T | O00468 | protein_coding | deleterious(0) | probably_damaging(0.997) | TCGA-EA-A410-01 | Cervix | cervical & endocervical cancer | Female | <65 | I/II | Unknown | Unknown | SD |
| Page: 1 2 3 4 5 6 7 8 9 10 11 12 |
Top |
Related drugs of malignant transformation related genes |
| Identification of chemicals and drugs interact with genes involved in malignant transfromation |
| (DGIdb 4.0) |
| Entrez ID | Symbol | Category | Interaction Types | Drug Claim Name | Drug Name | PMIDs |
| Page: 1 |

Copyright 2023-Present -The University of Texas Health Science Center at Houston |