
|
|||||
|
 | |
| |
| |
| |
| |
| |
|
Gene: AGR3 |
Gene summary for AGR3 |
| Gene information | Species | Human | Gene symbol | AGR3 | Gene ID | 155465 |
| Gene name | anterior gradient 3, protein disulphide isomerase family member | |
| Gene Alias | AG-3 | |
| Cytomap | 7p21.1 | |
| Gene Type | protein-coding | GO ID | GO:0008150 | UniProtAcc | Q8TD06 |
Top |
Malignant transformation analysis |
| Identification of the aberrant gene expression in precancerous and cancerous lesions by comparing the gene expression of stem-like cells in diseased tissues with normal stem cells |
| Entrez ID | Symbol | Replicates | Species | Organ | Tissue | Adj P-value | Log2FC | Malignancy |
| 155465 | AGR3 | GSM4909285 | Human | Breast | IDC | 3.32e-03 | -1.99e-01 | 0.21 |
| 155465 | AGR3 | GSM4909293 | Human | Breast | IDC | 2.04e-17 | 3.58e-01 | 0.1581 |
| 155465 | AGR3 | GSM4909296 | Human | Breast | IDC | 2.45e-14 | 6.32e-01 | 0.1524 |
| 155465 | AGR3 | GSM4909297 | Human | Breast | IDC | 4.94e-35 | 9.25e-01 | 0.1517 |
| 155465 | AGR3 | GSM4909298 | Human | Breast | IDC | 2.10e-08 | 2.60e-01 | 0.1551 |
| 155465 | AGR3 | GSM4909299 | Human | Breast | IDC | 8.27e-03 | 2.61e-01 | 0.035 |
| 155465 | AGR3 | GSM4909301 | Human | Breast | IDC | 2.29e-124 | 1.61e+00 | 0.1577 |
| 155465 | AGR3 | GSM4909302 | Human | Breast | IDC | 1.30e-15 | 4.98e-01 | 0.1545 |
| 155465 | AGR3 | GSM4909303 | Human | Breast | IDC | 2.40e-02 | 2.61e-01 | 0.0438 |
| 155465 | AGR3 | GSM4909304 | Human | Breast | IDC | 5.28e-25 | 5.19e-01 | 0.1636 |
| 155465 | AGR3 | GSM4909306 | Human | Breast | IDC | 8.03e-55 | 9.45e-01 | 0.1564 |
| 155465 | AGR3 | GSM4909307 | Human | Breast | IDC | 4.74e-57 | 1.08e+00 | 0.1569 |
| 155465 | AGR3 | GSM4909308 | Human | Breast | IDC | 4.25e-126 | 1.66e+00 | 0.158 |
| 155465 | AGR3 | GSM4909311 | Human | Breast | IDC | 5.56e-03 | 2.45e-01 | 0.1534 |
| 155465 | AGR3 | GSM4909312 | Human | Breast | IDC | 8.64e-32 | 8.58e-01 | 0.1552 |
| 155465 | AGR3 | GSM4909313 | Human | Breast | IDC | 5.37e-04 | 3.38e-01 | 0.0391 |
| 155465 | AGR3 | GSM4909319 | Human | Breast | IDC | 2.63e-08 | 2.36e-01 | 0.1563 |
| 155465 | AGR3 | GSM4909321 | Human | Breast | IDC | 1.17e-06 | 3.93e-01 | 0.1559 |
| 155465 | AGR3 | brca1 | Human | Breast | Precancer | 1.48e-02 | -2.02e-01 | -0.0338 |
| 155465 | AGR3 | M1 | Human | Breast | IDC | 1.33e-38 | 9.96e-01 | 0.1577 |
| Page: 1 2 3 4 5 6 |
| Tissue | Expression Dynamics | Abbreviation |
| Breast | 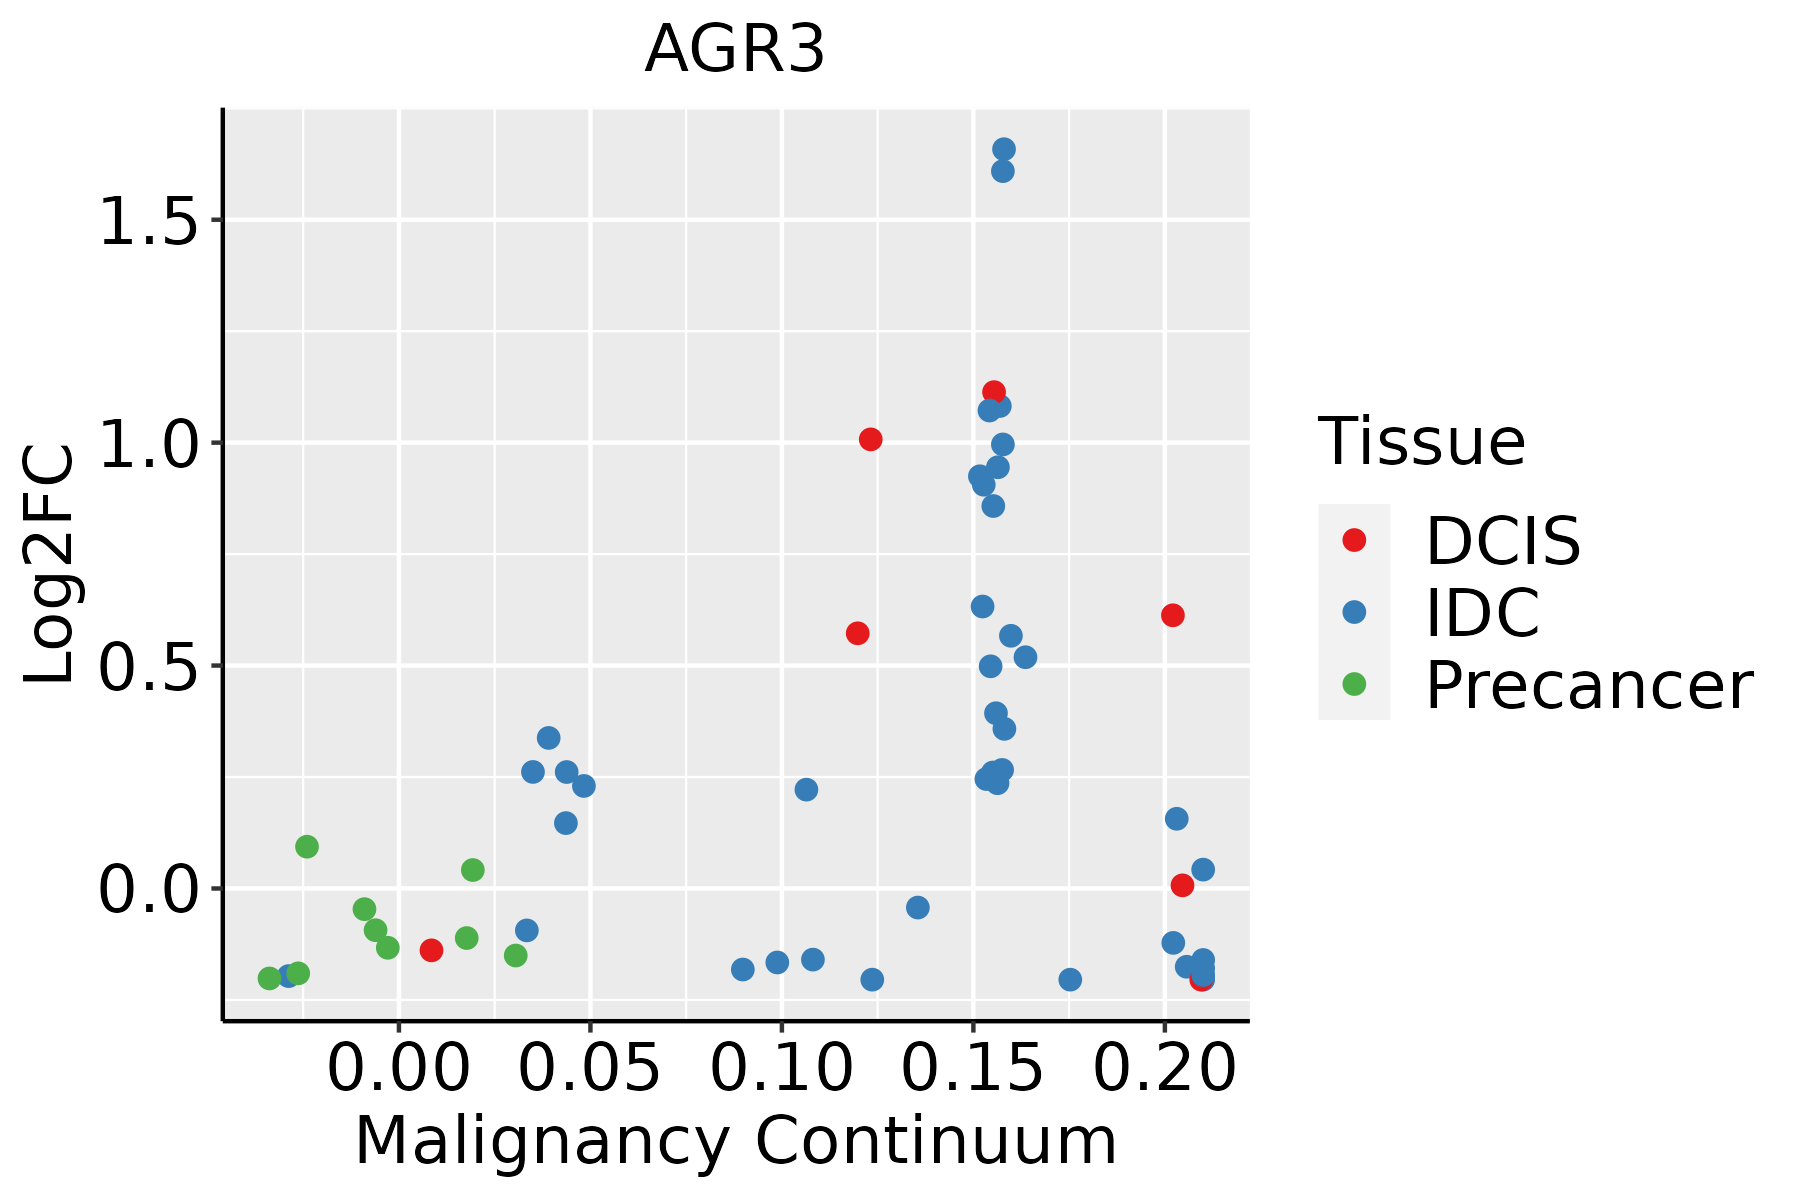 | IDC: Invasive ductal carcinoma |
| DCIS: Ductal carcinoma in situ | ||
| Precancer(BRCA1-mut): Precancerous lesion from BRCA1 mutation carriers | ||
| Colorectum (GSE201348) |  | FAP: Familial adenomatous polyposis |
| CRC: Colorectal cancer | ||
| Colorectum (HTA11) |  | AD: Adenomas |
| SER: Sessile serrated lesions | ||
| MSI-H: Microsatellite-high colorectal cancer | ||
| MSS: Microsatellite stable colorectal cancer | ||
| Endometrium | 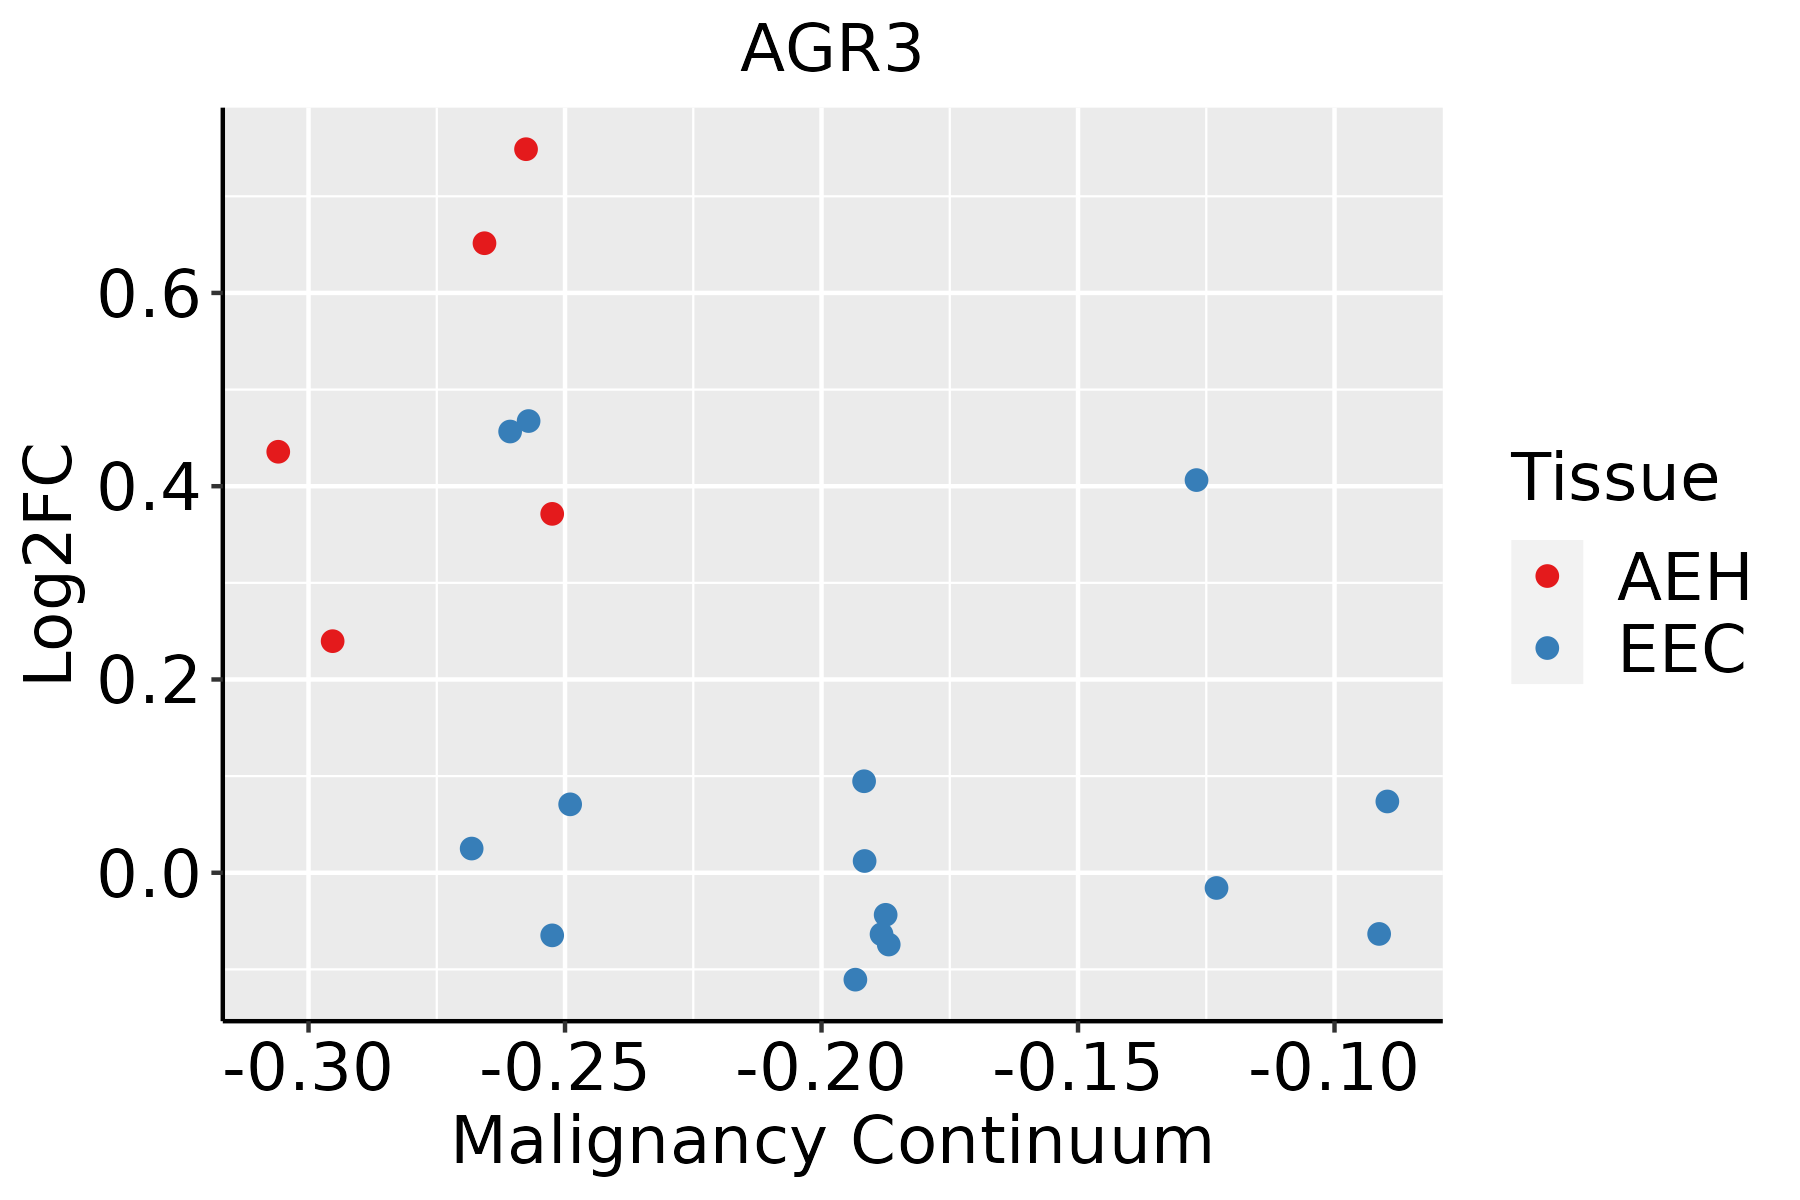 | AEH: Atypical endometrial hyperplasia |
| EEC: Endometrioid Cancer | ||
| Esophagus | 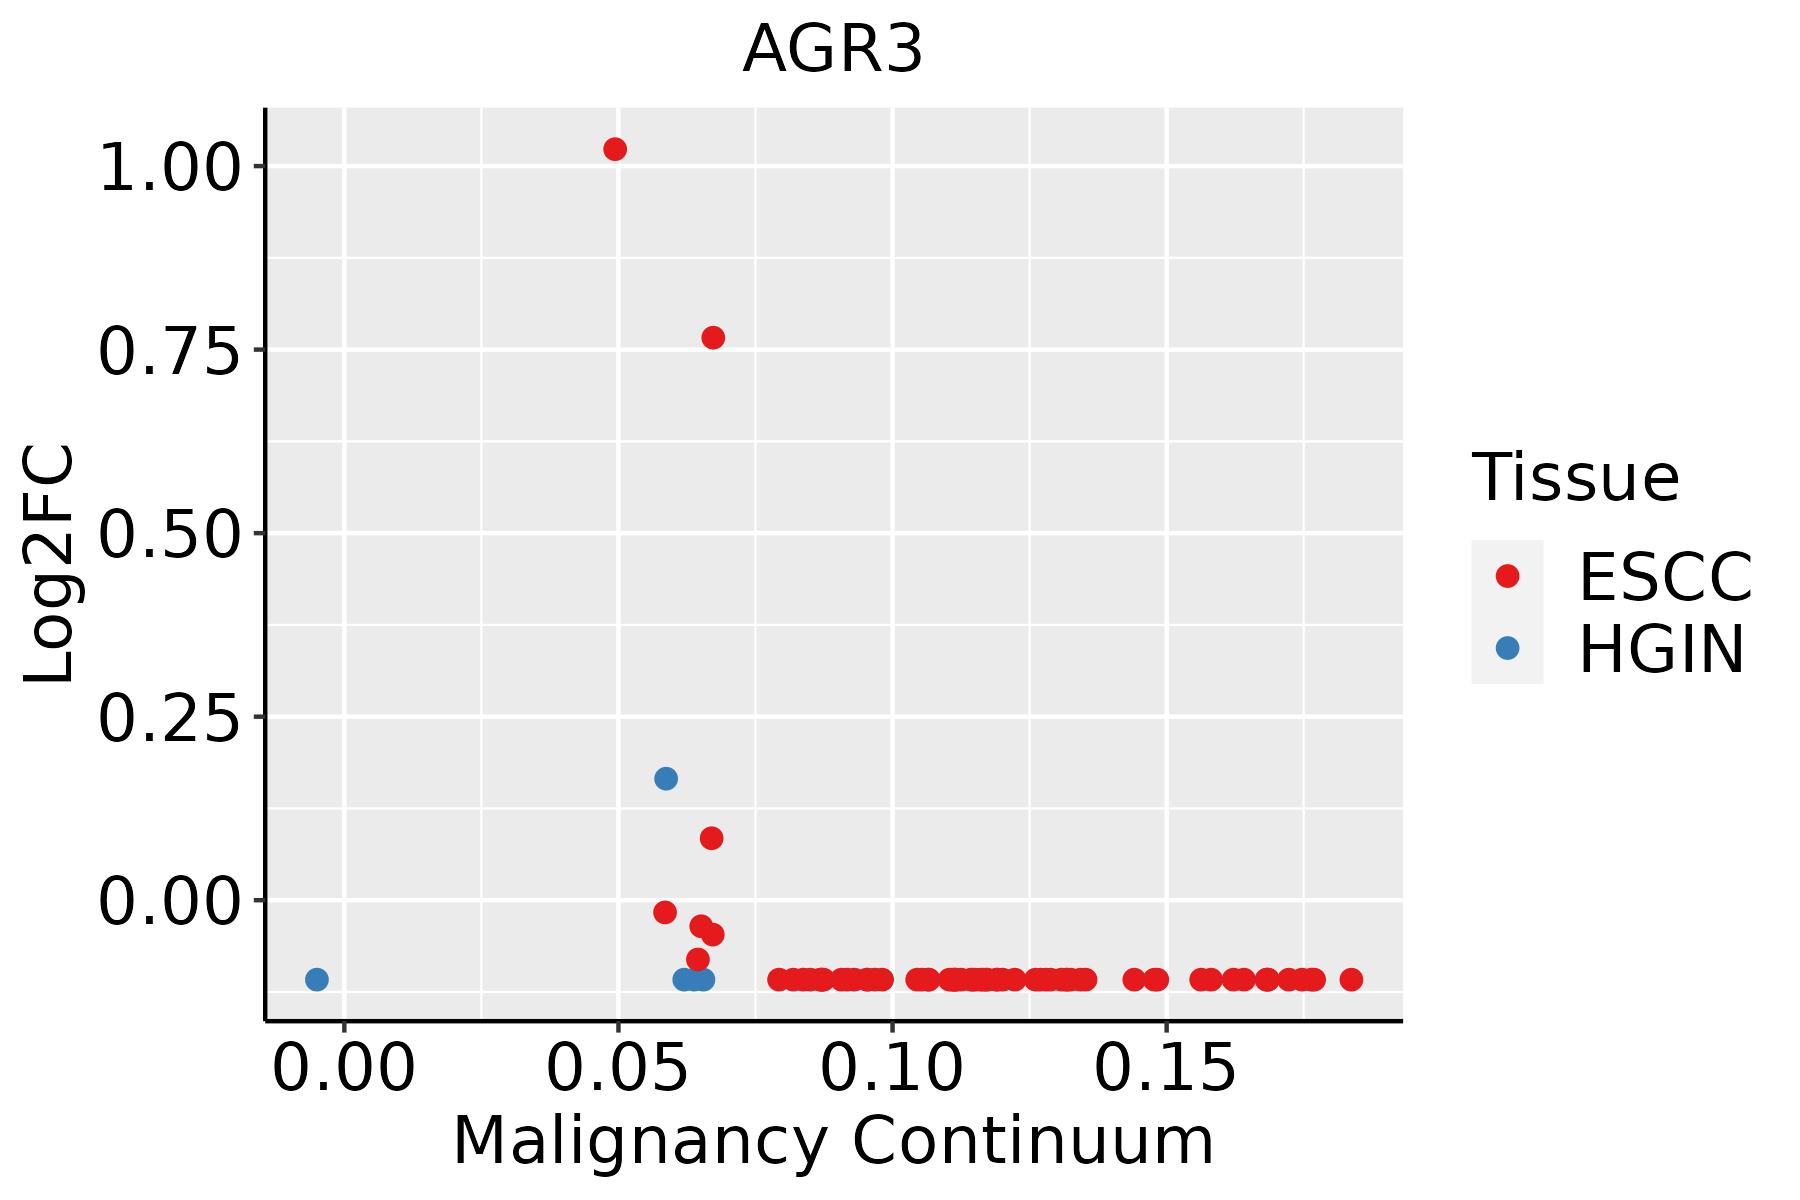 | ESCC: Esophageal squamous cell carcinoma |
| HGIN: High-grade intraepithelial neoplasias | ||
| LGIN: Low-grade intraepithelial neoplasias | ||
| GC | 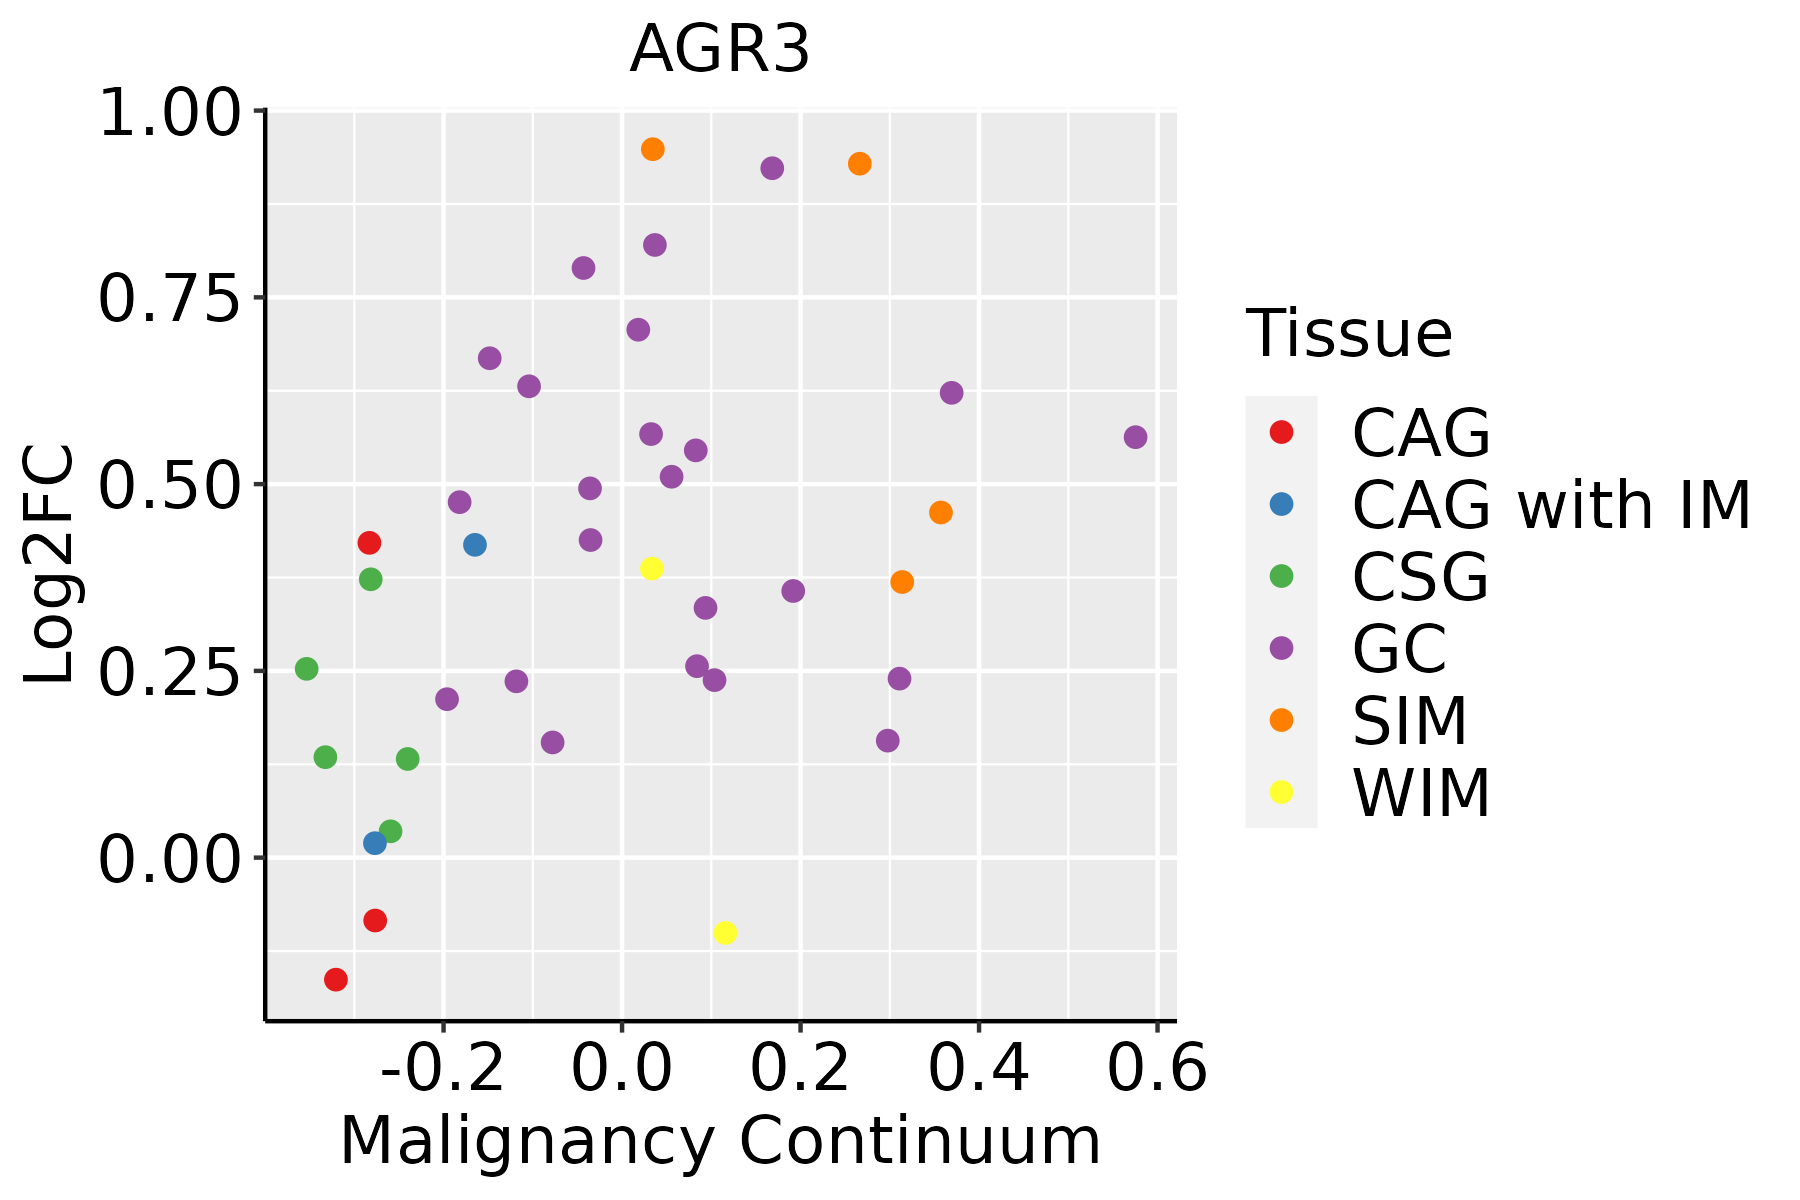 | CAG: Chronic atrophic gastritis |
| CAG with IM: Chronic atrophic gastritis with intestinal metaplasia | ||
| CSG: Chronic superficial gastritis | ||
| GC: Gastric cancer | ||
| SIM: Severe intestinal metaplasia | ||
| WIM: Wild intestinal metaplasia | ||
| Lung | 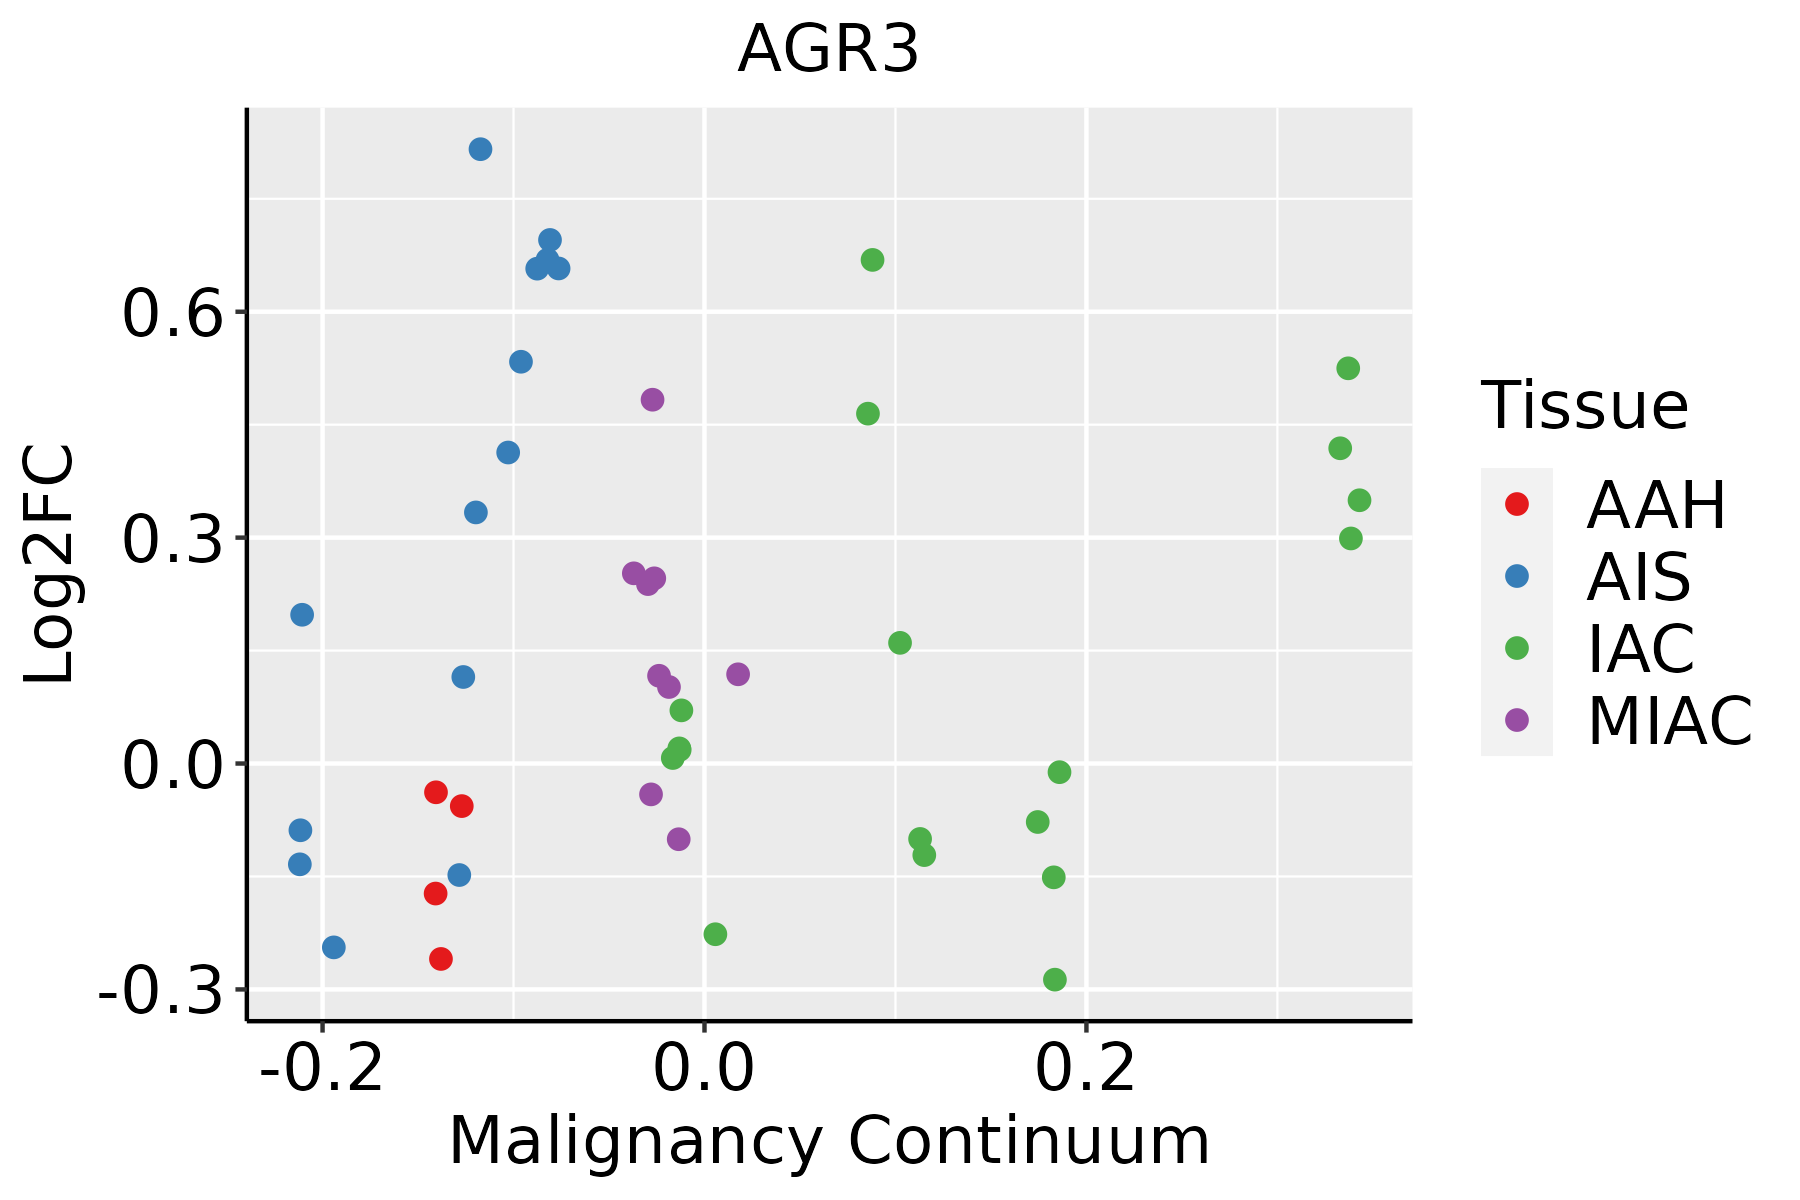 | AAH: Atypical adenomatous hyperplasia |
| AIS: Adenocarcinoma in situ | ||
| IAC: Invasive lung adenocarcinoma | ||
| MIA: Minimally invasive adenocarcinoma | ||
| Oral Cavity | 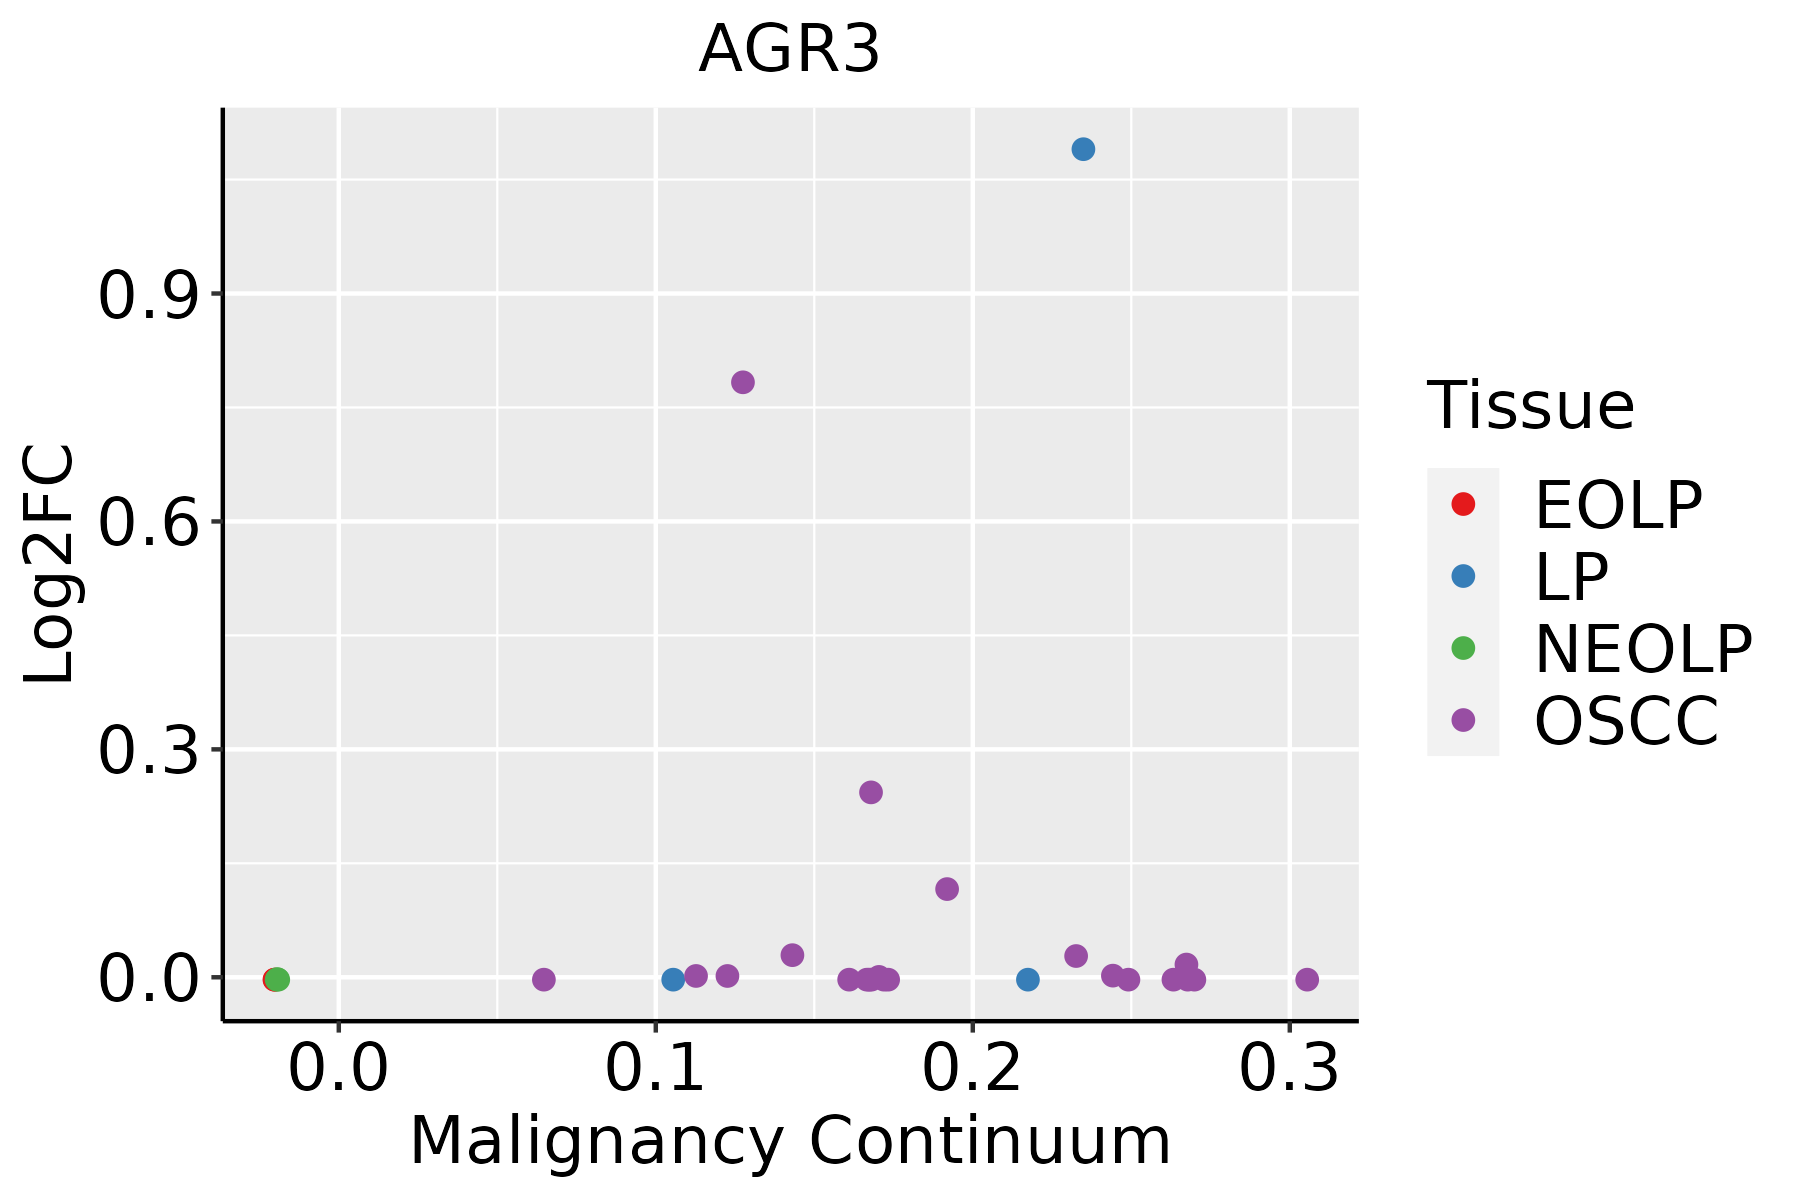 | EOLP: Erosive Oral lichen planus |
| LP: leukoplakia | ||
| NEOLP: Non-erosive oral lichen planus | ||
| OSCC: Oral squamous cell carcinoma |
| ∗log2FC in expression of this searched gene in stem-like cells from each diseased tissue sample relative to stem-like cells in normal samples in each tissue plotted against the malignancy continuum. Samples are colored based on if they are from different disease stage. |
Top |
Malignant transformation related pathway analysis |
| Find out the enriched GO biological processes and KEGG pathways involved in transition from healthy to precancer to cancer |
| Tissue | Disease Stage | Enriched GO biological Processes |
| Colorectum | AD |  |
| Colorectum | SER |  |
| Colorectum | MSS |  |
| Colorectum | MSI-H |  |
| Colorectum | FAP |  |
| ∗Top 15 enriched GO BP terms are showed in the bar plot of each disease state in each tissue. Each row represents a significant GO biological process which is colored according to the -log10(p.adjust). |
| Page: 1 2 3 4 5 6 7 8 9 |
| GO ID | Tissue | Disease Stage | Description | Gene Ratio | Bg Ratio | pvalue | p.adjust | Count |
| Page: 1 |
| Pathway ID | Tissue | Disease Stage | Description | Gene Ratio | Bg Ratio | pvalue | p.adjust | qvalue | Count |
| Page: 1 |
Top |
Cell-cell communication analysis |
| Identification of potential cell-cell interactions between two cell types and their ligand-receptor pairs for different disease states |
| Ligand | Receptor | LRpair | Pathway | Tissue | Disease Stage |
| Page: 1 |
Top |
Single-cell gene regulatory network inference analysis |
| Find out the significant the regulons (TFs) and the target genes of each regulon across cell types for different disease states |
| TF | Cell Type | Tissue | Disease Stage | Target Gene | RSS | Regulon Activity |
| ∗The dot plots of a searched regulon are shown for all cell subpopulations in each disease state of each tissue based on the regulon specific score inferred using pySCENIC and by calculating the average expression. |
| Page: 1 |
Top |
Somatic mutation of malignant transformation related genes |
| Annotation of somatic variants for genes involved in malignant transformation |
| Hugo Symbol | Variant Class | Variant Classification | dbSNP RS | HGVSc | HGVSp | HGVSp Short | SWISSPROT | BIOTYPE | SIFT | PolyPhen | Tumor Sample Barcode | Tissue | Histology | Sex | Age | Stage | Therapy Types | Drugs | Outcome |
| AGR3 | SNV | Missense_Mutation | novel | c.386G>C | p.Arg129Thr | p.R129T | Q8TD06 | protein_coding | deleterious(0) | probably_damaging(0.99) | TCGA-C5-A2LZ-01 | Cervix | cervical & endocervical cancer | Female | >=65 | III/IV | Unknown | Unknown | PD |
| AGR3 | SNV | Missense_Mutation | novel | c.321N>T | p.Lys107Asn | p.K107N | Q8TD06 | protein_coding | deleterious(0.02) | probably_damaging(0.996) | TCGA-EI-6917-01 | Colorectum | rectum adenocarcinoma | Male | <65 | III/IV | Chemotherapy | 5fluorouracil+oxaciplatina+l-folinian | SD |
| AGR3 | SNV | Missense_Mutation | novel | c.74N>C | p.Lys25Thr | p.K25T | Q8TD06 | protein_coding | tolerated(0.15) | benign(0.023) | TCGA-EI-6917-01 | Colorectum | rectum adenocarcinoma | Male | <65 | III/IV | Chemotherapy | 5fluorouracil+oxaciplatina+l-folinian | SD |
| AGR3 | SNV | Missense_Mutation | novel | c.481N>A | p.Leu161Ile | p.L161I | Q8TD06 | protein_coding | deleterious(0.01) | probably_damaging(0.964) | TCGA-AJ-A3EK-01 | Endometrium | uterine corpus endometrioid carcinoma | Female | <65 | I/II | Chemotherapy | carboplatin | CR |
| AGR3 | SNV | Missense_Mutation | novel | c.404N>T | p.Arg135Ile | p.R135I | Q8TD06 | protein_coding | deleterious(0.01) | benign(0) | TCGA-AP-A1DV-01 | Endometrium | uterine corpus endometrioid carcinoma | Female | <65 | I/II | Unknown | Unknown | SD |
| AGR3 | SNV | Missense_Mutation | novel | c.276G>T | p.Gln92His | p.Q92H | Q8TD06 | protein_coding | tolerated(0.76) | benign(0.015) | TCGA-AX-A2HC-01 | Endometrium | uterine corpus endometrioid carcinoma | Female | <65 | III/IV | Chemotherapy | paclitaxel | PD |
| AGR3 | SNV | Missense_Mutation | novel | c.332N>A | p.Pro111His | p.P111H | Q8TD06 | protein_coding | deleterious(0.01) | probably_damaging(0.999) | TCGA-B5-A1MX-01 | Endometrium | uterine corpus endometrioid carcinoma | Female | <65 | I/II | Hormone Therapy | megace | SD |
| AGR3 | SNV | Missense_Mutation | novel | c.404N>C | p.Arg135Thr | p.R135T | Q8TD06 | protein_coding | deleterious(0.02) | benign(0.029) | TCGA-DD-AADK-01 | Liver | liver hepatocellular carcinoma | Female | >=65 | I/II | Unknown | Unknown | SD |
| AGR3 | SNV | Missense_Mutation | c.420N>T | p.Leu140Phe | p.L140F | Q8TD06 | protein_coding | tolerated(0.08) | possibly_damaging(0.816) | TCGA-35-4123-01 | Lung | lung adenocarcinoma | Male | <65 | I/II | Unknown | Unknown | SD | |
| AGR3 | SNV | Missense_Mutation | novel | c.140N>G | p.Thr47Ser | p.T47S | Q8TD06 | protein_coding | tolerated(0.16) | probably_damaging(0.97) | TCGA-58-8387-01 | Lung | lung squamous cell carcinoma | Male | <65 | I/II | Chemotherapy | cisplatin | CR |
| Page: 1 2 |
Top |
Related drugs of malignant transformation related genes |
| Identification of chemicals and drugs interact with genes involved in malignant transfromation |
| (DGIdb 4.0) |
| Entrez ID | Symbol | Category | Interaction Types | Drug Claim Name | Drug Name | PMIDs |
| Page: 1 |

Copyright 2023-Present -The University of Texas Health Science Center at Houston |