
|
|||||
|
 | |
| |
| |
| |
| |
| |
|
Gene: AGPS |
Gene summary for AGPS |
| Gene information | Species | Human | Gene symbol | AGPS | Gene ID | 8540 |
| Gene name | alkylglycerone phosphate synthase | |
| Gene Alias | ADAP-S | |
| Cytomap | 2q31.2 | |
| Gene Type | protein-coding | GO ID | GO:0006629 | UniProtAcc | O00116 |
Top |
Malignant transformation analysis |
| Identification of the aberrant gene expression in precancerous and cancerous lesions by comparing the gene expression of stem-like cells in diseased tissues with normal stem cells |
| Entrez ID | Symbol | Replicates | Species | Organ | Tissue | Adj P-value | Log2FC | Malignancy |
| 8540 | AGPS | CCI_2 | Human | Cervix | CC | 1.65e-02 | 6.10e-01 | 0.5249 |
| 8540 | AGPS | CCI_3 | Human | Cervix | CC | 3.75e-05 | 5.95e-01 | 0.516 |
| 8540 | AGPS | Tumor | Human | Cervix | CC | 1.76e-02 | 2.10e-01 | 0.1241 |
| 8540 | AGPS | sample3 | Human | Cervix | CC | 1.31e-05 | 1.98e-01 | 0.1387 |
| 8540 | AGPS | T3 | Human | Cervix | CC | 1.17e-02 | 1.80e-01 | 0.1389 |
| 8540 | AGPS | HTA11_3410_2000001011 | Human | Colorectum | AD | 6.21e-07 | -4.47e-01 | 0.0155 |
| 8540 | AGPS | HTA11_696_2000001011 | Human | Colorectum | AD | 2.70e-03 | -2.42e-01 | -0.1464 |
| 8540 | AGPS | HTA11_866_3004761011 | Human | Colorectum | AD | 8.24e-03 | -4.18e-01 | 0.096 |
| 8540 | AGPS | HTA11_7696_3000711011 | Human | Colorectum | AD | 7.03e-13 | -3.72e-01 | 0.0674 |
| 8540 | AGPS | HTA11_99999970781_79442 | Human | Colorectum | MSS | 9.28e-06 | -2.90e-01 | 0.294 |
| 8540 | AGPS | HTA11_99999971662_82457 | Human | Colorectum | MSS | 1.11e-03 | -2.98e-01 | 0.3859 |
| 8540 | AGPS | HTA11_99999974143_84620 | Human | Colorectum | MSS | 2.80e-09 | -3.17e-01 | 0.3005 |
| 8540 | AGPS | A002-C-010 | Human | Colorectum | FAP | 8.02e-04 | -1.83e-01 | 0.242 |
| 8540 | AGPS | A001-C-207 | Human | Colorectum | FAP | 2.21e-02 | -3.10e-01 | 0.1278 |
| 8540 | AGPS | A015-C-203 | Human | Colorectum | FAP | 2.85e-29 | -4.19e-01 | -0.1294 |
| 8540 | AGPS | A002-C-201 | Human | Colorectum | FAP | 2.86e-06 | -2.56e-01 | 0.0324 |
| 8540 | AGPS | A002-C-203 | Human | Colorectum | FAP | 1.38e-06 | -2.67e-01 | 0.2786 |
| 8540 | AGPS | A001-C-119 | Human | Colorectum | FAP | 1.44e-06 | -4.51e-01 | -0.1557 |
| 8540 | AGPS | A001-C-108 | Human | Colorectum | FAP | 1.09e-15 | -3.39e-01 | -0.0272 |
| 8540 | AGPS | A002-C-205 | Human | Colorectum | FAP | 3.21e-15 | -4.03e-01 | -0.1236 |
| Page: 1 2 3 4 5 6 7 8 |
| Tissue | Expression Dynamics | Abbreviation |
| Cervix | 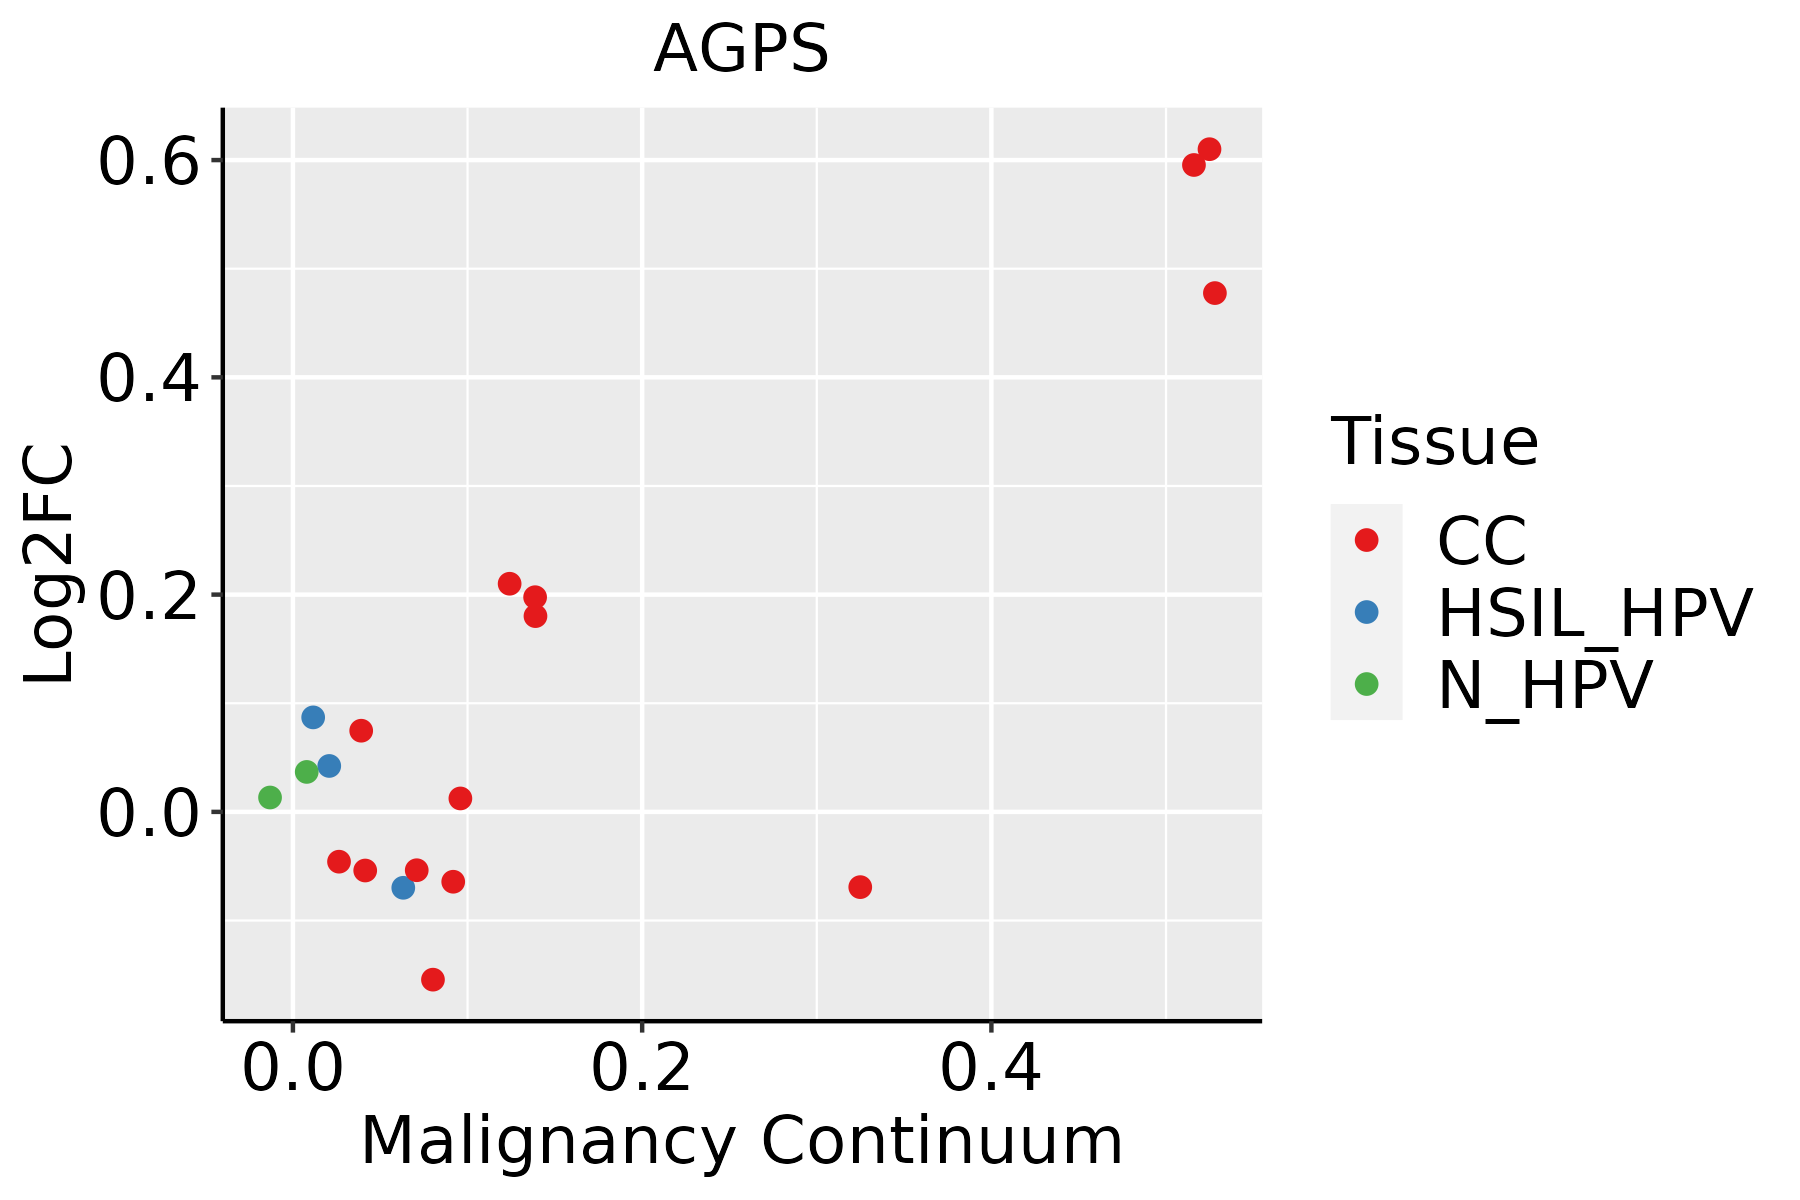 | CC: Cervix cancer |
| HSIL_HPV: HPV-infected high-grade squamous intraepithelial lesions | ||
| N_HPV: HPV-infected normal cervix | ||
| Colorectum (GSE201348) |  | FAP: Familial adenomatous polyposis |
| CRC: Colorectal cancer | ||
| Colorectum (HTA11) |  | AD: Adenomas |
| SER: Sessile serrated lesions | ||
| MSI-H: Microsatellite-high colorectal cancer | ||
| MSS: Microsatellite stable colorectal cancer | ||
| Esophagus | 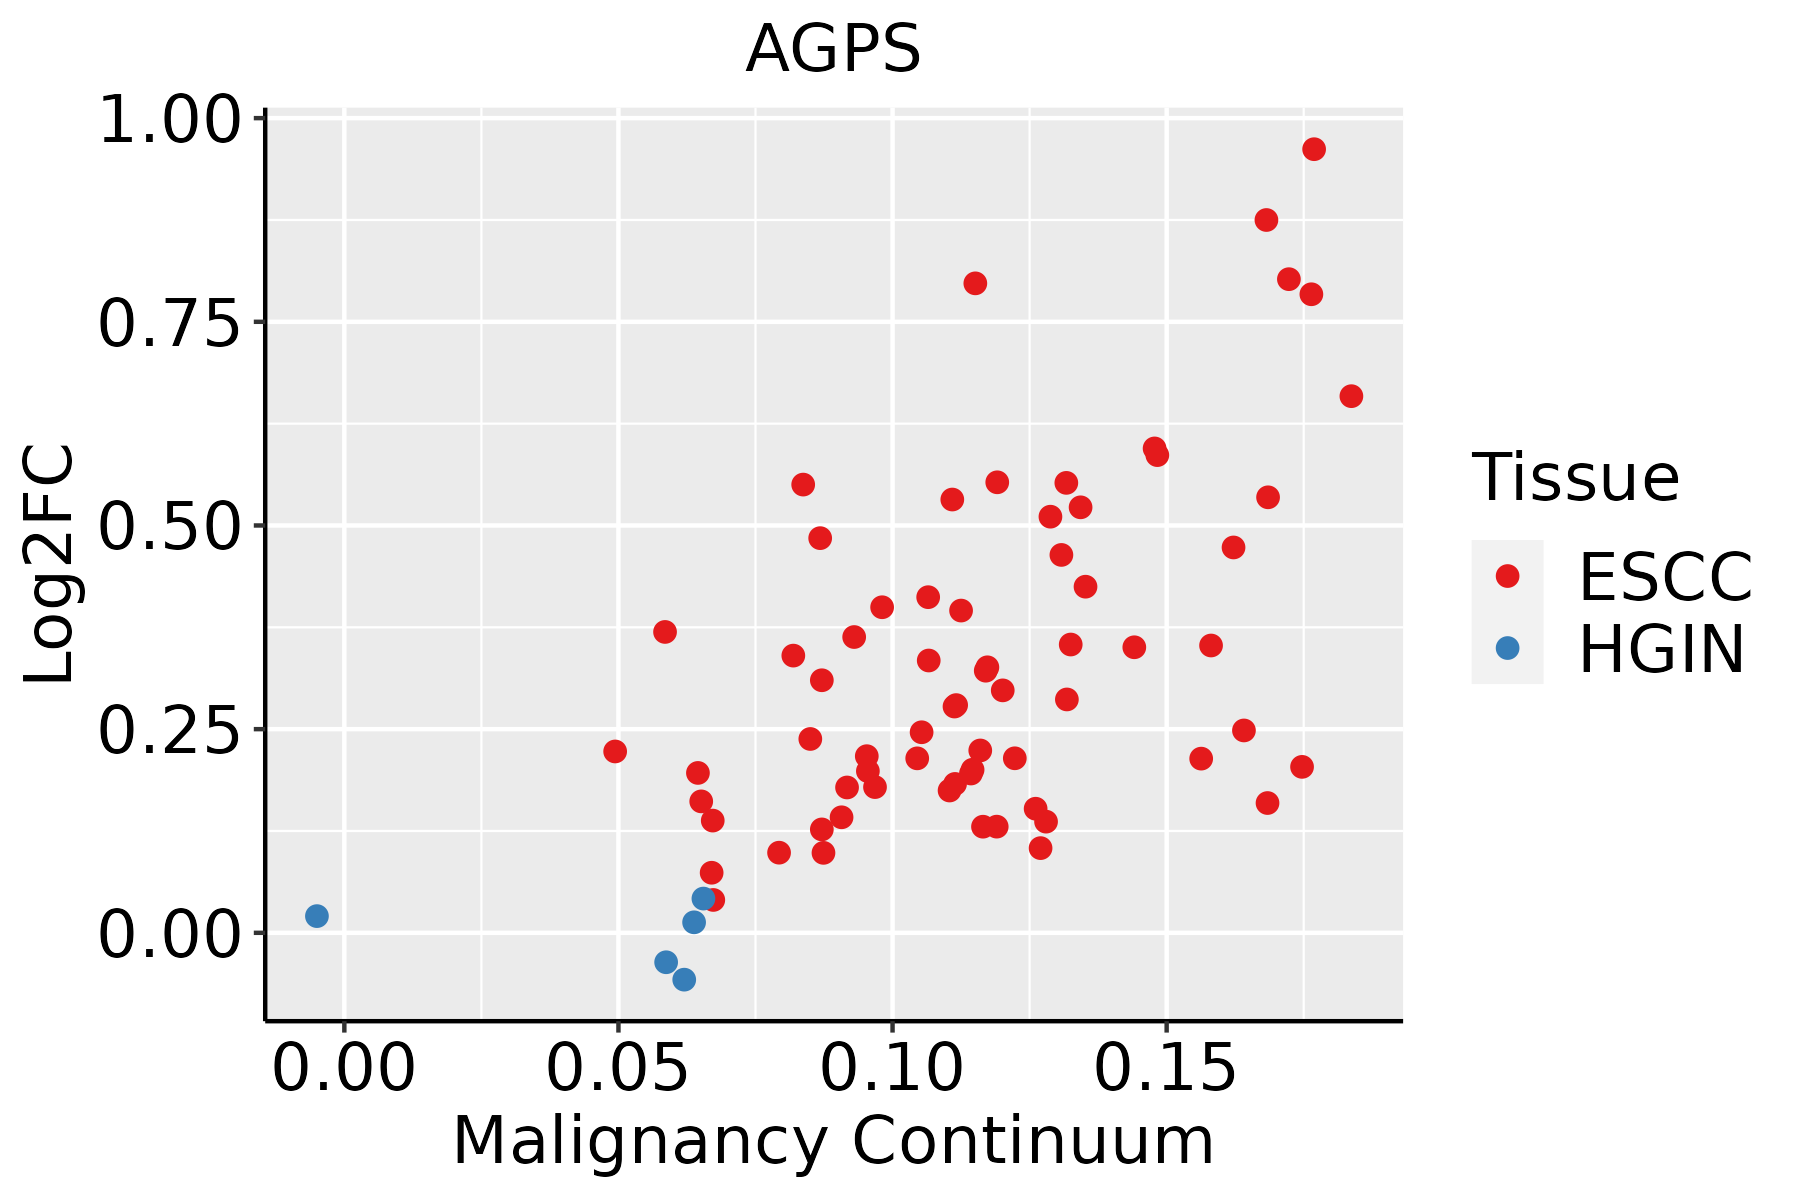 | ESCC: Esophageal squamous cell carcinoma |
| HGIN: High-grade intraepithelial neoplasias | ||
| LGIN: Low-grade intraepithelial neoplasias | ||
| Liver | 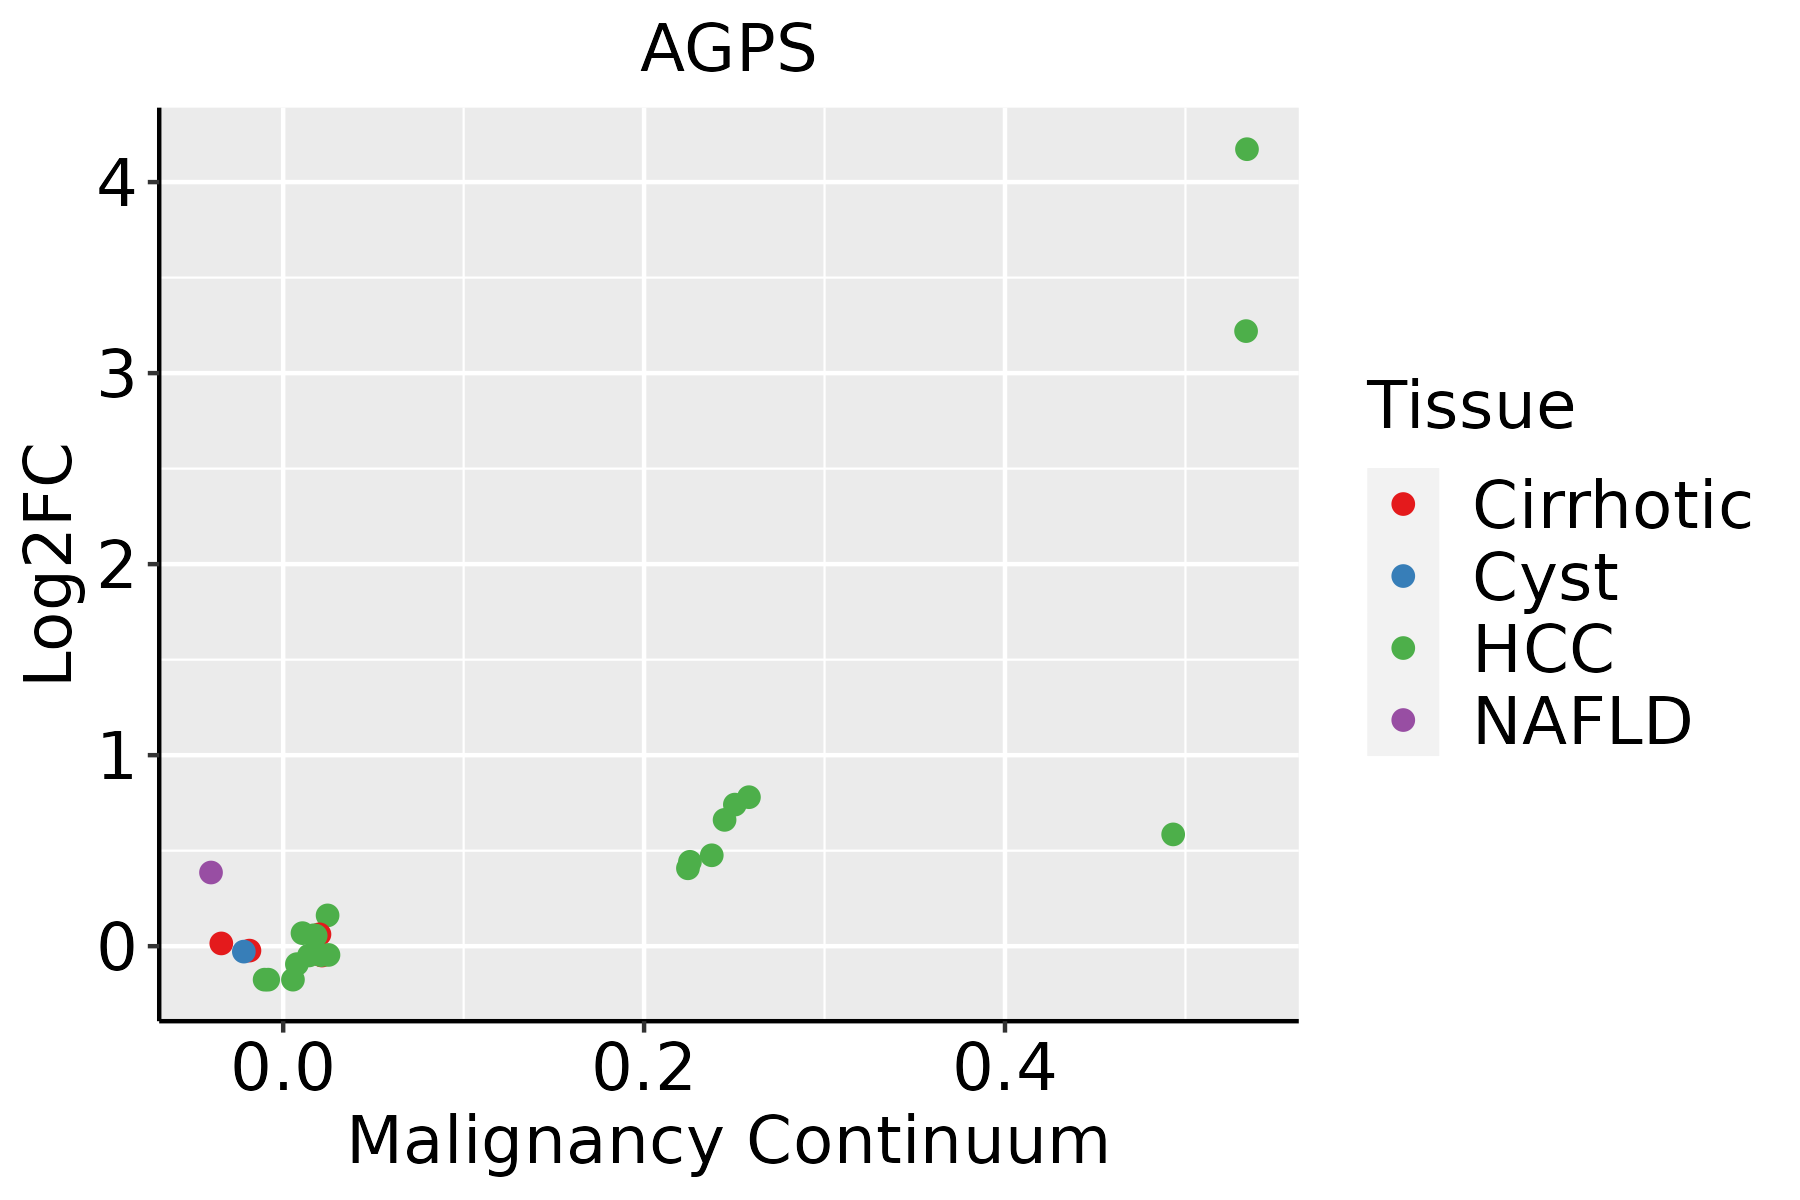 | HCC: Hepatocellular carcinoma |
| NAFLD: Non-alcoholic fatty liver disease | ||
| Oral Cavity | 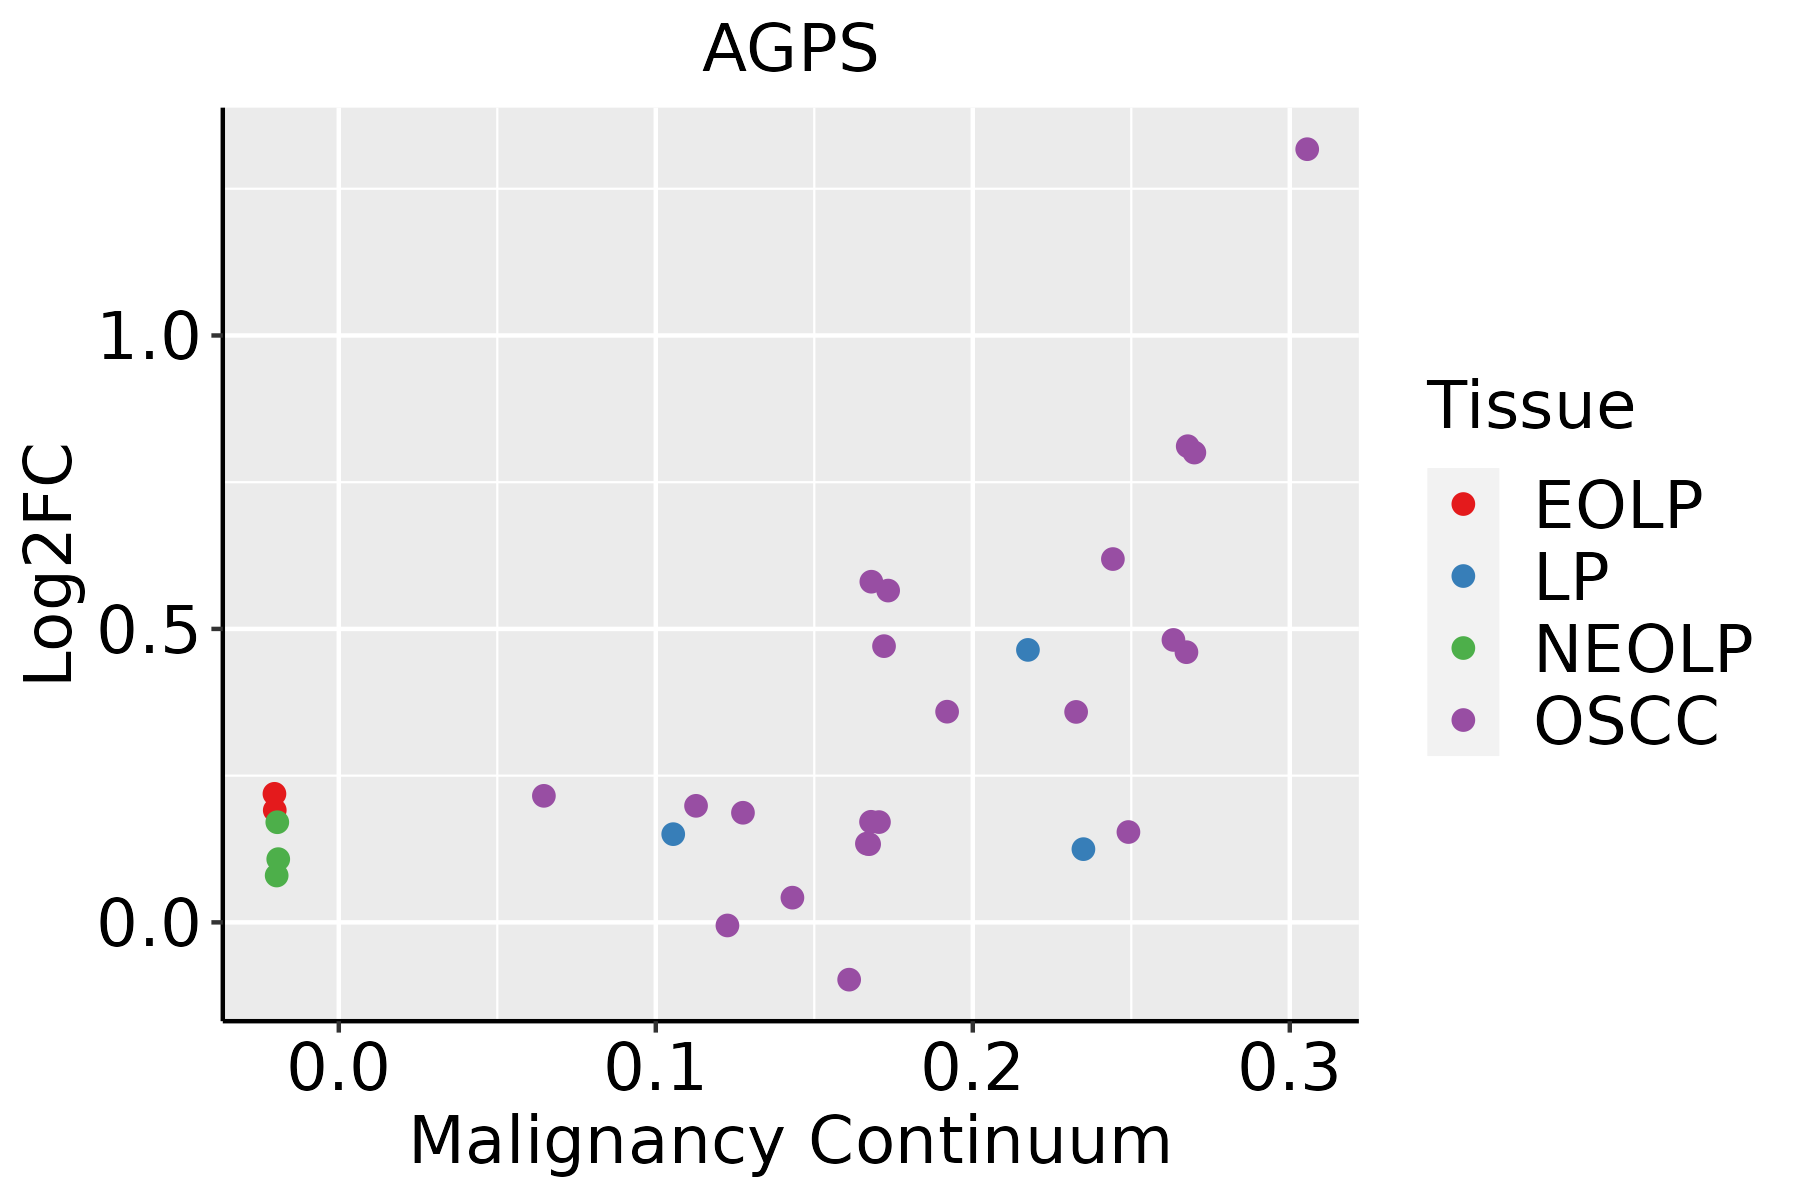 | EOLP: Erosive Oral lichen planus |
| LP: leukoplakia | ||
| NEOLP: Non-erosive oral lichen planus | ||
| OSCC: Oral squamous cell carcinoma | ||
| Skin | 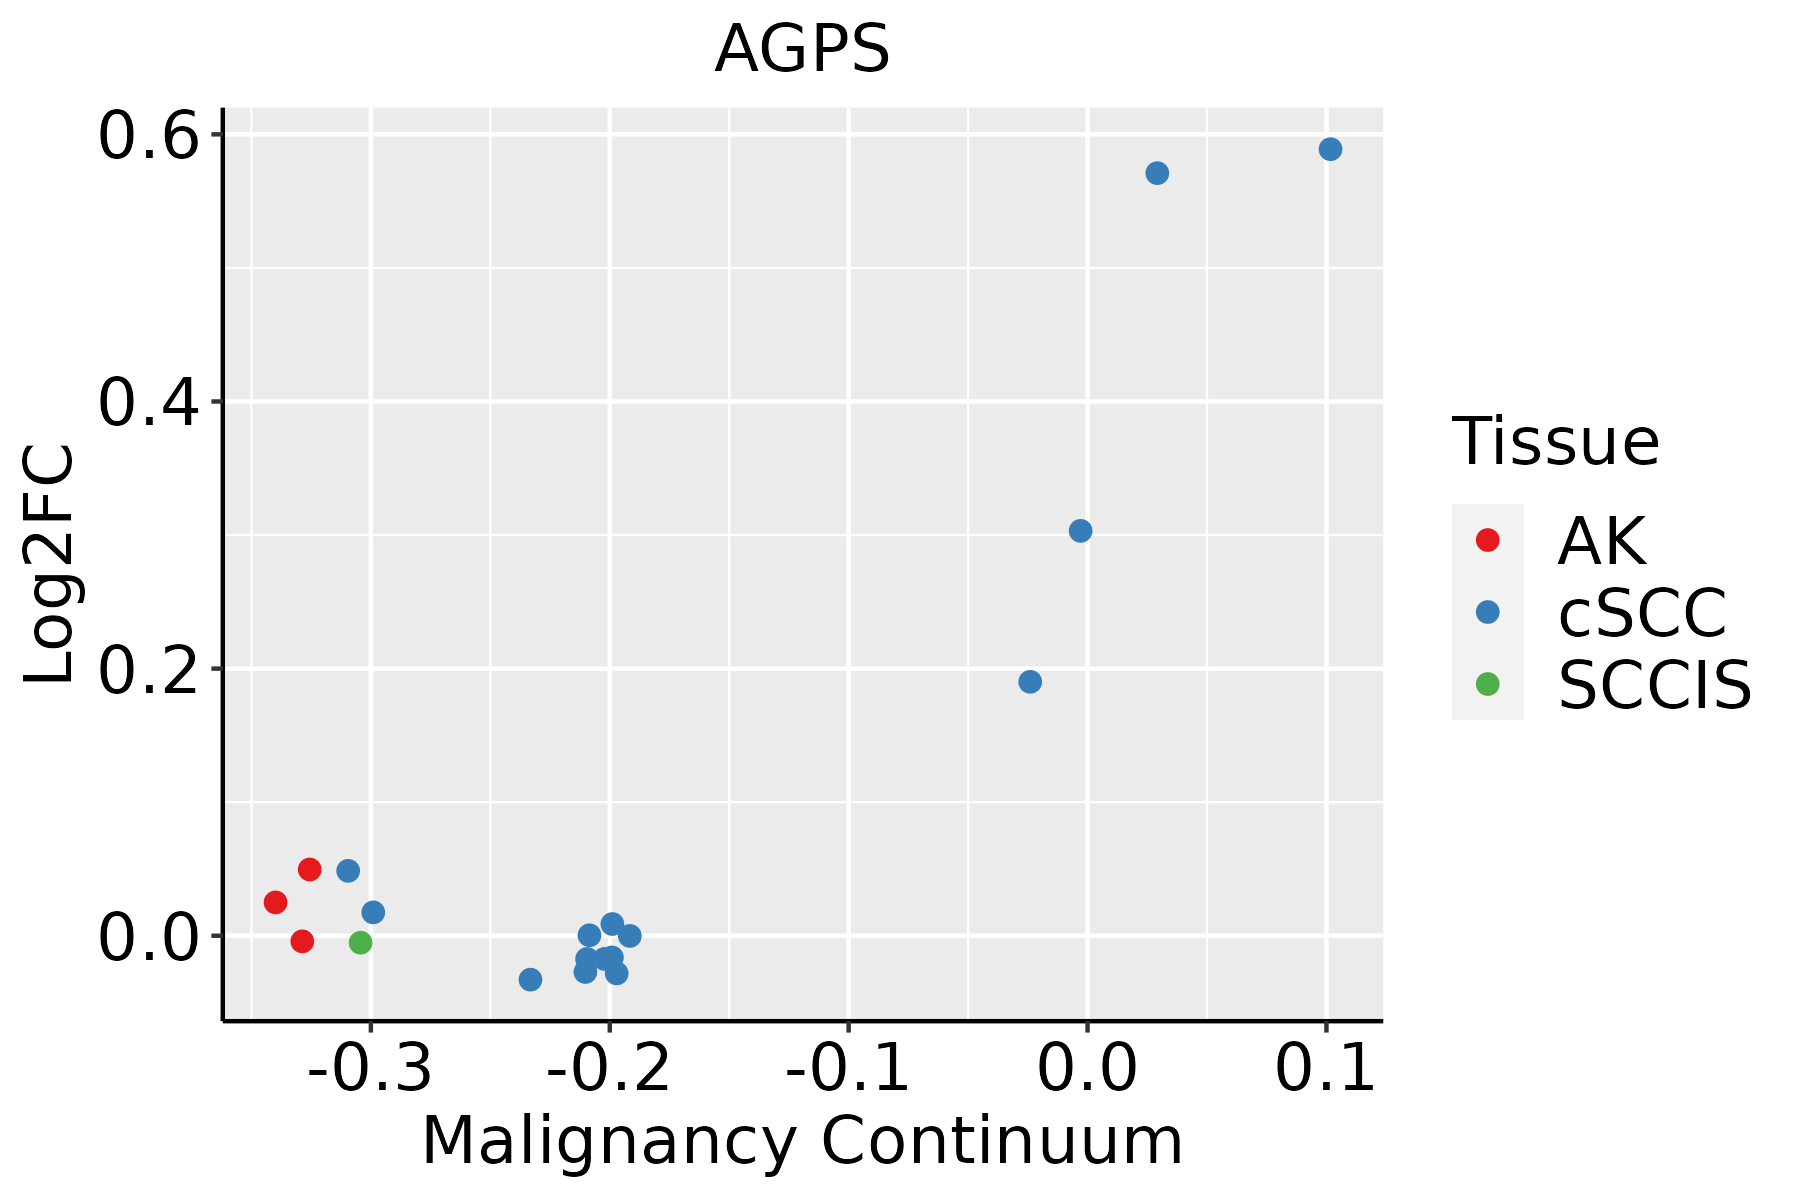 | AK: Actinic keratosis |
| cSCC: Cutaneous squamous cell carcinoma | ||
| SCCIS:squamous cell carcinoma in situ | ||
| Thyroid | 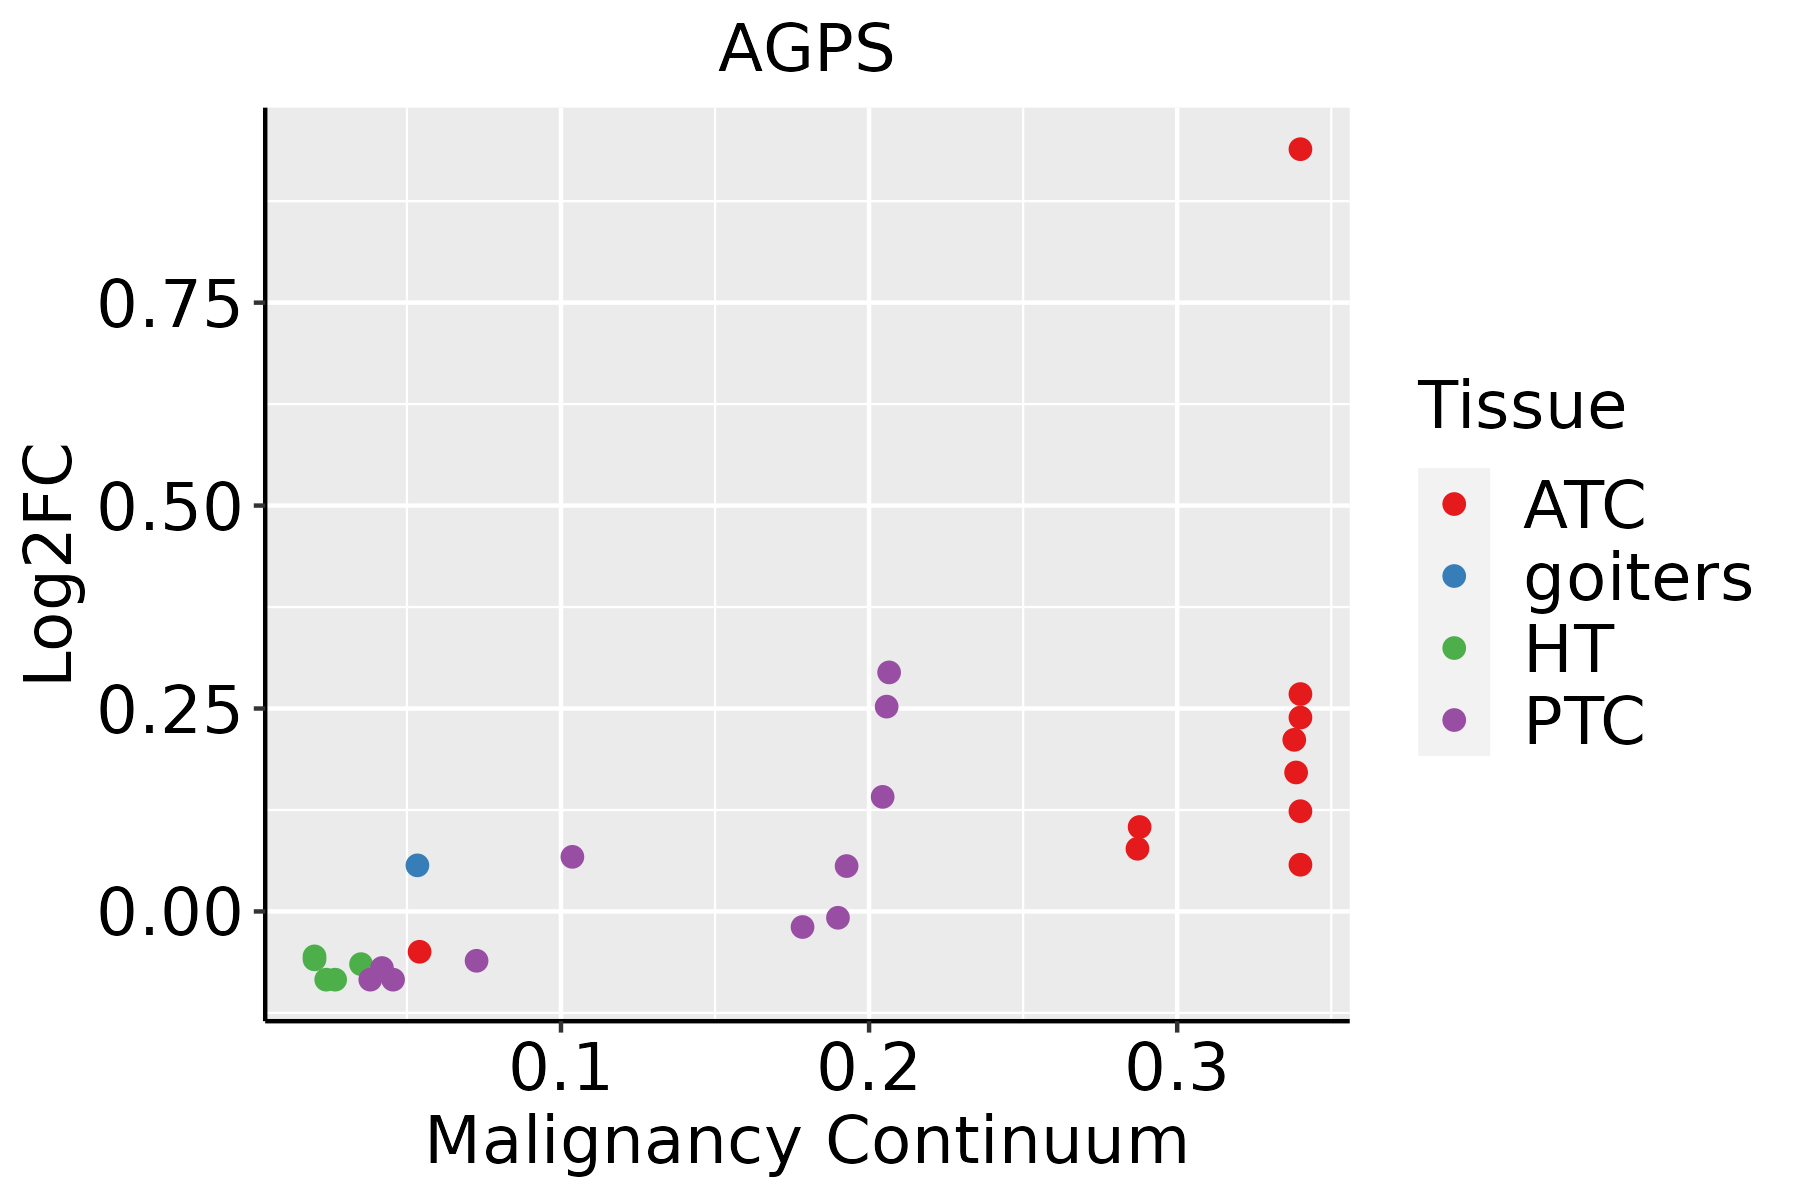 | ATC: Anaplastic thyroid cancer |
| HT: Hashimoto's thyroiditis | ||
| PTC: Papillary thyroid cancer |
| ∗log2FC in expression of this searched gene in stem-like cells from each diseased tissue sample relative to stem-like cells in normal samples in each tissue plotted against the malignancy continuum. Samples are colored based on if they are from different disease stage. |
Top |
Malignant transformation related pathway analysis |
| Find out the enriched GO biological processes and KEGG pathways involved in transition from healthy to precancer to cancer |
| Tissue | Disease Stage | Enriched GO biological Processes |
| Colorectum | AD |  |
| Colorectum | SER |  |
| Colorectum | MSS |  |
| Colorectum | MSI-H |  |
| Colorectum | FAP |  |
| ∗Top 15 enriched GO BP terms are showed in the bar plot of each disease state in each tissue. Each row represents a significant GO biological process which is colored according to the -log10(p.adjust). |
| Page: 1 2 3 4 5 6 7 8 9 |
| GO ID | Tissue | Disease Stage | Description | Gene Ratio | Bg Ratio | pvalue | p.adjust | Count |
| GO:0018904 | Colorectum | AD | ether metabolic process | 14/3918 | 27/18723 | 3.72e-04 | 4.29e-03 | 14 |
| GO:0006662 | Colorectum | AD | glycerol ether metabolic process | 12/3918 | 22/18723 | 5.38e-04 | 5.74e-03 | 12 |
| GO:0046485 | Colorectum | AD | ether lipid metabolic process | 10/3918 | 20/18723 | 3.67e-03 | 2.60e-02 | 10 |
| GO:00189042 | Colorectum | FAP | ether metabolic process | 10/2622 | 27/18723 | 2.46e-03 | 1.95e-02 | 10 |
| GO:00066622 | Colorectum | FAP | glycerol ether metabolic process | 8/2622 | 22/18723 | 7.51e-03 | 4.47e-02 | 8 |
| GO:00464851 | Colorectum | CRC | ether lipid metabolic process | 7/2078 | 20/18723 | 4.30e-03 | 3.47e-02 | 7 |
| GO:00189043 | Colorectum | CRC | ether metabolic process | 8/2078 | 27/18723 | 7.26e-03 | 4.98e-02 | 8 |
| GO:0008611 | Oral cavity | LP | ether lipid biosynthetic process | 7/4623 | 11/18723 | 7.01e-03 | 3.96e-02 | 7 |
| GO:0046504 | Oral cavity | LP | glycerol ether biosynthetic process | 7/4623 | 11/18723 | 7.01e-03 | 3.96e-02 | 7 |
| GO:0097384 | Oral cavity | LP | cellular lipid biosynthetic process | 7/4623 | 11/18723 | 7.01e-03 | 3.96e-02 | 7 |
| Page: 1 |
| Pathway ID | Tissue | Disease Stage | Description | Gene Ratio | Bg Ratio | pvalue | p.adjust | qvalue | Count |
| hsa041467 | Esophagus | ESCC | Peroxisome | 55/4205 | 82/8465 | 1.04e-03 | 3.27e-03 | 1.68e-03 | 55 |
| hsa0414612 | Esophagus | ESCC | Peroxisome | 55/4205 | 82/8465 | 1.04e-03 | 3.27e-03 | 1.68e-03 | 55 |
| hsa04146 | Liver | NAFLD | Peroxisome | 19/1043 | 82/8465 | 4.37e-03 | 4.10e-02 | 3.30e-02 | 19 |
| hsa041461 | Liver | NAFLD | Peroxisome | 19/1043 | 82/8465 | 4.37e-03 | 4.10e-02 | 3.30e-02 | 19 |
| hsa041462 | Liver | Cirrhotic | Peroxisome | 36/2530 | 82/8465 | 4.79e-03 | 1.74e-02 | 1.07e-02 | 36 |
| hsa041463 | Liver | Cirrhotic | Peroxisome | 36/2530 | 82/8465 | 4.79e-03 | 1.74e-02 | 1.07e-02 | 36 |
| hsa041464 | Liver | HCC | Peroxisome | 58/4020 | 82/8465 | 1.57e-05 | 1.05e-04 | 5.85e-05 | 58 |
| hsa041465 | Liver | HCC | Peroxisome | 58/4020 | 82/8465 | 1.57e-05 | 1.05e-04 | 5.85e-05 | 58 |
| hsa041466 | Oral cavity | OSCC | Peroxisome | 47/3704 | 82/8465 | 9.01e-03 | 2.01e-02 | 1.03e-02 | 47 |
| hsa0414611 | Oral cavity | OSCC | Peroxisome | 47/3704 | 82/8465 | 9.01e-03 | 2.01e-02 | 1.03e-02 | 47 |
| hsa0414621 | Oral cavity | LP | Peroxisome | 33/2418 | 82/8465 | 1.48e-02 | 4.69e-02 | 3.03e-02 | 33 |
| hsa0414631 | Oral cavity | LP | Peroxisome | 33/2418 | 82/8465 | 1.48e-02 | 4.69e-02 | 3.03e-02 | 33 |
| Page: 1 |
Top |
Cell-cell communication analysis |
| Identification of potential cell-cell interactions between two cell types and their ligand-receptor pairs for different disease states |
| Ligand | Receptor | LRpair | Pathway | Tissue | Disease Stage |
| Page: 1 |
Top |
Single-cell gene regulatory network inference analysis |
| Find out the significant the regulons (TFs) and the target genes of each regulon across cell types for different disease states |
| TF | Cell Type | Tissue | Disease Stage | Target Gene | RSS | Regulon Activity |
| ∗The dot plots of a searched regulon are shown for all cell subpopulations in each disease state of each tissue based on the regulon specific score inferred using pySCENIC and by calculating the average expression. |
| Page: 1 |
Top |
Somatic mutation of malignant transformation related genes |
| Annotation of somatic variants for genes involved in malignant transformation |
| Hugo Symbol | Variant Class | Variant Classification | dbSNP RS | HGVSc | HGVSp | HGVSp Short | SWISSPROT | BIOTYPE | SIFT | PolyPhen | Tumor Sample Barcode | Tissue | Histology | Sex | Age | Stage | Therapy Types | Drugs | Outcome |
| AGPS | SNV | Missense_Mutation | novel | c.215C>T | p.Thr72Met | p.T72M | O00116 | protein_coding | tolerated(0.13) | benign(0.003) | TCGA-5L-AAT1-01 | Breast | breast invasive carcinoma | Female | <65 | III/IV | Hormone Therapy | letrozol | SD |
| AGPS | SNV | Missense_Mutation | c.460N>A | p.Asp154Asn | p.D154N | O00116 | protein_coding | tolerated(0.37) | benign(0.015) | TCGA-A2-A0CX-01 | Breast | breast invasive carcinoma | Female | <65 | I/II | Chemotherapy | adriamycin | SD | |
| AGPS | SNV | Missense_Mutation | c.603N>A | p.Met201Ile | p.M201I | O00116 | protein_coding | tolerated(0.16) | benign(0) | TCGA-D8-A1JK-01 | Breast | breast invasive carcinoma | Female | >=65 | I/II | Unknown | Unknown | SD | |
| AGPS | SNV | Missense_Mutation | novel | c.963N>A | p.Met321Ile | p.M321I | O00116 | protein_coding | deleterious(0.02) | benign(0.35) | TCGA-4J-AA1J-01 | Cervix | cervical & endocervical cancer | Female | <65 | I/II | Unknown | Unknown | SD |
| AGPS | SNV | Missense_Mutation | c.1294C>G | p.Leu432Val | p.L432V | O00116 | protein_coding | deleterious(0.02) | possibly_damaging(0.794) | TCGA-EK-A2R7-01 | Cervix | cervical & endocervical cancer | Female | <65 | I/II | Unknown | Unknown | SD | |
| AGPS | SNV | Missense_Mutation | c.559C>T | p.His187Tyr | p.H187Y | O00116 | protein_coding | deleterious(0) | probably_damaging(0.994) | TCGA-FU-A3HY-01 | Cervix | cervical & endocervical cancer | Female | <65 | I/II | Chemotherapy | cisplatin | CR | |
| AGPS | SNV | Missense_Mutation | novel | c.1534G>A | p.Ala512Thr | p.A512T | O00116 | protein_coding | deleterious(0) | probably_damaging(0.998) | TCGA-VS-A9UV-01 | Cervix | cervical & endocervical cancer | Female | >=65 | I/II | Unknown | Unknown | PD |
| AGPS | SNV | Missense_Mutation | c.1259T>G | p.Leu420Arg | p.L420R | O00116 | protein_coding | deleterious(0) | probably_damaging(0.991) | TCGA-AA-3710-01 | Colorectum | colon adenocarcinoma | Female | >=65 | I/II | Unknown | Unknown | SD | |
| AGPS | SNV | Missense_Mutation | c.990N>T | p.Glu330Asp | p.E330D | O00116 | protein_coding | deleterious(0.03) | possibly_damaging(0.562) | TCGA-AA-A010-01 | Colorectum | colon adenocarcinoma | Female | <65 | I/II | Chemotherapy | folinic | CR | |
| AGPS | SNV | Missense_Mutation | c.545N>A | p.Arg182Gln | p.R182Q | O00116 | protein_coding | deleterious(0) | probably_damaging(1) | TCGA-CA-6717-01 | Colorectum | colon adenocarcinoma | Male | <65 | I/II | Chemotherapy | oxaliplatin | CR |
| Page: 1 2 3 4 5 6 7 |
Top |
Related drugs of malignant transformation related genes |
| Identification of chemicals and drugs interact with genes involved in malignant transfromation |
| (DGIdb 4.0) |
| Entrez ID | Symbol | Category | Interaction Types | Drug Claim Name | Drug Name | PMIDs |
| Page: 1 |

Copyright 2023-Present -The University of Texas Health Science Center at Houston |