
|
|||||
|
 | |
| |
| |
| |
| |
| |
|
Gene: AGPAT5 |
Gene summary for AGPAT5 |
| Gene information | Species | Human | Gene symbol | AGPAT5 | Gene ID | 55326 |
| Gene name | 1-acylglycerol-3-phosphate O-acyltransferase 5 | |
| Gene Alias | 1AGPAT5 | |
| Cytomap | 8p23.1 | |
| Gene Type | protein-coding | GO ID | GO:0002244 | UniProtAcc | A0A024R640 |
Top |
Malignant transformation analysis |
| Identification of the aberrant gene expression in precancerous and cancerous lesions by comparing the gene expression of stem-like cells in diseased tissues with normal stem cells |
| Entrez ID | Symbol | Replicates | Species | Organ | Tissue | Adj P-value | Log2FC | Malignancy |
| 55326 | AGPAT5 | HTA11_3410_2000001011 | Human | Colorectum | AD | 2.57e-08 | -4.73e-01 | 0.0155 |
| 55326 | AGPAT5 | HTA11_2487_2000001011 | Human | Colorectum | SER | 4.56e-03 | -4.48e-01 | -0.1808 |
| 55326 | AGPAT5 | HTA11_696_2000001011 | Human | Colorectum | AD | 1.20e-07 | -4.18e-01 | -0.1464 |
| 55326 | AGPAT5 | HTA11_866_2000001011 | Human | Colorectum | AD | 8.81e-09 | -4.00e-01 | -0.1001 |
| 55326 | AGPAT5 | HTA11_1391_2000001011 | Human | Colorectum | AD | 9.03e-03 | -4.15e-01 | -0.059 |
| 55326 | AGPAT5 | HTA11_866_3004761011 | Human | Colorectum | AD | 2.83e-05 | -4.16e-01 | 0.096 |
| 55326 | AGPAT5 | HTA11_10711_2000001011 | Human | Colorectum | AD | 2.31e-03 | -4.60e-01 | 0.0338 |
| 55326 | AGPAT5 | HTA11_7696_3000711011 | Human | Colorectum | AD | 9.40e-07 | -4.13e-01 | 0.0674 |
| 55326 | AGPAT5 | HTA11_99999974143_84620 | Human | Colorectum | MSS | 1.32e-03 | -3.59e-01 | 0.3005 |
| 55326 | AGPAT5 | A015-C-203 | Human | Colorectum | FAP | 1.59e-17 | -3.85e-01 | -0.1294 |
| 55326 | AGPAT5 | A014-C-040 | Human | Colorectum | FAP | 2.57e-03 | -5.12e-01 | -0.1184 |
| 55326 | AGPAT5 | A002-C-201 | Human | Colorectum | FAP | 2.66e-08 | -3.35e-01 | 0.0324 |
| 55326 | AGPAT5 | A002-C-203 | Human | Colorectum | FAP | 2.70e-03 | -1.82e-01 | 0.2786 |
| 55326 | AGPAT5 | A001-C-119 | Human | Colorectum | FAP | 4.90e-07 | -4.66e-01 | -0.1557 |
| 55326 | AGPAT5 | A001-C-108 | Human | Colorectum | FAP | 8.86e-12 | -3.18e-01 | -0.0272 |
| 55326 | AGPAT5 | A002-C-205 | Human | Colorectum | FAP | 1.94e-14 | -4.74e-01 | -0.1236 |
| 55326 | AGPAT5 | A001-C-104 | Human | Colorectum | FAP | 1.31e-03 | -2.30e-01 | 0.0184 |
| 55326 | AGPAT5 | A015-C-005 | Human | Colorectum | FAP | 5.06e-06 | -4.17e-01 | -0.0336 |
| 55326 | AGPAT5 | A015-C-006 | Human | Colorectum | FAP | 2.10e-08 | -4.21e-01 | -0.0994 |
| 55326 | AGPAT5 | A015-C-106 | Human | Colorectum | FAP | 3.19e-13 | -3.50e-01 | -0.0511 |
| Page: 1 2 3 4 5 6 |
| Tissue | Expression Dynamics | Abbreviation |
| Colorectum (GSE201348) |  | FAP: Familial adenomatous polyposis |
| CRC: Colorectal cancer | ||
| Colorectum (HTA11) |  | AD: Adenomas |
| SER: Sessile serrated lesions | ||
| MSI-H: Microsatellite-high colorectal cancer | ||
| MSS: Microsatellite stable colorectal cancer | ||
| Esophagus |  | ESCC: Esophageal squamous cell carcinoma |
| HGIN: High-grade intraepithelial neoplasias | ||
| LGIN: Low-grade intraepithelial neoplasias | ||
| Liver | 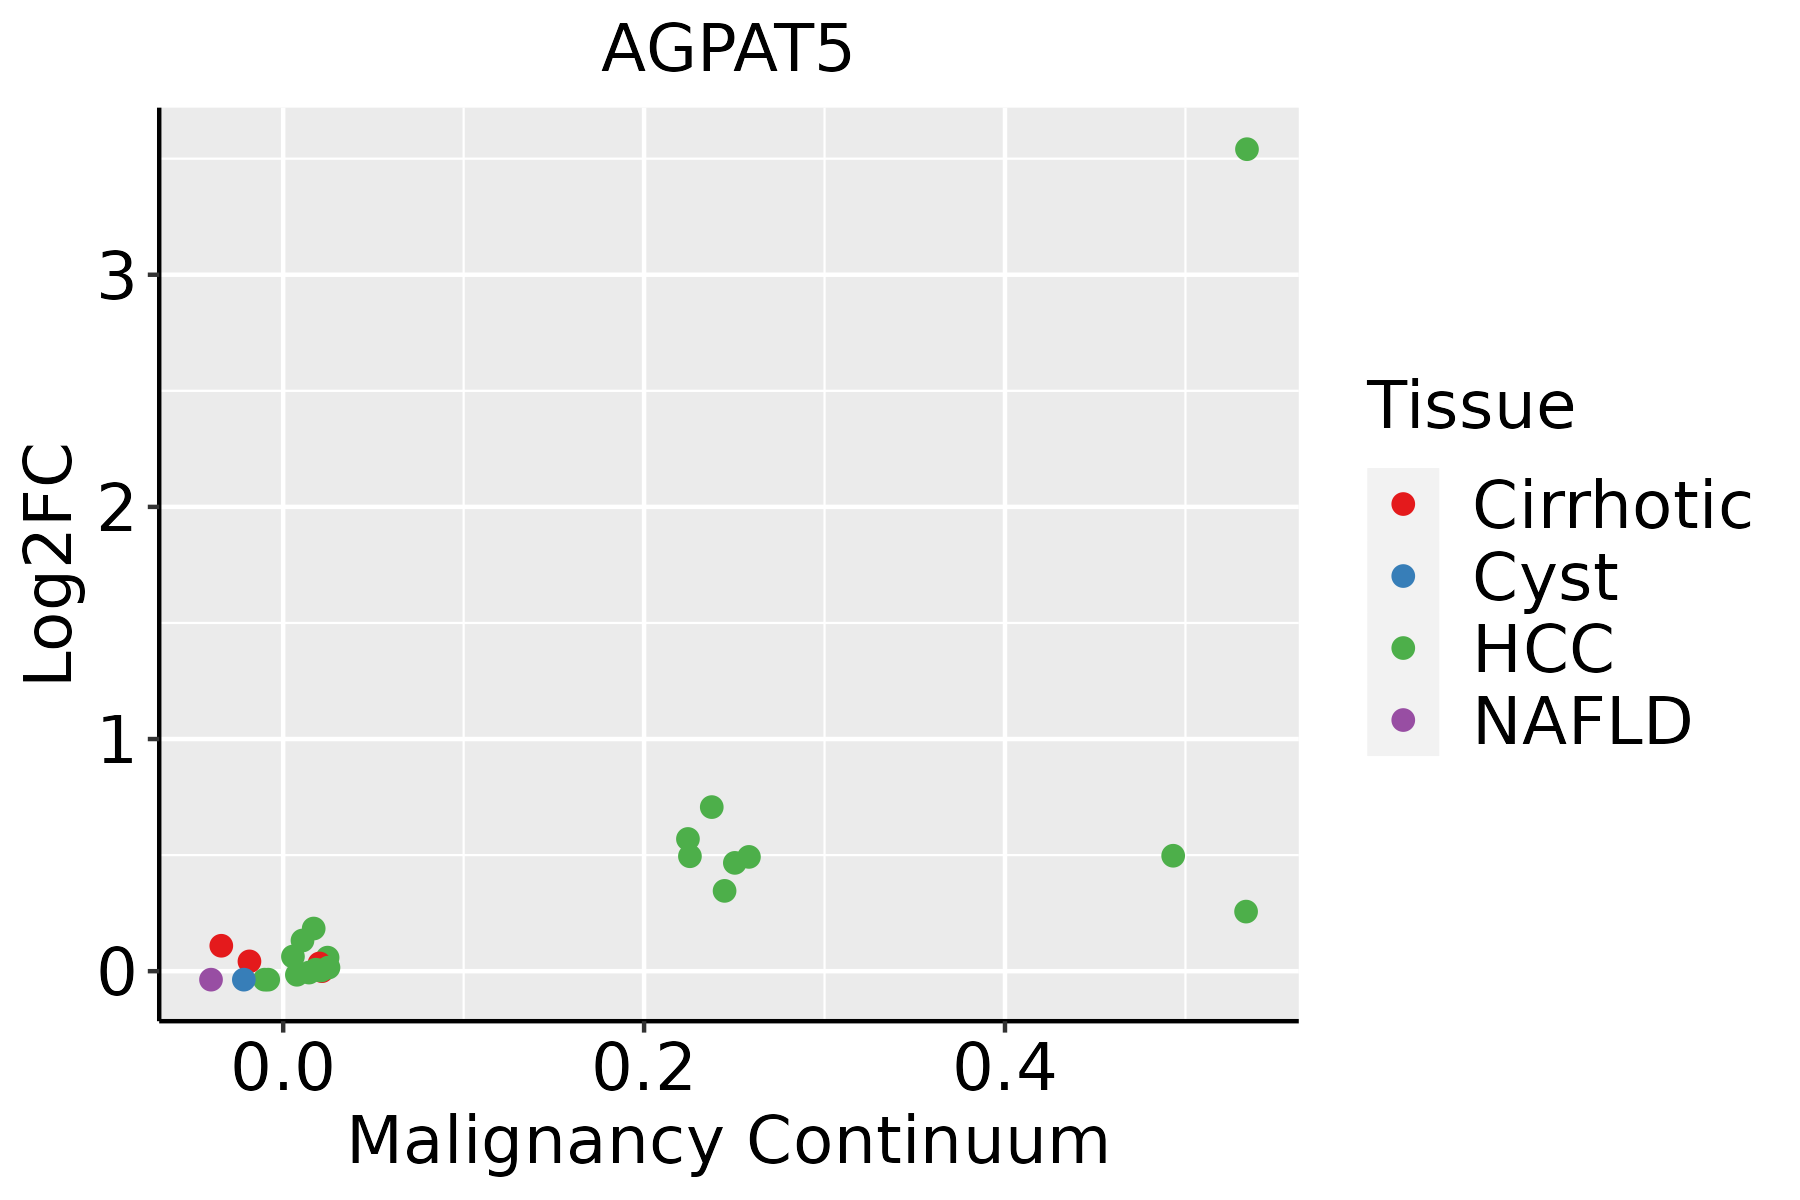 | HCC: Hepatocellular carcinoma |
| NAFLD: Non-alcoholic fatty liver disease | ||
| Skin | 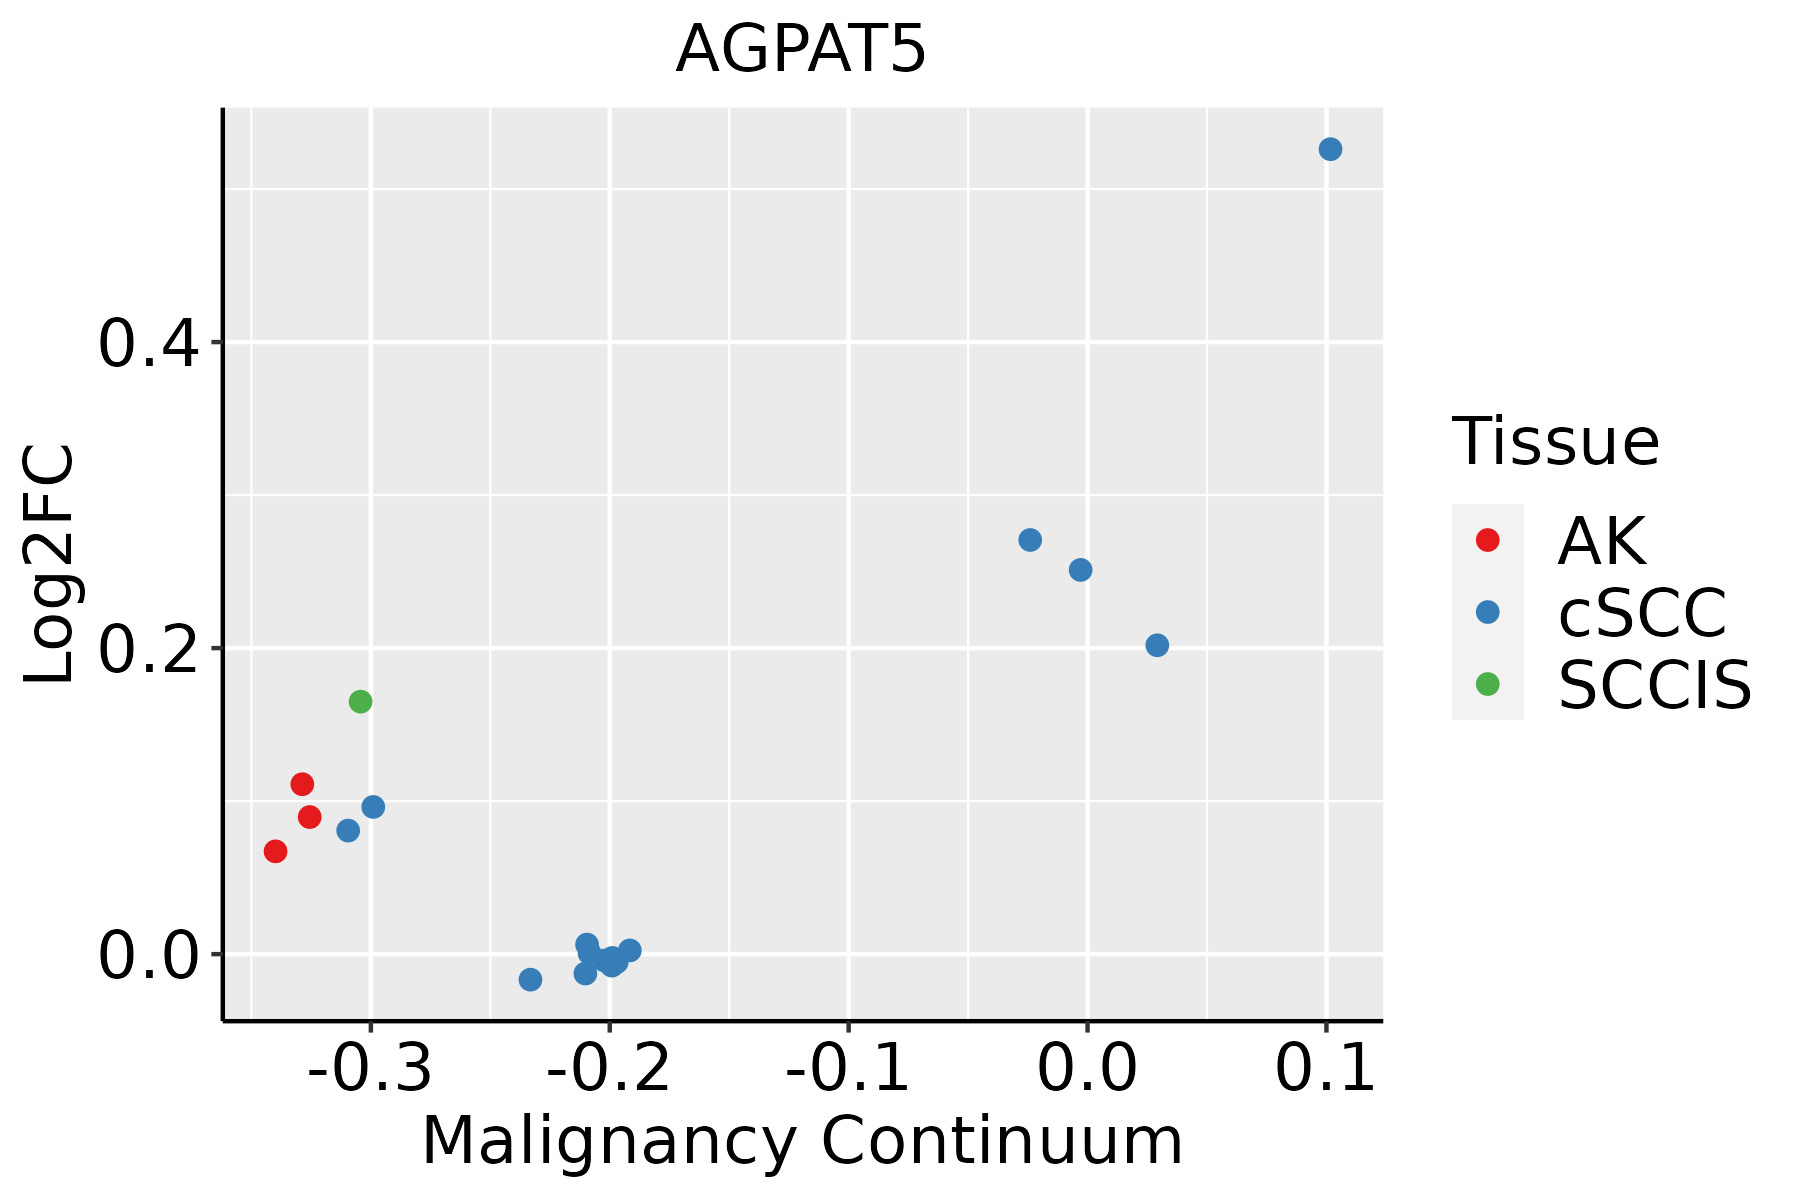 | AK: Actinic keratosis |
| cSCC: Cutaneous squamous cell carcinoma | ||
| SCCIS:squamous cell carcinoma in situ | ||
| Thyroid | 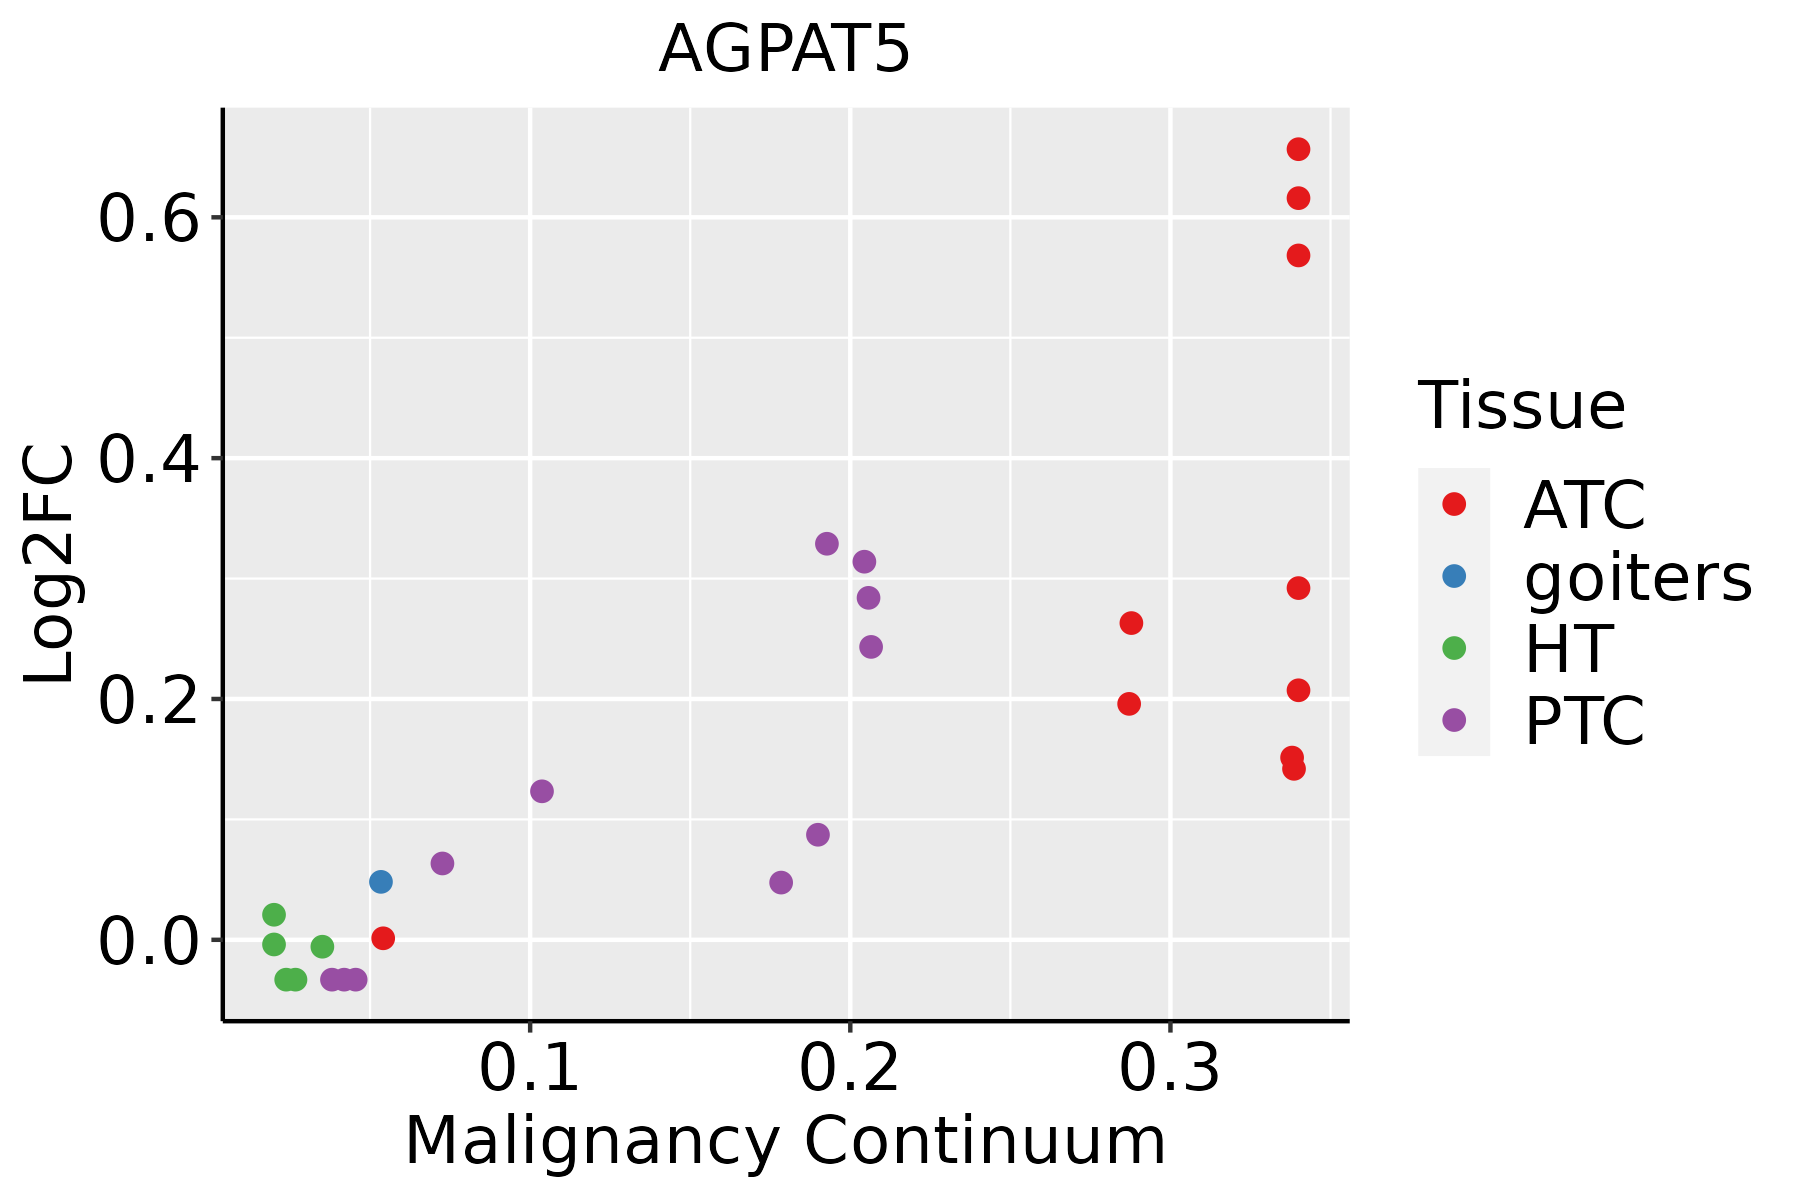 | ATC: Anaplastic thyroid cancer |
| HT: Hashimoto's thyroiditis | ||
| PTC: Papillary thyroid cancer |
| ∗log2FC in expression of this searched gene in stem-like cells from each diseased tissue sample relative to stem-like cells in normal samples in each tissue plotted against the malignancy continuum. Samples are colored based on if they are from different disease stage. |
Top |
Malignant transformation related pathway analysis |
| Find out the enriched GO biological processes and KEGG pathways involved in transition from healthy to precancer to cancer |
| Tissue | Disease Stage | Enriched GO biological Processes |
| Colorectum | AD |  |
| Colorectum | SER |  |
| Colorectum | MSS |  |
| Colorectum | MSI-H |  |
| Colorectum | FAP |  |
| ∗Top 15 enriched GO BP terms are showed in the bar plot of each disease state in each tissue. Each row represents a significant GO biological process which is colored according to the -log10(p.adjust). |
| Page: 1 2 3 4 5 6 7 8 9 |
| GO ID | Tissue | Disease Stage | Description | Gene Ratio | Bg Ratio | pvalue | p.adjust | Count |
| GO:0006650 | Colorectum | AD | glycerophospholipid metabolic process | 83/3918 | 306/18723 | 5.40e-03 | 3.55e-02 | 83 |
| GO:0006644 | Colorectum | AD | phospholipid metabolic process | 101/3918 | 383/18723 | 5.80e-03 | 3.67e-02 | 101 |
| GO:0045017 | Colorectum | AD | glycerolipid biosynthetic process | 69/3918 | 252/18723 | 8.33e-03 | 4.88e-02 | 69 |
| GO:0046486 | Colorectum | SER | glycerolipid metabolic process | 82/2897 | 392/18723 | 2.26e-03 | 2.17e-02 | 82 |
| GO:00066441 | Colorectum | SER | phospholipid metabolic process | 79/2897 | 383/18723 | 3.94e-03 | 3.24e-02 | 79 |
| GO:00450171 | Colorectum | SER | glycerolipid biosynthetic process | 55/2897 | 252/18723 | 4.47e-03 | 3.56e-02 | 55 |
| GO:00066501 | Colorectum | SER | glycerophospholipid metabolic process | 64/2897 | 306/18723 | 6.41e-03 | 4.60e-02 | 64 |
| GO:0002244 | Colorectum | MSS | hematopoietic progenitor cell differentiation | 32/3467 | 114/18723 | 8.07e-03 | 4.91e-02 | 32 |
| GO:00022441 | Colorectum | FAP | hematopoietic progenitor cell differentiation | 29/2622 | 114/18723 | 8.35e-04 | 8.71e-03 | 29 |
| GO:0008654 | Colorectum | FAP | phospholipid biosynthetic process | 54/2622 | 253/18723 | 8.88e-04 | 9.08e-03 | 54 |
| GO:00066502 | Colorectum | FAP | glycerophospholipid metabolic process | 62/2622 | 306/18723 | 1.54e-03 | 1.38e-02 | 62 |
| GO:00066442 | Colorectum | FAP | phospholipid metabolic process | 74/2622 | 383/18723 | 2.24e-03 | 1.83e-02 | 74 |
| GO:0046473 | Colorectum | FAP | phosphatidic acid metabolic process | 12/2622 | 37/18723 | 3.43e-03 | 2.48e-02 | 12 |
| GO:0046474 | Colorectum | FAP | glycerophospholipid biosynthetic process | 44/2622 | 211/18723 | 3.98e-03 | 2.76e-02 | 44 |
| GO:00450172 | Colorectum | FAP | glycerolipid biosynthetic process | 50/2622 | 252/18723 | 6.32e-03 | 3.95e-02 | 50 |
| GO:00086541 | Colorectum | CRC | phospholipid biosynthetic process | 49/2078 | 253/18723 | 7.07e-05 | 1.51e-03 | 49 |
| GO:00066503 | Colorectum | CRC | glycerophospholipid metabolic process | 55/2078 | 306/18723 | 2.10e-04 | 3.55e-03 | 55 |
| GO:00450173 | Colorectum | CRC | glycerolipid biosynthetic process | 47/2078 | 252/18723 | 2.47e-04 | 4.06e-03 | 47 |
| GO:00066443 | Colorectum | CRC | phospholipid metabolic process | 65/2078 | 383/18723 | 3.21e-04 | 4.95e-03 | 65 |
| GO:00464741 | Colorectum | CRC | glycerophospholipid biosynthetic process | 40/2078 | 211/18723 | 4.91e-04 | 7.02e-03 | 40 |
| Page: 1 2 3 |
| Pathway ID | Tissue | Disease Stage | Description | Gene Ratio | Bg Ratio | pvalue | p.adjust | qvalue | Count |
| hsa005612 | Colorectum | MSS | Glycerolipid metabolism | 23/1875 | 63/8465 | 6.55e-03 | 2.64e-02 | 1.62e-02 | 23 |
| hsa005613 | Colorectum | MSS | Glycerolipid metabolism | 23/1875 | 63/8465 | 6.55e-03 | 2.64e-02 | 1.62e-02 | 23 |
| hsa005615 | Liver | HCC | Glycerolipid metabolism | 41/4020 | 63/8465 | 3.59e-03 | 1.12e-02 | 6.22e-03 | 41 |
| hsa0056112 | Liver | HCC | Glycerolipid metabolism | 41/4020 | 63/8465 | 3.59e-03 | 1.12e-02 | 6.22e-03 | 41 |
| Page: 1 |
Top |
Cell-cell communication analysis |
| Identification of potential cell-cell interactions between two cell types and their ligand-receptor pairs for different disease states |
| Ligand | Receptor | LRpair | Pathway | Tissue | Disease Stage |
| Page: 1 |
Top |
Single-cell gene regulatory network inference analysis |
| Find out the significant the regulons (TFs) and the target genes of each regulon across cell types for different disease states |
| TF | Cell Type | Tissue | Disease Stage | Target Gene | RSS | Regulon Activity |
| ∗The dot plots of a searched regulon are shown for all cell subpopulations in each disease state of each tissue based on the regulon specific score inferred using pySCENIC and by calculating the average expression. |
| Page: 1 |
Top |
Somatic mutation of malignant transformation related genes |
| Annotation of somatic variants for genes involved in malignant transformation |
| Hugo Symbol | Variant Class | Variant Classification | dbSNP RS | HGVSc | HGVSp | HGVSp Short | SWISSPROT | BIOTYPE | SIFT | PolyPhen | Tumor Sample Barcode | Tissue | Histology | Sex | Age | Stage | Therapy Types | Drugs | Outcome |
| AGPAT5 | SNV | Missense_Mutation | novel | c.170T>G | p.Val57Gly | p.V57G | Q9NUQ2 | protein_coding | deleterious(0.02) | benign(0.03) | TCGA-A2-A0YC-01 | Breast | breast invasive carcinoma | Female | <65 | I/II | Hormone Therapy | arimidex | PD |
| AGPAT5 | SNV | Missense_Mutation | c.908N>A | p.Arg303Lys | p.R303K | Q9NUQ2 | protein_coding | tolerated(0.7) | benign(0.001) | TCGA-IR-A3LK-01 | Cervix | cervical & endocervical cancer | Female | >=65 | I/II | Chemotherapy | cisplatin | PD | |
| AGPAT5 | SNV | Missense_Mutation | c.885N>G | p.Phe295Leu | p.F295L | Q9NUQ2 | protein_coding | deleterious(0.01) | possibly_damaging(0.729) | TCGA-AG-3892-01 | Colorectum | rectum adenocarcinoma | Female | <65 | I/II | Unknown | Unknown | SD | |
| AGPAT5 | SNV | Missense_Mutation | novel | c.935N>G | p.Val312Gly | p.V312G | Q9NUQ2 | protein_coding | tolerated(0.37) | benign(0.04) | TCGA-F5-6814-01 | Colorectum | rectum adenocarcinoma | Male | <65 | I/II | Unknown | Unknown | SD |
| AGPAT5 | deletion | Frame_Shift_Del | c.248delA | p.Asn83IlefsTer5 | p.N83Ifs*5 | Q9NUQ2 | protein_coding | TCGA-D5-6540-01 | Colorectum | colon adenocarcinoma | Male | >=65 | I/II | Unknown | Unknown | SD | |||
| AGPAT5 | SNV | Missense_Mutation | novel | c.205T>G | p.Tyr69Asp | p.Y69D | Q9NUQ2 | protein_coding | deleterious(0.02) | benign(0.298) | TCGA-A5-A2K5-01 | Endometrium | uterine corpus endometrioid carcinoma | Female | >=65 | I/II | Unknown | Unknown | SD |
| AGPAT5 | SNV | Missense_Mutation | rs765753866 | c.791N>A | p.Arg264His | p.R264H | Q9NUQ2 | protein_coding | deleterious(0.01) | benign(0.189) | TCGA-AP-A051-01 | Endometrium | uterine corpus endometrioid carcinoma | Female | >=65 | I/II | Unknown | Unknown | SD |
| AGPAT5 | SNV | Missense_Mutation | c.616N>T | p.Pro206Ser | p.P206S | Q9NUQ2 | protein_coding | deleterious(0) | probably_damaging(0.999) | TCGA-AP-A059-01 | Endometrium | uterine corpus endometrioid carcinoma | Female | >=65 | I/II | Unknown | Unknown | SD | |
| AGPAT5 | SNV | Missense_Mutation | rs141365320 | c.1063N>T | p.Leu355Phe | p.L355F | Q9NUQ2 | protein_coding | tolerated(0.29) | benign(0.015) | TCGA-AP-A0LM-01 | Endometrium | uterine corpus endometrioid carcinoma | Female | <65 | III/IV | Chemotherapy | cisplatin | SD |
| AGPAT5 | SNV | Missense_Mutation | novel | c.201N>T | p.Glu67Asp | p.E67D | Q9NUQ2 | protein_coding | deleterious(0) | possibly_damaging(0.452) | TCGA-AP-A1E0-01 | Endometrium | uterine corpus endometrioid carcinoma | Female | <65 | III/IV | Chemotherapy | paclitaxel | SD |
| Page: 1 2 3 |
Top |
Related drugs of malignant transformation related genes |
| Identification of chemicals and drugs interact with genes involved in malignant transfromation |
| (DGIdb 4.0) |
| Entrez ID | Symbol | Category | Interaction Types | Drug Claim Name | Drug Name | PMIDs |
| Page: 1 |

Copyright 2023-Present -The University of Texas Health Science Center at Houston |