
|
|||||
|
 | |
| |
| |
| |
| |
| |
|
Gene: AGPAT4 |
Gene summary for AGPAT4 |
| Gene information | Species | Human | Gene symbol | AGPAT4 | Gene ID | 56895 |
| Gene name | 1-acylglycerol-3-phosphate O-acyltransferase 4 | |
| Gene Alias | 1-AGPAT4 | |
| Cytomap | 6q26 | |
| Gene Type | protein-coding | GO ID | GO:0006629 | UniProtAcc | Q9NRZ5 |
Top |
Malignant transformation analysis |
| Identification of the aberrant gene expression in precancerous and cancerous lesions by comparing the gene expression of stem-like cells in diseased tissues with normal stem cells |
| Entrez ID | Symbol | Replicates | Species | Organ | Tissue | Adj P-value | Log2FC | Malignancy |
| 56895 | AGPAT4 | LZE8T | Human | Esophagus | ESCC | 1.88e-02 | 9.06e-02 | 0.067 |
| 56895 | AGPAT4 | P4T-E | Human | Esophagus | ESCC | 2.68e-05 | 9.85e-02 | 0.1323 |
| 56895 | AGPAT4 | P5T-E | Human | Esophagus | ESCC | 2.11e-06 | 5.27e-02 | 0.1327 |
| 56895 | AGPAT4 | P10T-E | Human | Esophagus | ESCC | 8.84e-05 | 1.06e-01 | 0.116 |
| 56895 | AGPAT4 | P11T-E | Human | Esophagus | ESCC | 8.62e-04 | 2.35e-01 | 0.1426 |
| 56895 | AGPAT4 | P12T-E | Human | Esophagus | ESCC | 1.80e-02 | 4.37e-02 | 0.1122 |
| 56895 | AGPAT4 | P15T-E | Human | Esophagus | ESCC | 2.53e-02 | 5.63e-02 | 0.1149 |
| 56895 | AGPAT4 | P16T-E | Human | Esophagus | ESCC | 4.44e-08 | 1.00e-01 | 0.1153 |
| 56895 | AGPAT4 | P19T-E | Human | Esophagus | ESCC | 3.49e-03 | 2.19e-01 | 0.1662 |
| 56895 | AGPAT4 | P21T-E | Human | Esophagus | ESCC | 1.02e-31 | 6.39e-01 | 0.1617 |
| 56895 | AGPAT4 | P23T-E | Human | Esophagus | ESCC | 4.61e-07 | 1.03e-01 | 0.108 |
| 56895 | AGPAT4 | P24T-E | Human | Esophagus | ESCC | 8.40e-04 | 9.20e-02 | 0.1287 |
| 56895 | AGPAT4 | P26T-E | Human | Esophagus | ESCC | 6.38e-31 | 5.44e-01 | 0.1276 |
| 56895 | AGPAT4 | P32T-E | Human | Esophagus | ESCC | 7.74e-11 | 2.49e-01 | 0.1666 |
| 56895 | AGPAT4 | P36T-E | Human | Esophagus | ESCC | 3.87e-03 | 1.87e-01 | 0.1187 |
| 56895 | AGPAT4 | P37T-E | Human | Esophagus | ESCC | 1.36e-21 | 4.79e-01 | 0.1371 |
| 56895 | AGPAT4 | P47T-E | Human | Esophagus | ESCC | 1.66e-02 | 4.48e-02 | 0.1067 |
| 56895 | AGPAT4 | P52T-E | Human | Esophagus | ESCC | 9.44e-07 | 1.51e-01 | 0.1555 |
| 56895 | AGPAT4 | P54T-E | Human | Esophagus | ESCC | 1.67e-02 | 5.00e-02 | 0.0975 |
| 56895 | AGPAT4 | P61T-E | Human | Esophagus | ESCC | 2.24e-03 | 6.71e-02 | 0.099 |
| Page: 1 2 |
| Tissue | Expression Dynamics | Abbreviation |
| Esophagus | 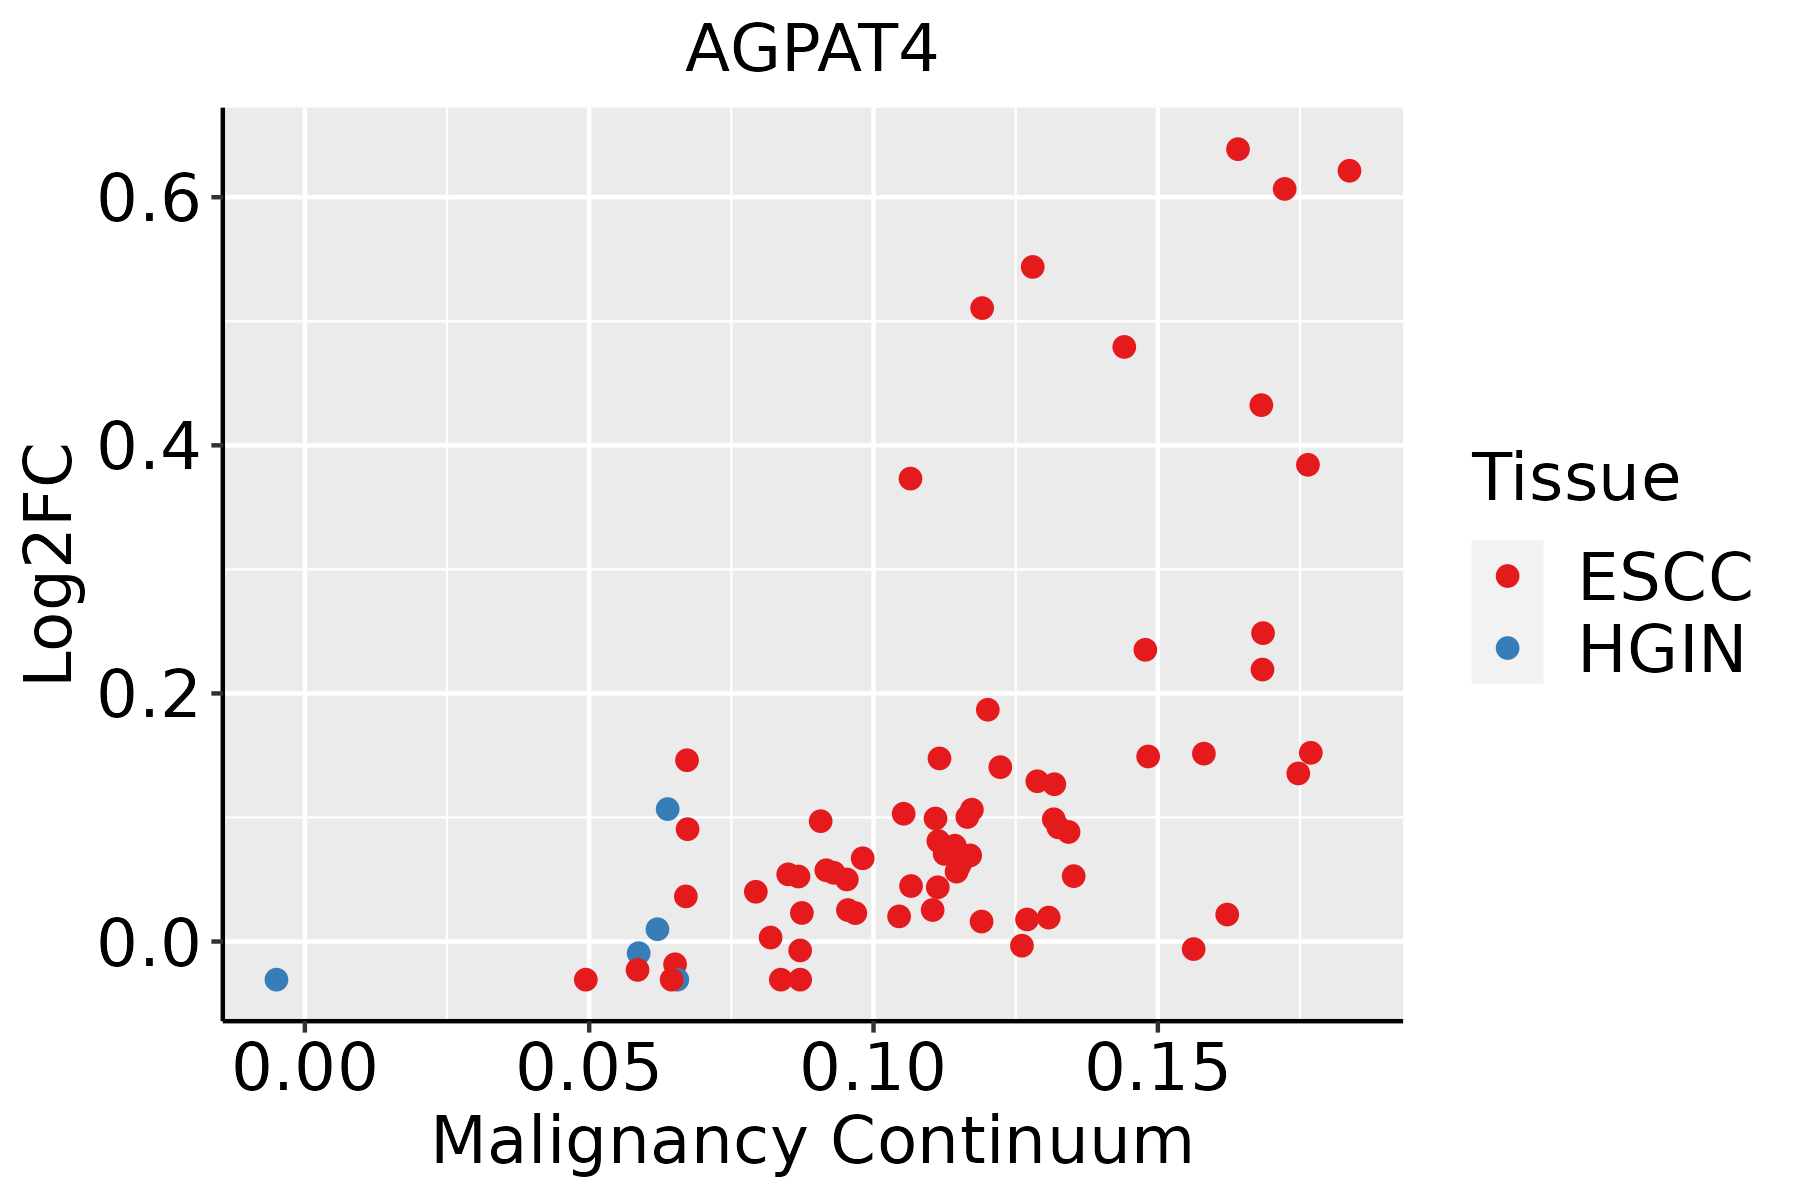 | ESCC: Esophageal squamous cell carcinoma |
| HGIN: High-grade intraepithelial neoplasias | ||
| LGIN: Low-grade intraepithelial neoplasias |
| ∗log2FC in expression of this searched gene in stem-like cells from each diseased tissue sample relative to stem-like cells in normal samples in each tissue plotted against the malignancy continuum. Samples are colored based on if they are from different disease stage. |
Top |
Malignant transformation related pathway analysis |
| Find out the enriched GO biological processes and KEGG pathways involved in transition from healthy to precancer to cancer |
| Tissue | Disease Stage | Enriched GO biological Processes |
| Colorectum | AD |  |
| Colorectum | SER |  |
| Colorectum | MSS |  |
| Colorectum | MSI-H |  |
| Colorectum | FAP |  |
| ∗Top 15 enriched GO BP terms are showed in the bar plot of each disease state in each tissue. Each row represents a significant GO biological process which is colored according to the -log10(p.adjust). |
| Page: 1 2 3 4 5 6 7 8 9 |
| GO ID | Tissue | Disease Stage | Description | Gene Ratio | Bg Ratio | pvalue | p.adjust | Count |
| GO:00086544 | Esophagus | ESCC | phospholipid biosynthetic process | 162/8552 | 253/18723 | 2.59e-09 | 5.73e-08 | 162 |
| GO:00464744 | Esophagus | ESCC | glycerophospholipid biosynthetic process | 135/8552 | 211/18723 | 5.75e-08 | 1.02e-06 | 135 |
| GO:00450175 | Esophagus | ESCC | glycerolipid biosynthetic process | 154/8552 | 252/18723 | 5.20e-07 | 6.96e-06 | 154 |
| GO:00066446 | Esophagus | ESCC | phospholipid metabolic process | 218/8552 | 383/18723 | 5.37e-06 | 5.59e-05 | 218 |
| GO:00066505 | Esophagus | ESCC | glycerophospholipid metabolic process | 174/8552 | 306/18723 | 4.92e-05 | 3.85e-04 | 174 |
| GO:00066541 | Esophagus | ESCC | phosphatidic acid biosynthetic process | 26/8552 | 33/18723 | 1.06e-04 | 7.43e-04 | 26 |
| GO:00464733 | Esophagus | ESCC | phosphatidic acid metabolic process | 28/8552 | 37/18723 | 2.00e-04 | 1.26e-03 | 28 |
| GO:00464864 | Esophagus | ESCC | glycerolipid metabolic process | 211/8552 | 392/18723 | 6.51e-04 | 3.46e-03 | 211 |
| GO:00463411 | Esophagus | ESCC | CDP-diacylglycerol metabolic process | 11/8552 | 14/18723 | 1.30e-02 | 4.27e-02 | 11 |
| Page: 1 |
| Pathway ID | Tissue | Disease Stage | Description | Gene Ratio | Bg Ratio | pvalue | p.adjust | qvalue | Count |
| Page: 1 |
Top |
Cell-cell communication analysis |
| Identification of potential cell-cell interactions between two cell types and their ligand-receptor pairs for different disease states |
| Ligand | Receptor | LRpair | Pathway | Tissue | Disease Stage |
| Page: 1 |
Top |
Single-cell gene regulatory network inference analysis |
| Find out the significant the regulons (TFs) and the target genes of each regulon across cell types for different disease states |
| TF | Cell Type | Tissue | Disease Stage | Target Gene | RSS | Regulon Activity |
| ∗The dot plots of a searched regulon are shown for all cell subpopulations in each disease state of each tissue based on the regulon specific score inferred using pySCENIC and by calculating the average expression. |
| Page: 1 |
Top |
Somatic mutation of malignant transformation related genes |
| Annotation of somatic variants for genes involved in malignant transformation |
| Hugo Symbol | Variant Class | Variant Classification | dbSNP RS | HGVSc | HGVSp | HGVSp Short | SWISSPROT | BIOTYPE | SIFT | PolyPhen | Tumor Sample Barcode | Tissue | Histology | Sex | Age | Stage | Therapy Types | Drugs | Outcome |
| AGPAT4 | SNV | Missense_Mutation | c.668N>T | p.Ser223Leu | p.S223L | Q9NRZ5 | protein_coding | tolerated(0.13) | benign(0.379) | TCGA-A2-A25A-01 | Breast | breast invasive carcinoma | Female | <65 | I/II | Unspecific | Cytoxan | SD | |
| AGPAT4 | SNV | Missense_Mutation | c.413T>C | p.Phe138Ser | p.F138S | Q9NRZ5 | protein_coding | deleterious(0) | possibly_damaging(0.703) | TCGA-E9-A295-01 | Breast | breast invasive carcinoma | Female | >=65 | I/II | Hormone Therapy | tamoxiphen | SD | |
| AGPAT4 | SNV | Missense_Mutation | novel | c.236N>A | p.Pro79Gln | p.P79Q | Q9NRZ5 | protein_coding | tolerated(0.53) | probably_damaging(0.972) | TCGA-OL-A6VR-01 | Breast | breast invasive carcinoma | Female | <65 | I/II | Unknown | Unknown | SD |
| AGPAT4 | insertion | Nonsense_Mutation | novel | c.256_257insAACACCCAAACAACTAA | p.Gly86GlufsTer6 | p.G86Efs*6 | Q9NRZ5 | protein_coding | TCGA-AN-A0FN-01 | Breast | breast invasive carcinoma | Female | <65 | I/II | Unknown | Unknown | SD | ||
| AGPAT4 | insertion | Frame_Shift_Ins | novel | c.255_256insTCTATTTATAGGACTTCACTCATTACTGT | p.Gly86SerfsTer40 | p.G86Sfs*40 | Q9NRZ5 | protein_coding | TCGA-AN-A0FN-01 | Breast | breast invasive carcinoma | Female | <65 | I/II | Unknown | Unknown | SD | ||
| AGPAT4 | SNV | Missense_Mutation | c.328N>A | p.Glu110Lys | p.E110K | Q9NRZ5 | protein_coding | deleterious(0) | possibly_damaging(0.536) | TCGA-FU-A3HZ-01 | Cervix | cervical & endocervical cancer | Female | <65 | I/II | Chemotherapy | cisplatin | CR | |
| AGPAT4 | SNV | Missense_Mutation | novel | c.155N>A | p.Arg52Lys | p.R52K | Q9NRZ5 | protein_coding | tolerated(0.23) | benign(0.006) | TCGA-ZJ-AAXU-01 | Cervix | cervical & endocervical cancer | Female | <65 | I/II | Unknown | Unknown | SD |
| AGPAT4 | insertion | Frame_Shift_Ins | rs750826126 | c.907dupC | p.Arg303ProfsTer60 | p.R303Pfs*60 | Q9NRZ5 | protein_coding | TCGA-VS-A9U6-01 | Cervix | cervical & endocervical cancer | Female | <65 | I/II | Chemotherapy | cisplatin | PD | ||
| AGPAT4 | SNV | Missense_Mutation | novel | c.614N>C | p.Leu205Ser | p.L205S | Q9NRZ5 | protein_coding | deleterious(0) | possibly_damaging(0.752) | TCGA-A6-3808-01 | Colorectum | colon adenocarcinoma | Male | >=65 | I/II | Unknown | Unknown | SD |
| AGPAT4 | SNV | Missense_Mutation | c.634N>A | p.Ala212Thr | p.A212T | Q9NRZ5 | protein_coding | tolerated(1) | benign(0.373) | TCGA-AA-3864-01 | Colorectum | colon adenocarcinoma | Male | >=65 | I/II | Unknown | Unknown | SD |
| Page: 1 2 3 4 5 6 |
Top |
Related drugs of malignant transformation related genes |
| Identification of chemicals and drugs interact with genes involved in malignant transfromation |
| (DGIdb 4.0) |
| Entrez ID | Symbol | Category | Interaction Types | Drug Claim Name | Drug Name | PMIDs |
| Page: 1 |

Copyright 2023-Present -The University of Texas Health Science Center at Houston |