
|
|||||
|
 | |
| |
| |
| |
| |
| |
|
Gene: AGPAT2 |
Gene summary for AGPAT2 |
| Gene information | Species | Human | Gene symbol | AGPAT2 | Gene ID | 10555 |
| Gene name | 1-acylglycerol-3-phosphate O-acyltransferase 2 | |
| Gene Alias | 1-AGPAT2 | |
| Cytomap | 9q34.3 | |
| Gene Type | protein-coding | GO ID | GO:0001816 | UniProtAcc | A0A024R8F9 |
Top |
Malignant transformation analysis |
| Identification of the aberrant gene expression in precancerous and cancerous lesions by comparing the gene expression of stem-like cells in diseased tissues with normal stem cells |
| Entrez ID | Symbol | Replicates | Species | Organ | Tissue | Adj P-value | Log2FC | Malignancy |
| 10555 | AGPAT2 | GSM4909281 | Human | Breast | IDC | 7.37e-09 | 3.21e-01 | 0.21 |
| 10555 | AGPAT2 | GSM4909285 | Human | Breast | IDC | 8.90e-06 | 2.23e-01 | 0.21 |
| 10555 | AGPAT2 | GSM4909291 | Human | Breast | IDC | 2.87e-09 | 4.48e-01 | 0.1753 |
| 10555 | AGPAT2 | GSM4909295 | Human | Breast | IDC | 1.51e-09 | 5.34e-01 | 0.0898 |
| 10555 | AGPAT2 | GSM4909296 | Human | Breast | IDC | 1.29e-02 | 1.17e-01 | 0.1524 |
| 10555 | AGPAT2 | GSM4909308 | Human | Breast | IDC | 6.38e-07 | 2.89e-01 | 0.158 |
| 10555 | AGPAT2 | GSM4909311 | Human | Breast | IDC | 5.06e-03 | 2.28e-02 | 0.1534 |
| 10555 | AGPAT2 | GSM4909317 | Human | Breast | IDC | 2.90e-18 | 5.15e-01 | 0.1355 |
| 10555 | AGPAT2 | GSM4909319 | Human | Breast | IDC | 3.60e-05 | -8.05e-02 | 0.1563 |
| 10555 | AGPAT2 | brca1 | Human | Breast | Precancer | 3.60e-05 | 3.38e-01 | -0.0338 |
| 10555 | AGPAT2 | brca2 | Human | Breast | Precancer | 9.10e-13 | 2.95e-01 | -0.024 |
| 10555 | AGPAT2 | brca3 | Human | Breast | Precancer | 6.08e-12 | 3.15e-01 | -0.0263 |
| 10555 | AGPAT2 | DCIS2 | Human | Breast | DCIS | 6.80e-30 | 1.37e-01 | 0.0085 |
| 10555 | AGPAT2 | HTA11_2487_2000001011 | Human | Colorectum | SER | 1.82e-20 | 9.74e-01 | -0.1808 |
| 10555 | AGPAT2 | HTA11_1938_2000001011 | Human | Colorectum | AD | 2.81e-14 | 6.04e-01 | -0.0811 |
| 10555 | AGPAT2 | HTA11_78_2000001011 | Human | Colorectum | AD | 1.68e-02 | 2.77e-01 | -0.1088 |
| 10555 | AGPAT2 | HTA11_347_2000001011 | Human | Colorectum | AD | 6.36e-21 | 6.78e-01 | -0.1954 |
| 10555 | AGPAT2 | HTA11_411_2000001011 | Human | Colorectum | SER | 1.08e-07 | 1.53e+00 | -0.2602 |
| 10555 | AGPAT2 | HTA11_2112_2000001011 | Human | Colorectum | SER | 1.98e-12 | 1.42e+00 | -0.2196 |
| 10555 | AGPAT2 | HTA11_3361_2000001011 | Human | Colorectum | AD | 4.09e-05 | 4.78e-01 | -0.1207 |
| Page: 1 2 3 4 5 6 7 8 9 10 |
| Tissue | Expression Dynamics | Abbreviation |
| Breast | 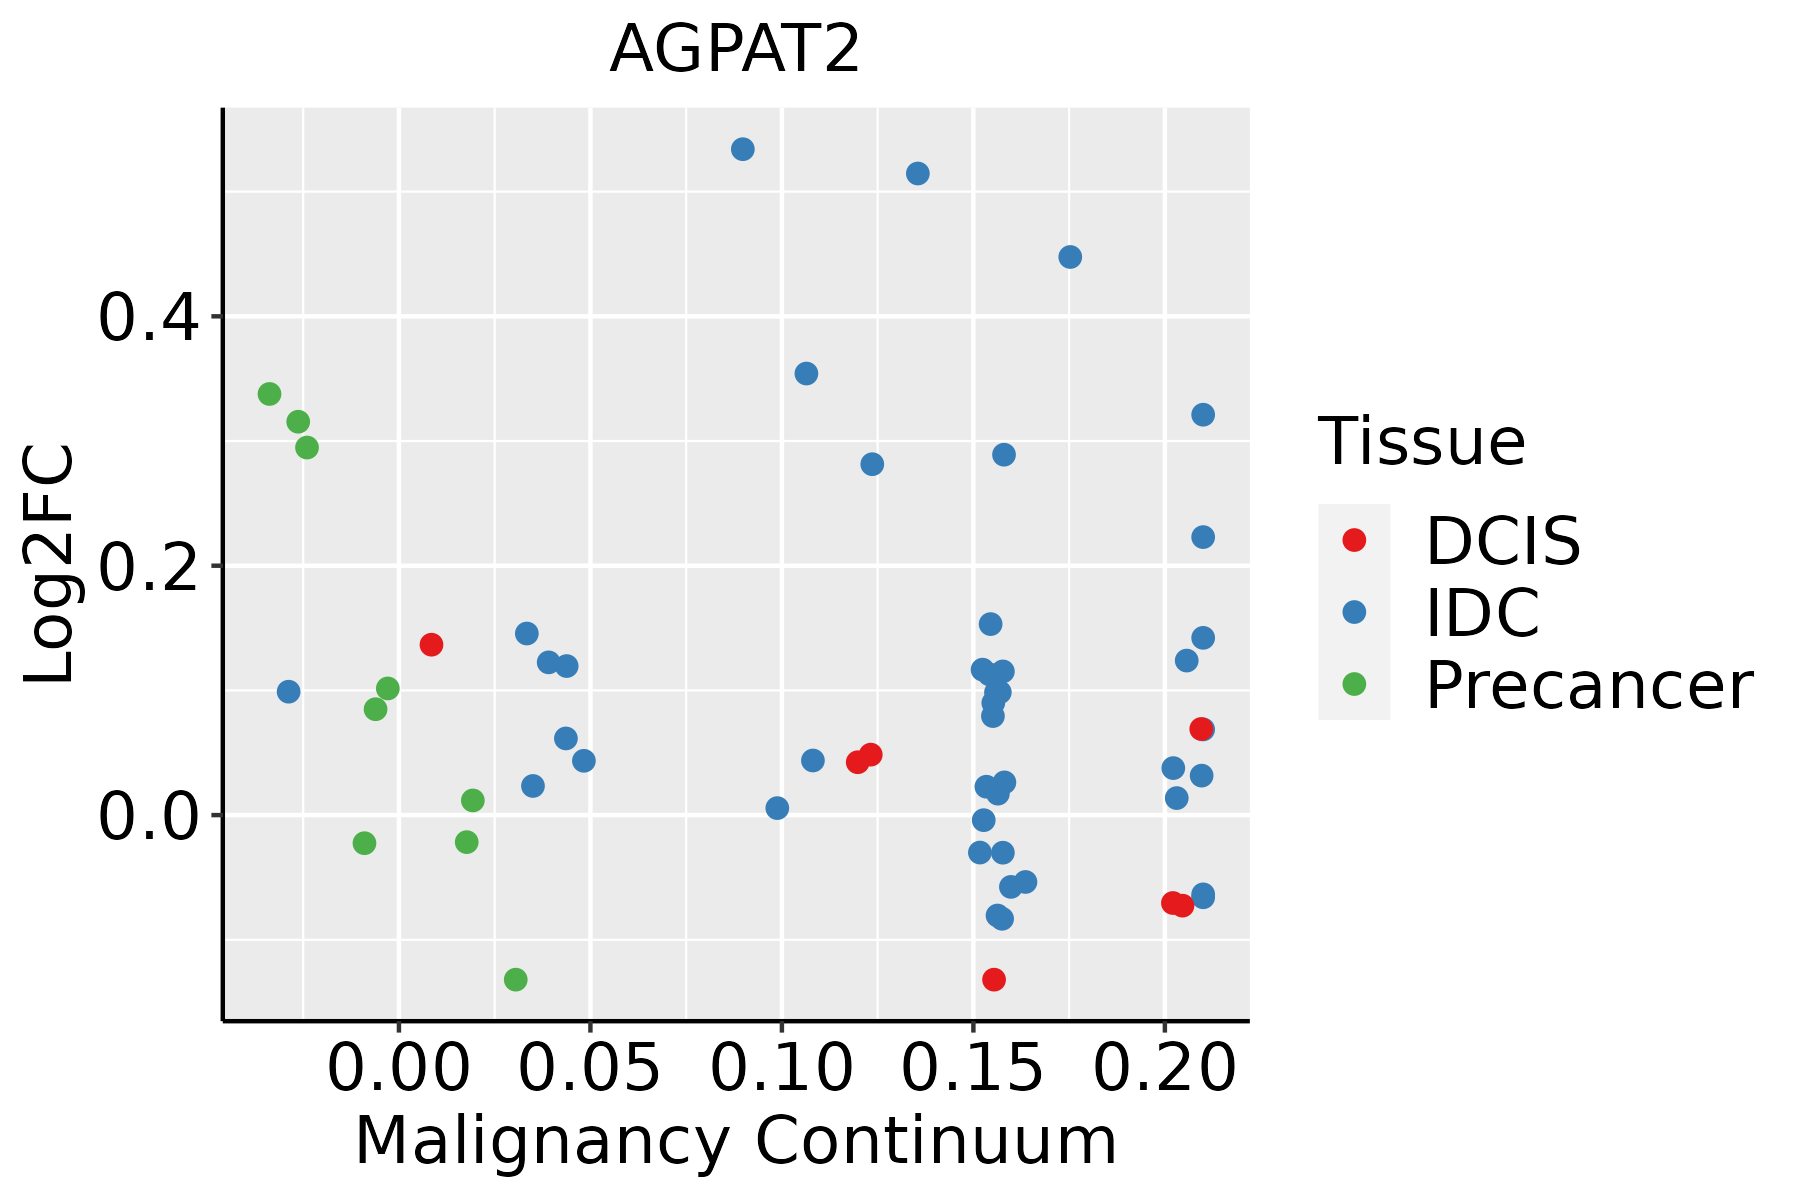 | IDC: Invasive ductal carcinoma |
| DCIS: Ductal carcinoma in situ | ||
| Precancer(BRCA1-mut): Precancerous lesion from BRCA1 mutation carriers | ||
| Colorectum (GSE201348) |  | FAP: Familial adenomatous polyposis |
| CRC: Colorectal cancer | ||
| Colorectum (HTA11) |  | AD: Adenomas |
| SER: Sessile serrated lesions | ||
| MSI-H: Microsatellite-high colorectal cancer | ||
| MSS: Microsatellite stable colorectal cancer | ||
| Esophagus | 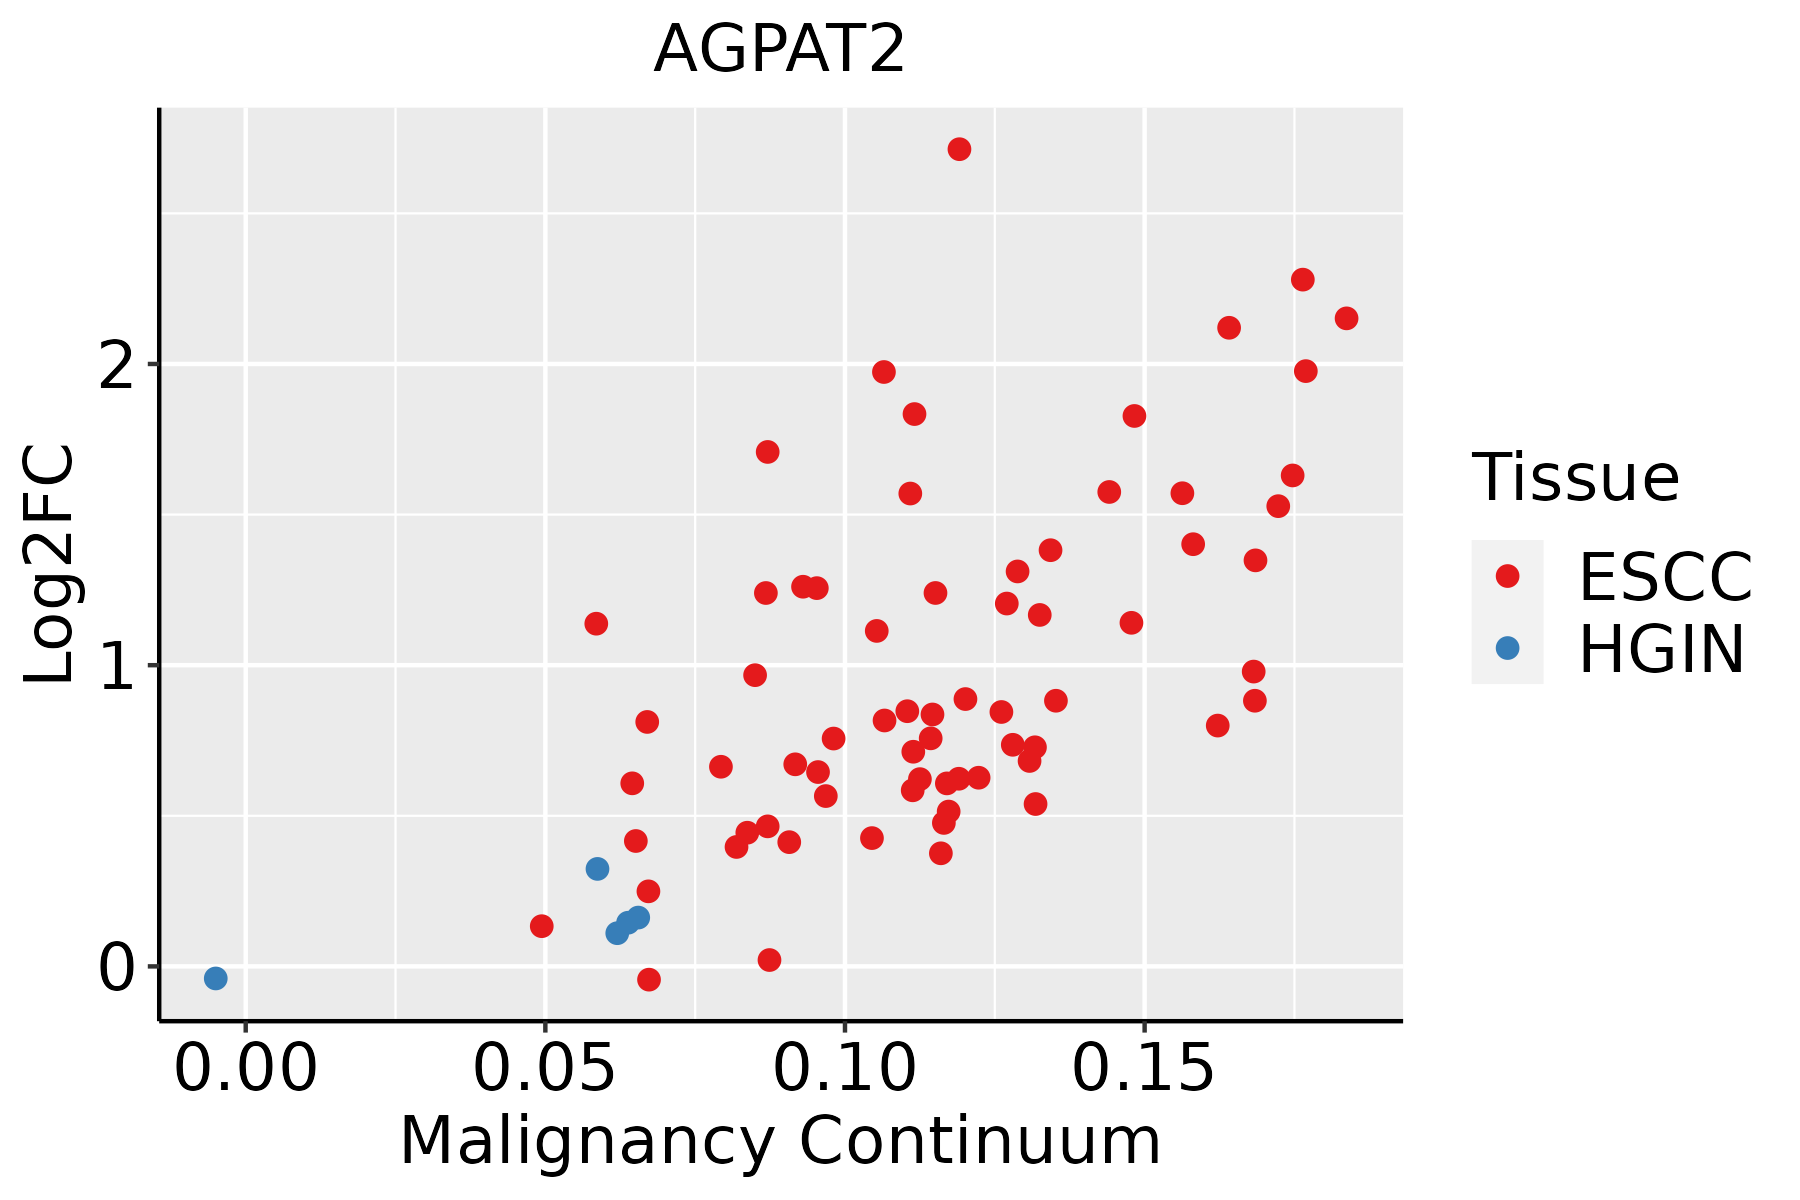 | ESCC: Esophageal squamous cell carcinoma |
| HGIN: High-grade intraepithelial neoplasias | ||
| LGIN: Low-grade intraepithelial neoplasias | ||
| GC | 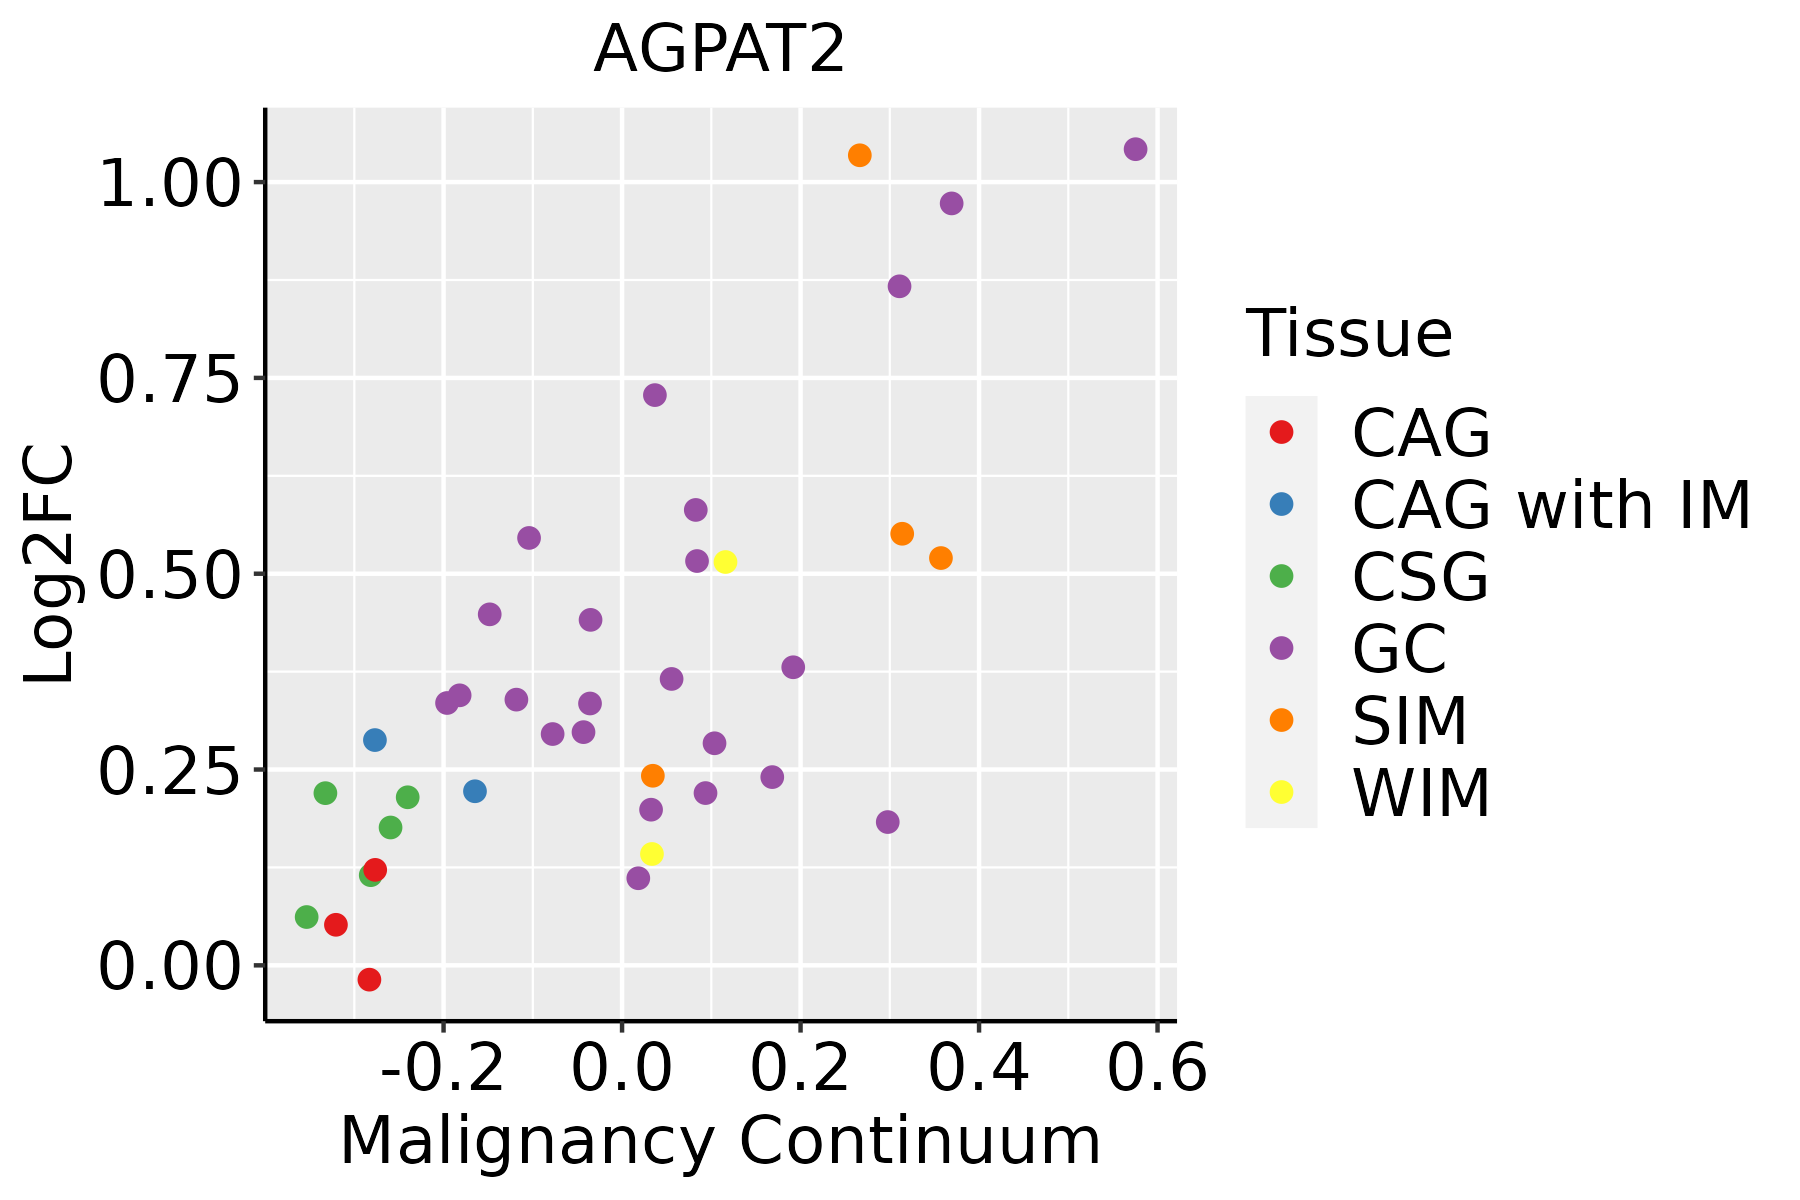 | CAG: Chronic atrophic gastritis |
| CAG with IM: Chronic atrophic gastritis with intestinal metaplasia | ||
| CSG: Chronic superficial gastritis | ||
| GC: Gastric cancer | ||
| SIM: Severe intestinal metaplasia | ||
| WIM: Wild intestinal metaplasia | ||
| Liver |  | HCC: Hepatocellular carcinoma |
| NAFLD: Non-alcoholic fatty liver disease | ||
| Oral Cavity | 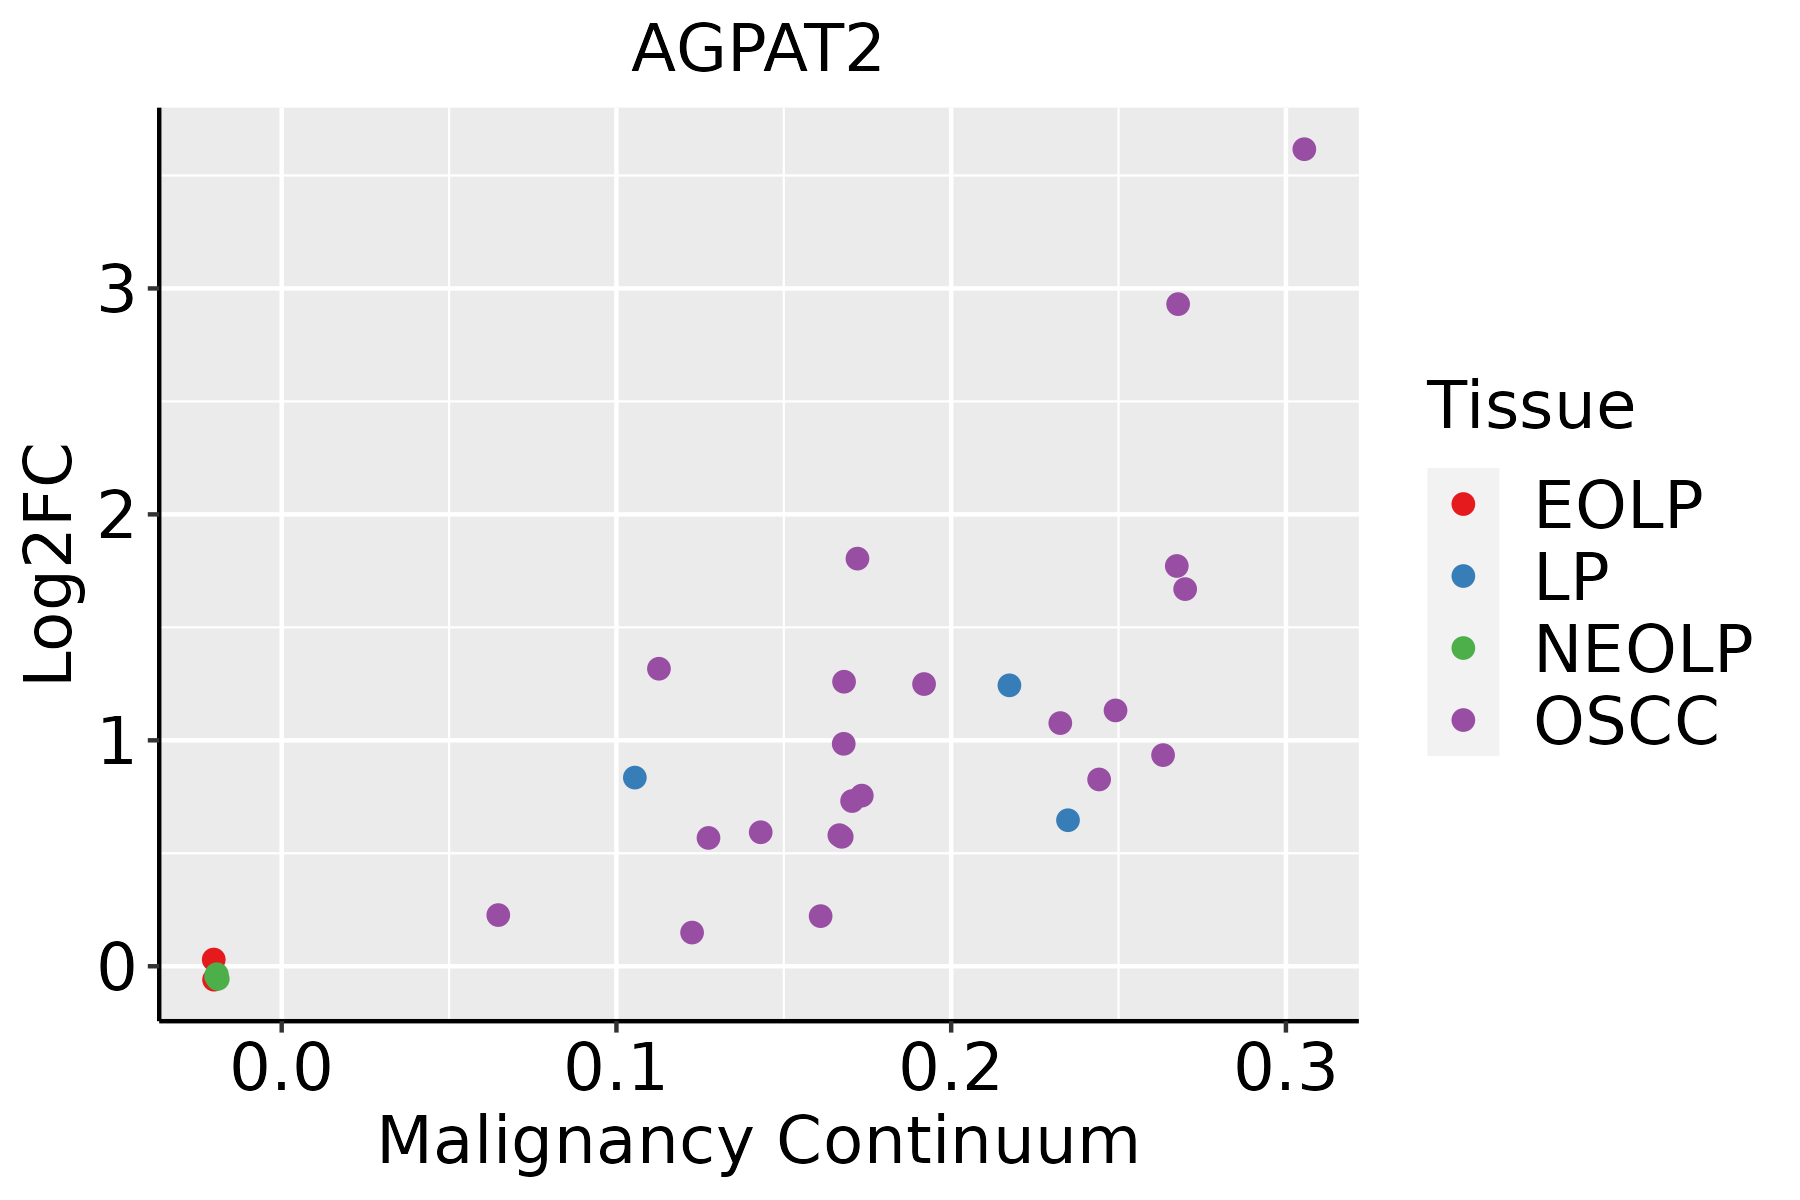 | EOLP: Erosive Oral lichen planus |
| LP: leukoplakia | ||
| NEOLP: Non-erosive oral lichen planus | ||
| OSCC: Oral squamous cell carcinoma | ||
| Skin |  | AK: Actinic keratosis |
| cSCC: Cutaneous squamous cell carcinoma | ||
| SCCIS:squamous cell carcinoma in situ | ||
| Thyroid | 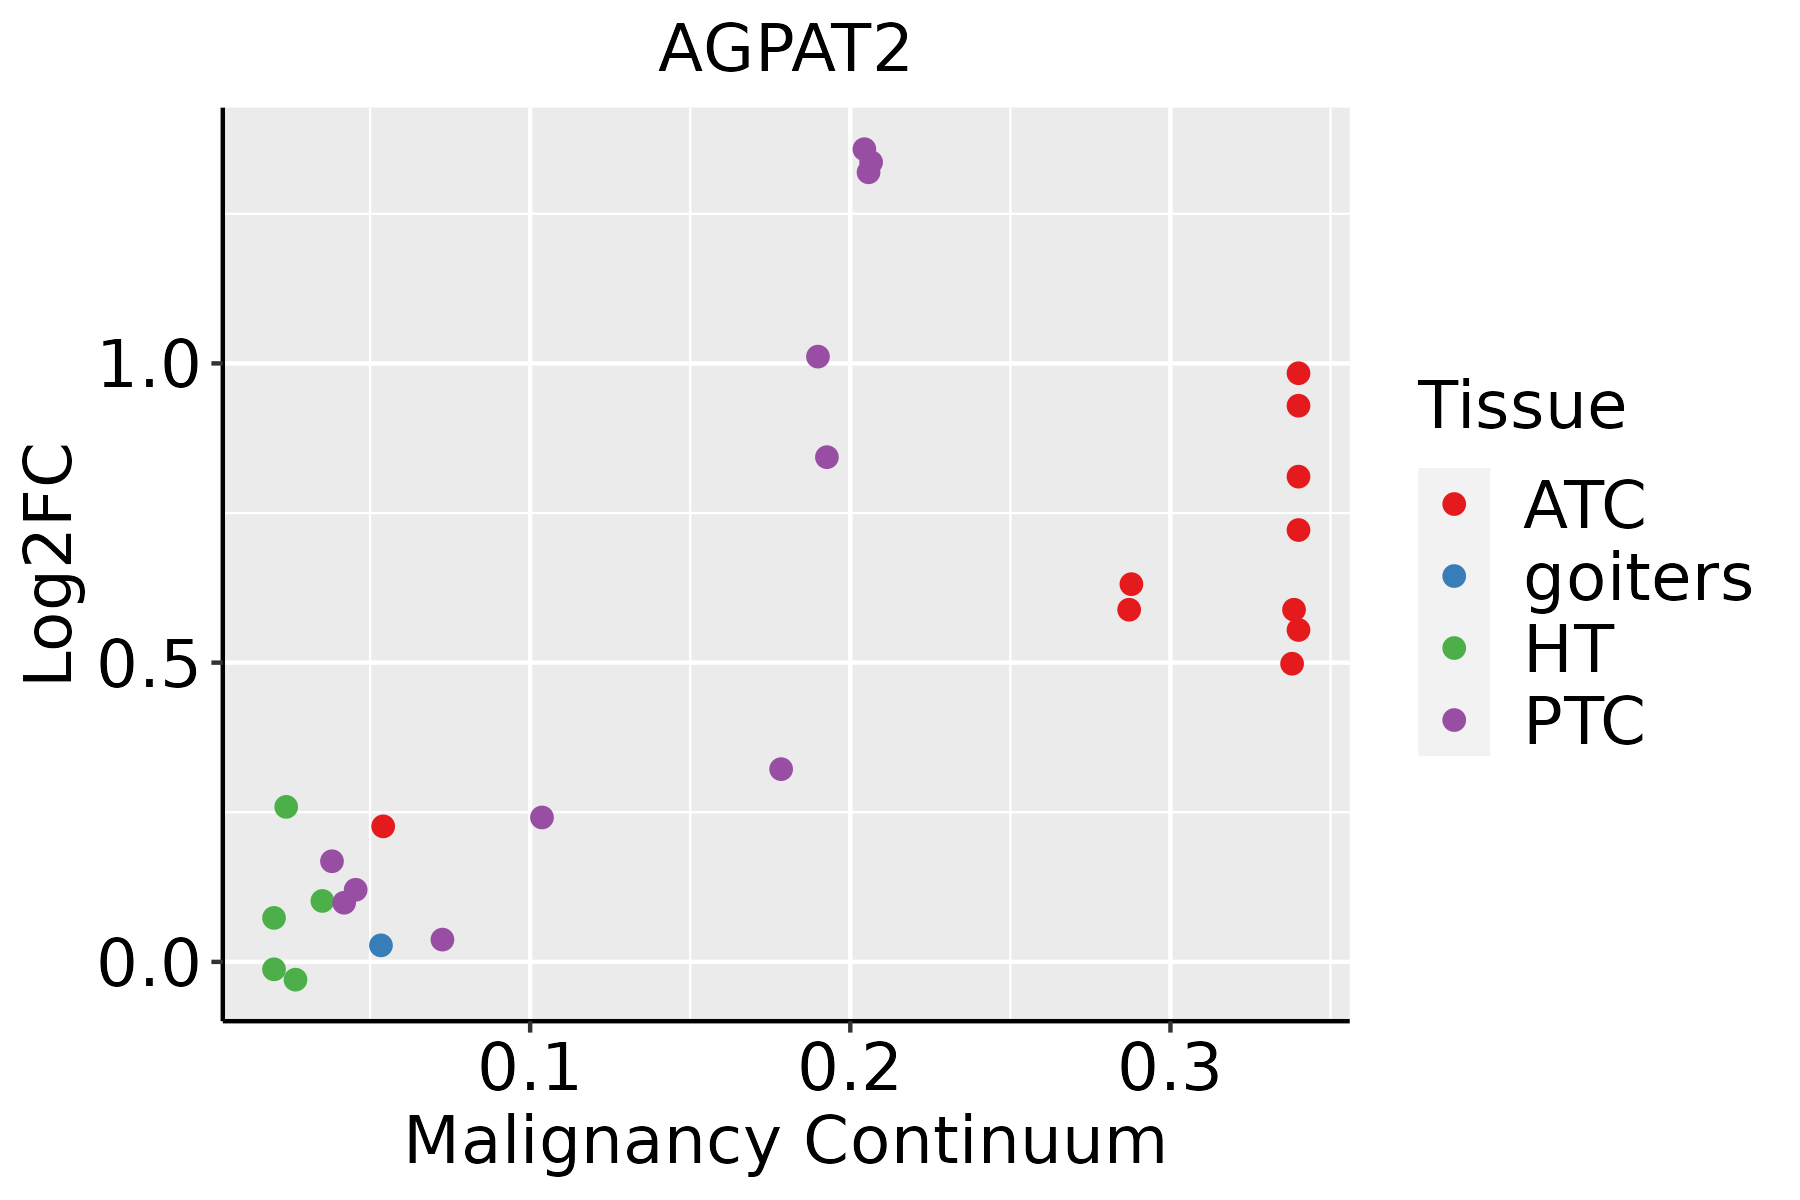 | ATC: Anaplastic thyroid cancer |
| HT: Hashimoto's thyroiditis | ||
| PTC: Papillary thyroid cancer |
| ∗log2FC in expression of this searched gene in stem-like cells from each diseased tissue sample relative to stem-like cells in normal samples in each tissue plotted against the malignancy continuum. Samples are colored based on if they are from different disease stage. |
Top |
Malignant transformation related pathway analysis |
| Find out the enriched GO biological processes and KEGG pathways involved in transition from healthy to precancer to cancer |
| Tissue | Disease Stage | Enriched GO biological Processes |
| Colorectum | AD |  |
| Colorectum | SER |  |
| Colorectum | MSS |  |
| Colorectum | MSI-H |  |
| Colorectum | FAP |  |
| ∗Top 15 enriched GO BP terms are showed in the bar plot of each disease state in each tissue. Each row represents a significant GO biological process which is colored according to the -log10(p.adjust). |
| Page: 1 2 3 4 5 6 7 8 9 |
| GO ID | Tissue | Disease Stage | Description | Gene Ratio | Bg Ratio | pvalue | p.adjust | Count |
| GO:00018196 | Breast | Precancer | positive regulation of cytokine production | 52/1080 | 467/18723 | 4.18e-06 | 1.29e-04 | 52 |
| GO:00085445 | Breast | Precancer | epidermis development | 35/1080 | 324/18723 | 2.71e-04 | 3.96e-03 | 35 |
| GO:00094108 | Breast | Precancer | response to xenobiotic stimulus | 45/1080 | 462/18723 | 4.17e-04 | 5.56e-03 | 45 |
| GO:000941013 | Breast | IDC | response to xenobiotic stimulus | 62/1434 | 462/18723 | 1.05e-05 | 2.88e-04 | 62 |
| GO:000181911 | Breast | IDC | positive regulation of cytokine production | 61/1434 | 467/18723 | 2.81e-05 | 6.58e-04 | 61 |
| GO:000854412 | Breast | IDC | epidermis development | 41/1434 | 324/18723 | 1.03e-03 | 1.14e-02 | 41 |
| GO:000181921 | Breast | DCIS | positive regulation of cytokine production | 63/1390 | 467/18723 | 2.76e-06 | 9.42e-05 | 63 |
| GO:000941023 | Breast | DCIS | response to xenobiotic stimulus | 59/1390 | 462/18723 | 3.00e-05 | 6.61e-04 | 59 |
| GO:000854422 | Breast | DCIS | epidermis development | 40/1390 | 324/18723 | 1.05e-03 | 1.16e-02 | 40 |
| GO:0009410 | Colorectum | AD | response to xenobiotic stimulus | 128/3918 | 462/18723 | 2.69e-04 | 3.31e-03 | 128 |
| GO:0006650 | Colorectum | AD | glycerophospholipid metabolic process | 83/3918 | 306/18723 | 5.40e-03 | 3.55e-02 | 83 |
| GO:0006644 | Colorectum | AD | phospholipid metabolic process | 101/3918 | 383/18723 | 5.80e-03 | 3.67e-02 | 101 |
| GO:0008544 | Colorectum | AD | epidermis development | 87/3918 | 324/18723 | 5.99e-03 | 3.76e-02 | 87 |
| GO:0045017 | Colorectum | AD | glycerolipid biosynthetic process | 69/3918 | 252/18723 | 8.33e-03 | 4.88e-02 | 69 |
| GO:0046486 | Colorectum | SER | glycerolipid metabolic process | 82/2897 | 392/18723 | 2.26e-03 | 2.17e-02 | 82 |
| GO:00066441 | Colorectum | SER | phospholipid metabolic process | 79/2897 | 383/18723 | 3.94e-03 | 3.24e-02 | 79 |
| GO:00450171 | Colorectum | SER | glycerolipid biosynthetic process | 55/2897 | 252/18723 | 4.47e-03 | 3.56e-02 | 55 |
| GO:00066501 | Colorectum | SER | glycerophospholipid metabolic process | 64/2897 | 306/18723 | 6.41e-03 | 4.60e-02 | 64 |
| GO:00094101 | Colorectum | MSS | response to xenobiotic stimulus | 110/3467 | 462/18723 | 2.36e-03 | 1.92e-02 | 110 |
| GO:0008654 | Colorectum | FAP | phospholipid biosynthetic process | 54/2622 | 253/18723 | 8.88e-04 | 9.08e-03 | 54 |
| Page: 1 2 3 4 5 6 |
| Pathway ID | Tissue | Disease Stage | Description | Gene Ratio | Bg Ratio | pvalue | p.adjust | qvalue | Count |
| hsa00561 | Colorectum | AD | Glycerolipid metabolism | 24/2092 | 63/8465 | 1.25e-02 | 4.54e-02 | 2.90e-02 | 24 |
| hsa005611 | Colorectum | AD | Glycerolipid metabolism | 24/2092 | 63/8465 | 1.25e-02 | 4.54e-02 | 2.90e-02 | 24 |
| hsa005615 | Liver | HCC | Glycerolipid metabolism | 41/4020 | 63/8465 | 3.59e-03 | 1.12e-02 | 6.22e-03 | 41 |
| hsa0056112 | Liver | HCC | Glycerolipid metabolism | 41/4020 | 63/8465 | 3.59e-03 | 1.12e-02 | 6.22e-03 | 41 |
| Page: 1 |
Top |
Cell-cell communication analysis |
| Identification of potential cell-cell interactions between two cell types and their ligand-receptor pairs for different disease states |
| Ligand | Receptor | LRpair | Pathway | Tissue | Disease Stage |
| Page: 1 |
Top |
Single-cell gene regulatory network inference analysis |
| Find out the significant the regulons (TFs) and the target genes of each regulon across cell types for different disease states |
| TF | Cell Type | Tissue | Disease Stage | Target Gene | RSS | Regulon Activity |
| ∗The dot plots of a searched regulon are shown for all cell subpopulations in each disease state of each tissue based on the regulon specific score inferred using pySCENIC and by calculating the average expression. |
| Page: 1 |
Top |
Somatic mutation of malignant transformation related genes |
| Annotation of somatic variants for genes involved in malignant transformation |
| Hugo Symbol | Variant Class | Variant Classification | dbSNP RS | HGVSc | HGVSp | HGVSp Short | SWISSPROT | BIOTYPE | SIFT | PolyPhen | Tumor Sample Barcode | Tissue | Histology | Sex | Age | Stage | Therapy Types | Drugs | Outcome |
| AGPAT2 | SNV | Missense_Mutation | rs374919945 | c.476N>A | p.Arg159His | p.R159H | O15120 | protein_coding | tolerated(0.53) | benign(0.013) | TCGA-2W-A8YY-01 | Cervix | cervical & endocervical cancer | Female | <65 | I/II | Chemotherapy | cisplatin | CR |
| AGPAT2 | SNV | Missense_Mutation | rs746314526 | c.341G>A | p.Arg114His | p.R114H | O15120 | protein_coding | deleterious(0.02) | possibly_damaging(0.666) | TCGA-AD-5900-01 | Colorectum | colon adenocarcinoma | Male | >=65 | I/II | Unknown | Unknown | SD |
| AGPAT2 | SNV | Missense_Mutation | rs764260414 | c.299N>A | p.Ser100Asn | p.S100N | O15120 | protein_coding | deleterious(0.03) | probably_damaging(0.945) | TCGA-AZ-4315-01 | Colorectum | colon adenocarcinoma | Male | <65 | I/II | Unknown | Unknown | SD |
| AGPAT2 | SNV | Missense_Mutation | c.383N>A | p.Pro128His | p.P128H | O15120 | protein_coding | deleterious(0.02) | probably_damaging(0.984) | TCGA-EI-6882-01 | Colorectum | rectum adenocarcinoma | Male | <65 | I/II | Unknown | Unknown | SD | |
| AGPAT2 | SNV | Missense_Mutation | c.417N>A | p.Phe139Leu | p.F139L | O15120 | protein_coding | tolerated(0.13) | benign(0.003) | TCGA-AP-A059-01 | Endometrium | uterine corpus endometrioid carcinoma | Female | >=65 | I/II | Unknown | Unknown | SD | |
| AGPAT2 | SNV | Missense_Mutation | c.641A>T | p.Lys214Met | p.K214M | O15120 | protein_coding | deleterious(0) | possibly_damaging(0.823) | TCGA-D1-A103-01 | Endometrium | uterine corpus endometrioid carcinoma | Female | >=65 | I/II | Unknown | Unknown | SD | |
| AGPAT2 | SNV | Missense_Mutation | rs200656731 | c.713N>T | p.Ala238Val | p.A238V | O15120 | protein_coding | tolerated(0.62) | benign(0) | TCGA-QS-A5YQ-01 | Endometrium | uterine corpus endometrioid carcinoma | Female | <65 | III/IV | Chemotherapy | cisplatin | CR |
| AGPAT2 | SNV | Missense_Mutation | rs11545228 | c.721N>T | p.Val241Phe | p.V241F | O15120 | protein_coding | deleterious(0) | probably_damaging(0.965) | TCGA-DD-AACB-01 | Liver | liver hepatocellular carcinoma | Female | >=65 | I/II | Unknown | Unknown | SD |
| AGPAT2 | SNV | Missense_Mutation | novel | c.554A>T | p.Lys185Met | p.K185M | O15120 | protein_coding | deleterious(0) | probably_damaging(1) | TCGA-38-4628-01 | Lung | lung adenocarcinoma | Female | >=65 | I/II | Chemotherapy | carboplatin | PD |
| AGPAT2 | SNV | Missense_Mutation | novel | c.474N>C | p.Glu158Asp | p.E158D | O15120 | protein_coding | tolerated(0.25) | benign(0.006) | TCGA-50-5051-01 | Lung | lung adenocarcinoma | Female | <65 | III/IV | Chemotherapy | carboplatin | PD |
| Page: 1 2 |
Top |
Related drugs of malignant transformation related genes |
| Identification of chemicals and drugs interact with genes involved in malignant transfromation |
| (DGIdb 4.0) |
| Entrez ID | Symbol | Category | Interaction Types | Drug Claim Name | Drug Name | PMIDs |
| Page: 1 |

Copyright 2023-Present -The University of Texas Health Science Center at Houston |