
|
|||||
|
 | |
| |
| |
| |
| |
| |
|
Gene: AGPAT1 |
Gene summary for AGPAT1 |
| Gene information | Species | Human | Gene symbol | AGPAT1 | Gene ID | 10554 |
| Gene name | 1-acylglycerol-3-phosphate O-acyltransferase 1 | |
| Gene Alias | 1-AGPAT1 | |
| Cytomap | 6p21.32 | |
| Gene Type | protein-coding | GO ID | GO:0001816 | UniProtAcc | A0A024RCV5 |
Top |
Malignant transformation analysis |
| Identification of the aberrant gene expression in precancerous and cancerous lesions by comparing the gene expression of stem-like cells in diseased tissues with normal stem cells |
| Entrez ID | Symbol | Replicates | Species | Organ | Tissue | Adj P-value | Log2FC | Malignancy |
| 10554 | AGPAT1 | LZE4T | Human | Esophagus | ESCC | 3.17e-06 | 2.53e-02 | 0.0811 |
| 10554 | AGPAT1 | LZE7T | Human | Esophagus | ESCC | 2.08e-02 | 1.95e-01 | 0.0667 |
| 10554 | AGPAT1 | LZE8T | Human | Esophagus | ESCC | 3.02e-07 | 8.35e-02 | 0.067 |
| 10554 | AGPAT1 | LZE20T | Human | Esophagus | ESCC | 3.66e-03 | 6.95e-02 | 0.0662 |
| 10554 | AGPAT1 | LZE22T | Human | Esophagus | ESCC | 1.94e-02 | 3.60e-01 | 0.068 |
| 10554 | AGPAT1 | LZE24T | Human | Esophagus | ESCC | 7.60e-21 | 4.06e-01 | 0.0596 |
| 10554 | AGPAT1 | LZE21T | Human | Esophagus | ESCC | 2.13e-02 | 1.00e-01 | 0.0655 |
| 10554 | AGPAT1 | LZE6T | Human | Esophagus | ESCC | 2.90e-04 | 3.32e-01 | 0.0845 |
| 10554 | AGPAT1 | P1T-E | Human | Esophagus | ESCC | 1.05e-05 | 2.42e-01 | 0.0875 |
| 10554 | AGPAT1 | P2T-E | Human | Esophagus | ESCC | 1.62e-36 | 4.61e-01 | 0.1177 |
| 10554 | AGPAT1 | P4T-E | Human | Esophagus | ESCC | 2.75e-15 | 3.91e-01 | 0.1323 |
| 10554 | AGPAT1 | P5T-E | Human | Esophagus | ESCC | 3.00e-09 | 9.43e-02 | 0.1327 |
| 10554 | AGPAT1 | P8T-E | Human | Esophagus | ESCC | 3.91e-20 | 1.79e-01 | 0.0889 |
| 10554 | AGPAT1 | P9T-E | Human | Esophagus | ESCC | 4.53e-09 | 1.41e-01 | 0.1131 |
| 10554 | AGPAT1 | P10T-E | Human | Esophagus | ESCC | 1.13e-23 | 3.53e-01 | 0.116 |
| 10554 | AGPAT1 | P11T-E | Human | Esophagus | ESCC | 4.28e-08 | 4.21e-01 | 0.1426 |
| 10554 | AGPAT1 | P12T-E | Human | Esophagus | ESCC | 1.25e-23 | 2.98e-01 | 0.1122 |
| 10554 | AGPAT1 | P15T-E | Human | Esophagus | ESCC | 2.74e-13 | 2.50e-01 | 0.1149 |
| 10554 | AGPAT1 | P16T-E | Human | Esophagus | ESCC | 2.14e-15 | 3.07e-01 | 0.1153 |
| 10554 | AGPAT1 | P17T-E | Human | Esophagus | ESCC | 4.66e-08 | 3.90e-01 | 0.1278 |
| Page: 1 2 3 4 5 |
| Tissue | Expression Dynamics | Abbreviation |
| Esophagus | 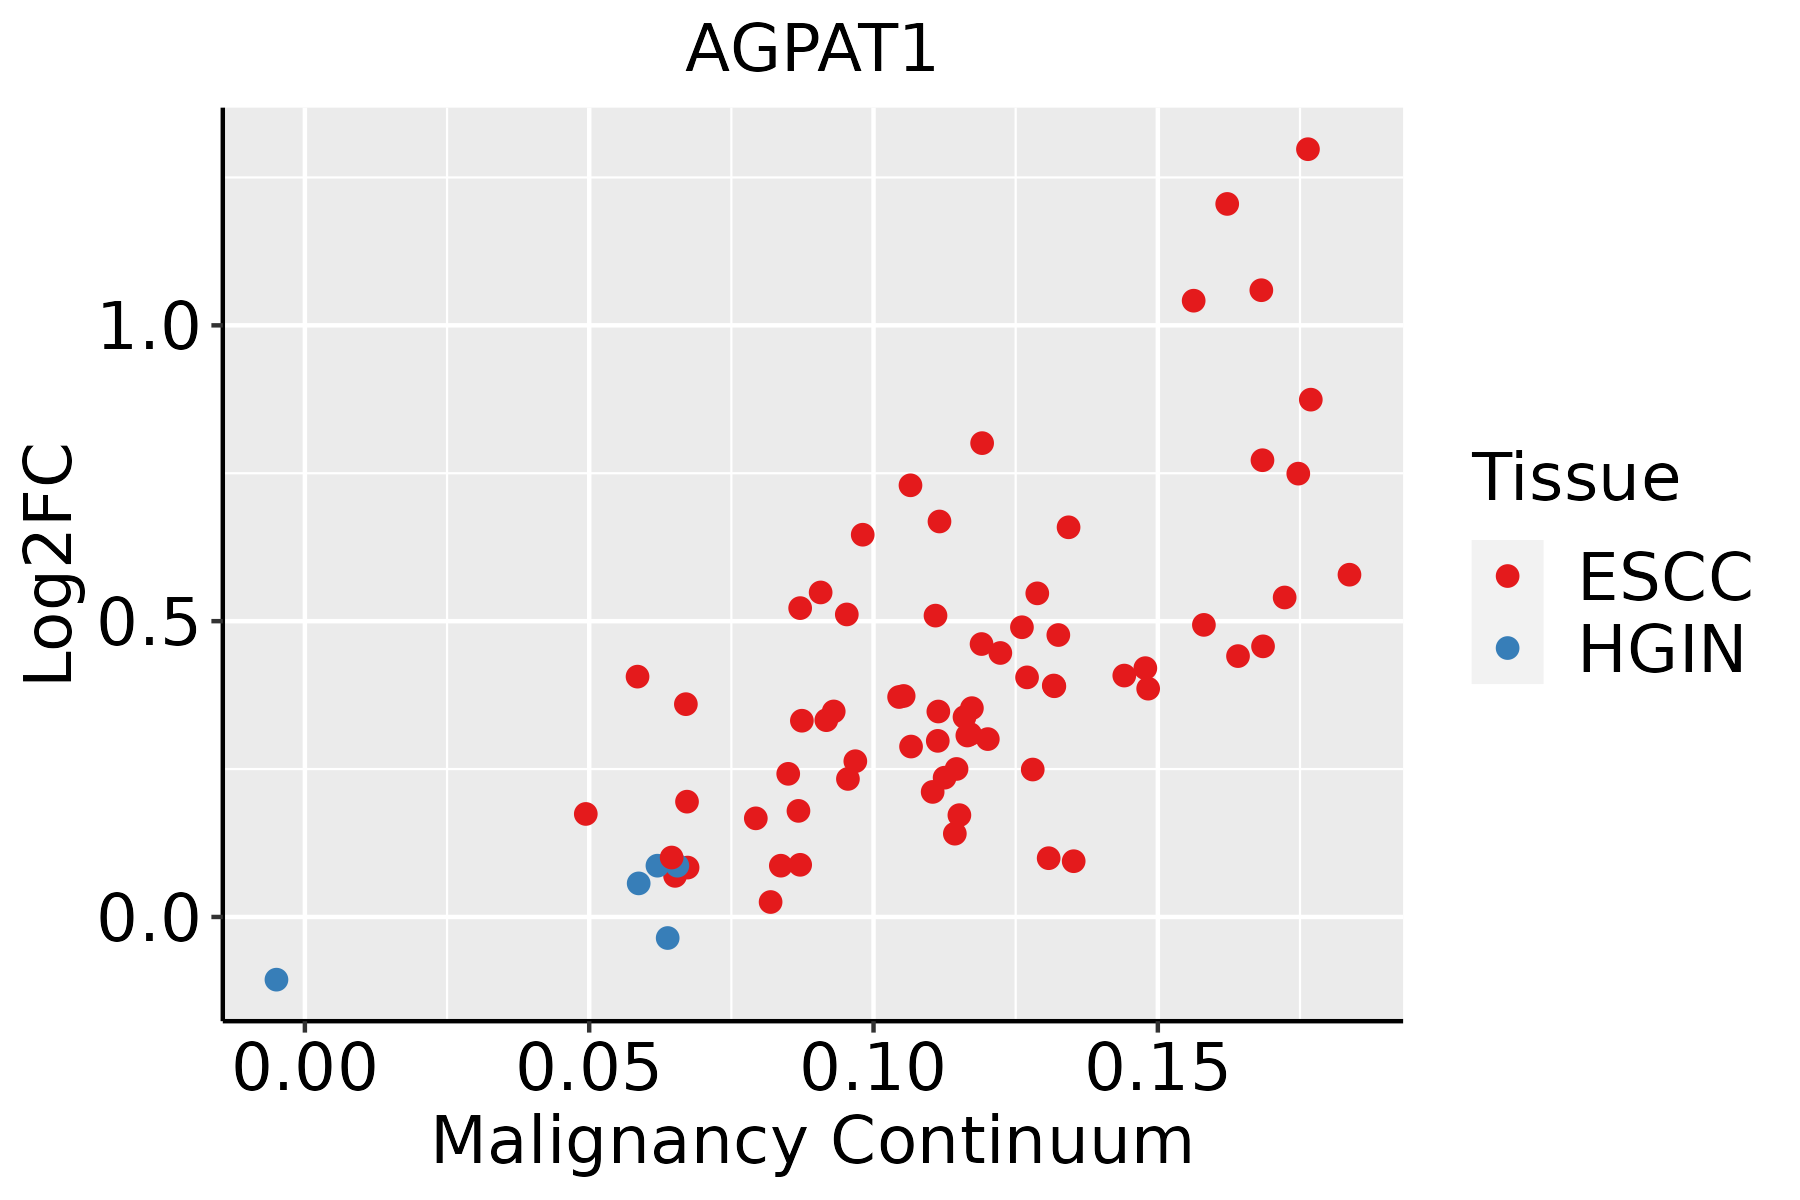 | ESCC: Esophageal squamous cell carcinoma |
| HGIN: High-grade intraepithelial neoplasias | ||
| LGIN: Low-grade intraepithelial neoplasias | ||
| Liver | 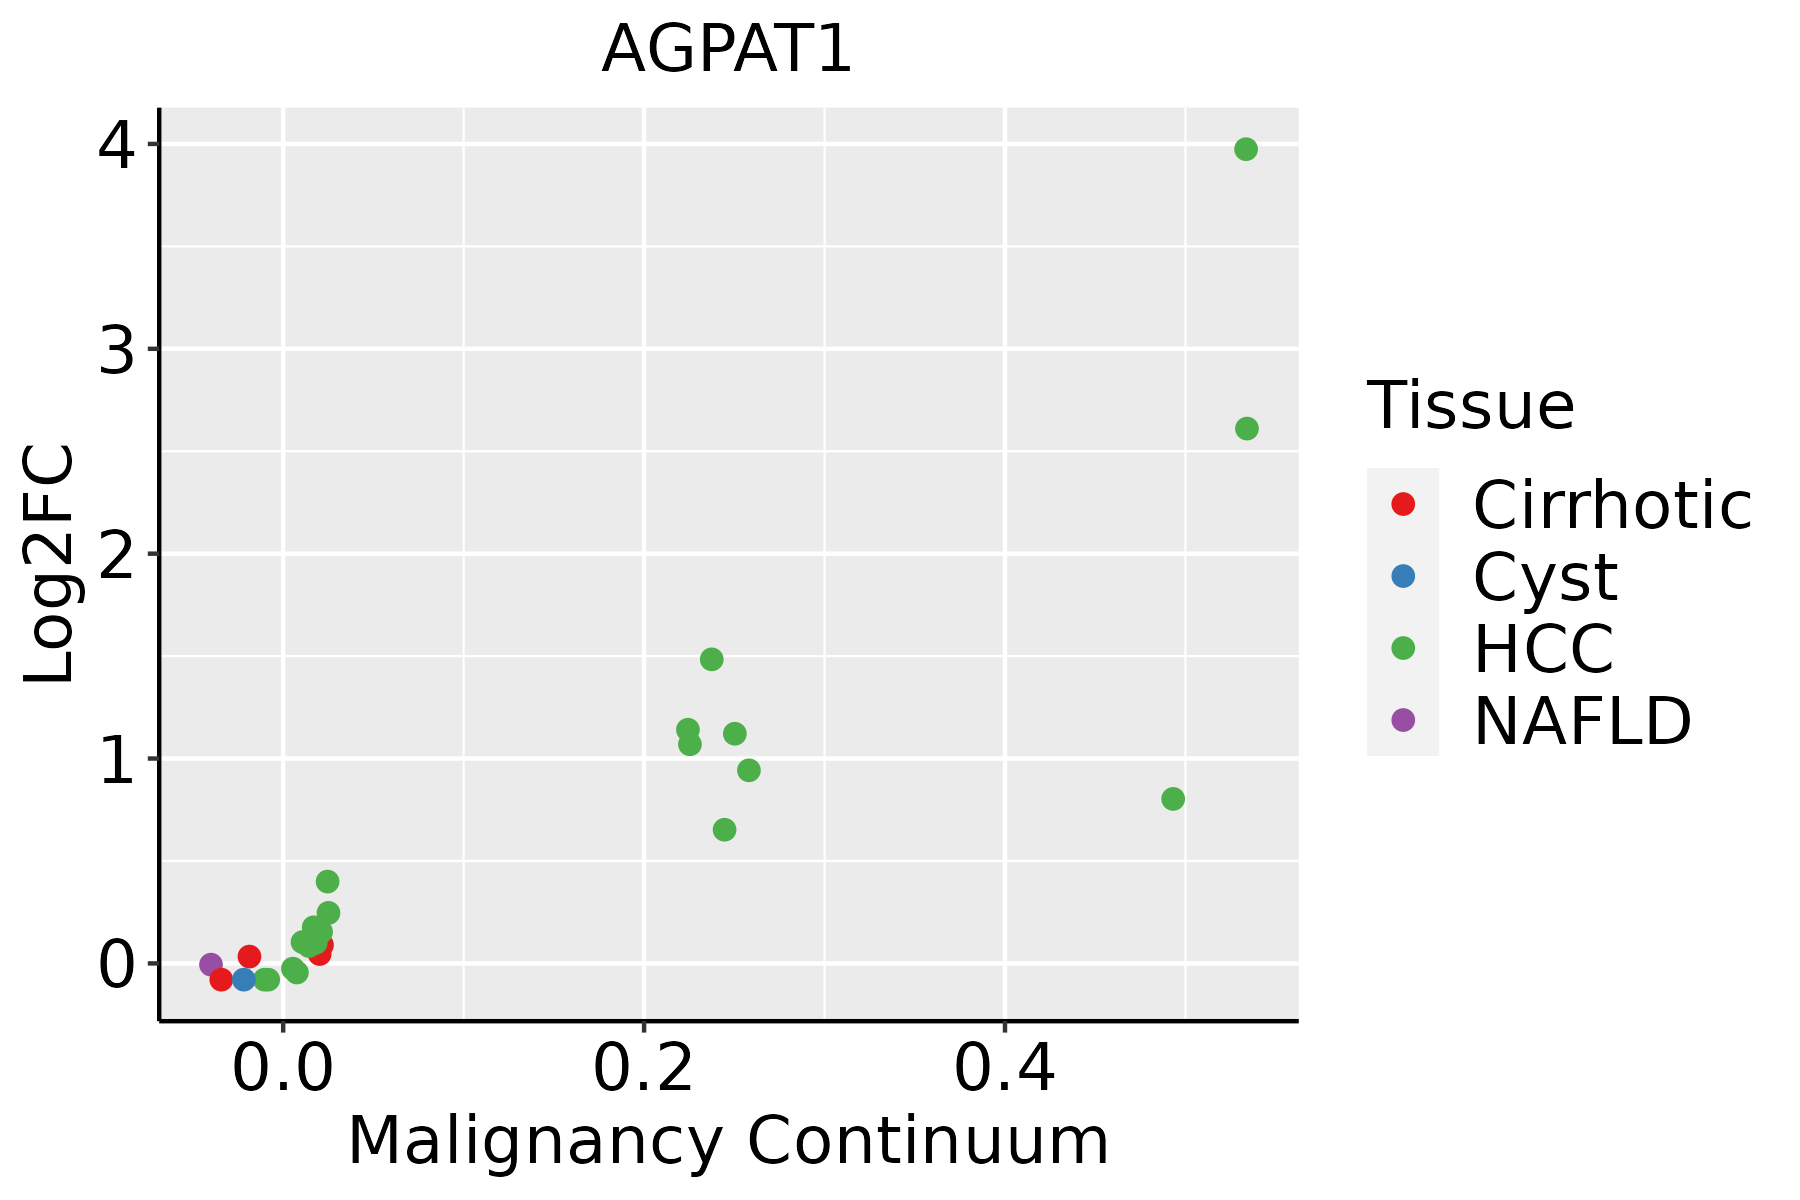 | HCC: Hepatocellular carcinoma |
| NAFLD: Non-alcoholic fatty liver disease | ||
| Oral Cavity | 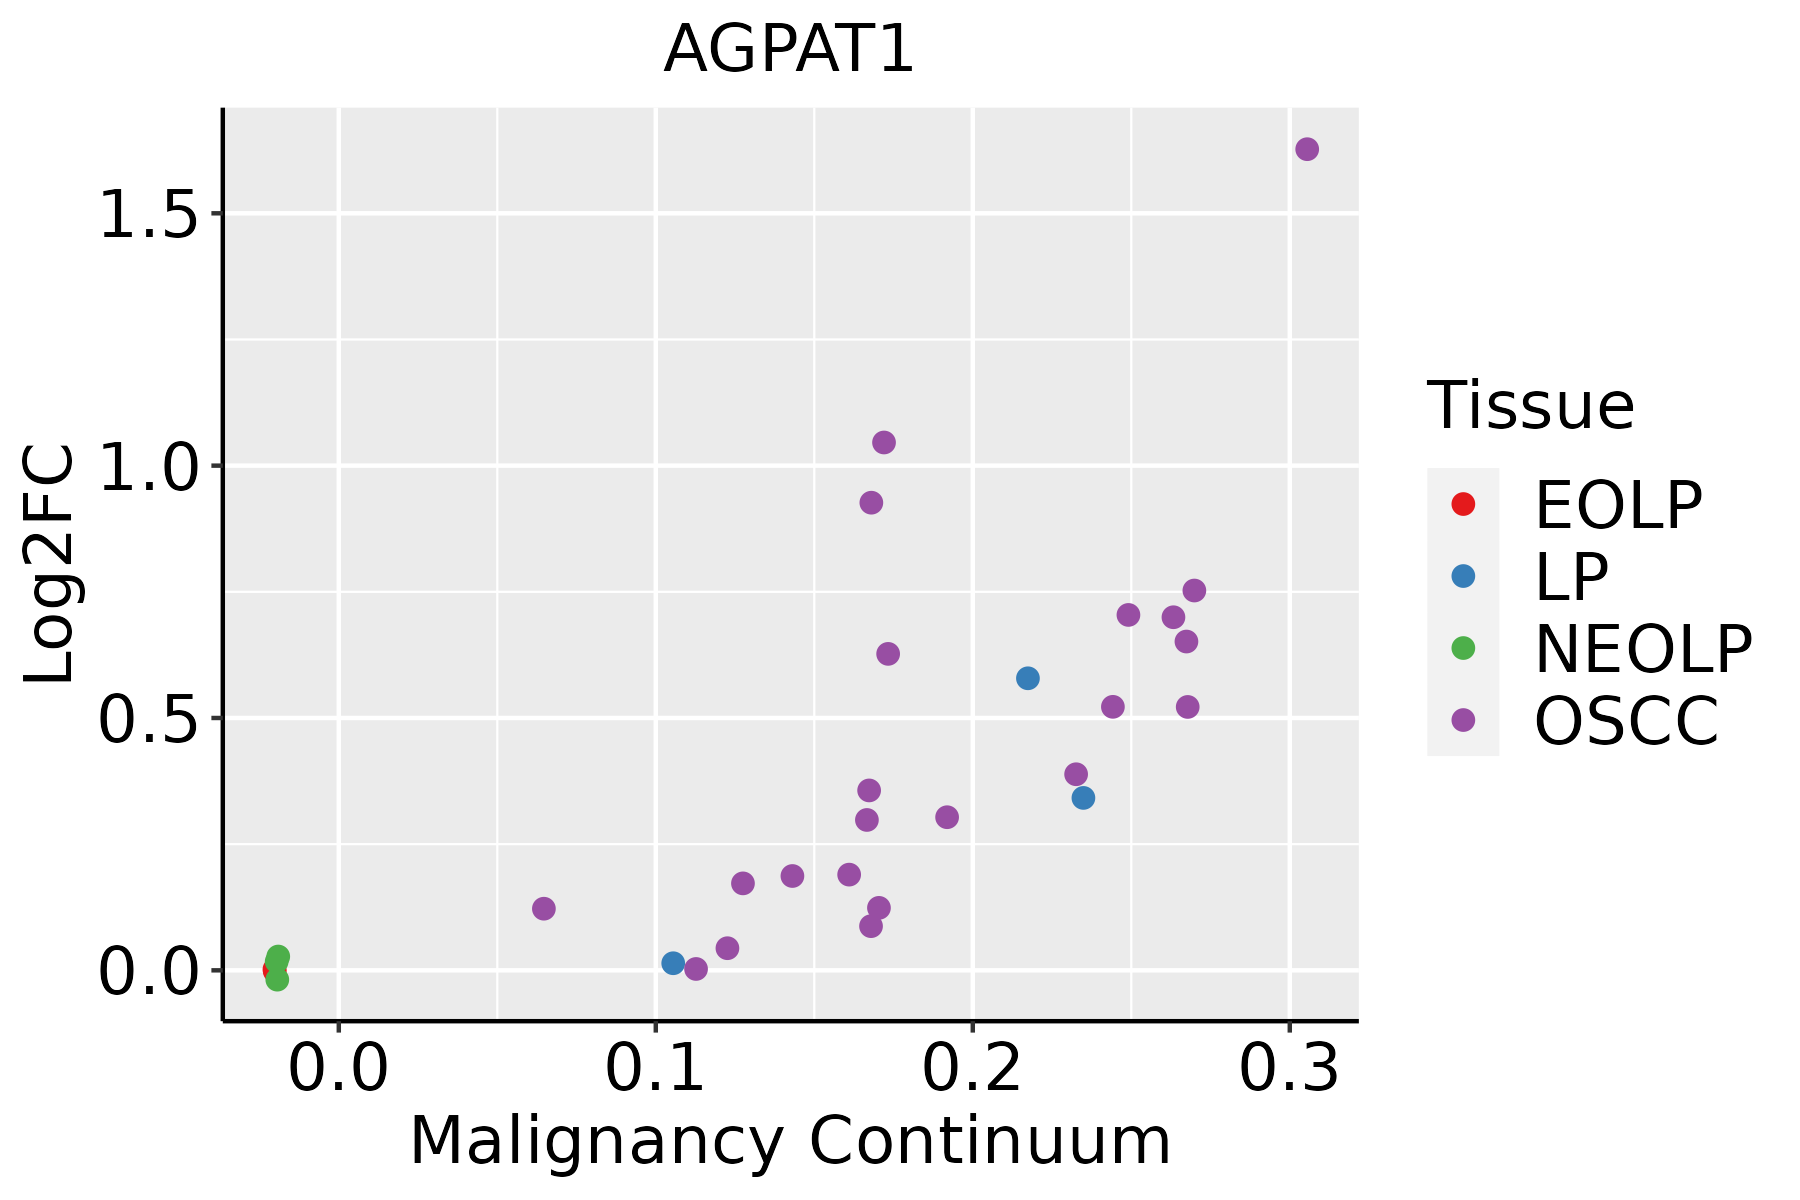 | EOLP: Erosive Oral lichen planus |
| LP: leukoplakia | ||
| NEOLP: Non-erosive oral lichen planus | ||
| OSCC: Oral squamous cell carcinoma |
| ∗log2FC in expression of this searched gene in stem-like cells from each diseased tissue sample relative to stem-like cells in normal samples in each tissue plotted against the malignancy continuum. Samples are colored based on if they are from different disease stage. |
Top |
Malignant transformation related pathway analysis |
| Find out the enriched GO biological processes and KEGG pathways involved in transition from healthy to precancer to cancer |
| Tissue | Disease Stage | Enriched GO biological Processes |
| Colorectum | AD |  |
| Colorectum | SER |  |
| Colorectum | MSS |  |
| Colorectum | MSI-H |  |
| Colorectum | FAP |  |
| ∗Top 15 enriched GO BP terms are showed in the bar plot of each disease state in each tissue. Each row represents a significant GO biological process which is colored according to the -log10(p.adjust). |
| Page: 1 2 3 4 5 6 7 8 9 |
| GO ID | Tissue | Disease Stage | Description | Gene Ratio | Bg Ratio | pvalue | p.adjust | Count |
| GO:00086544 | Esophagus | ESCC | phospholipid biosynthetic process | 162/8552 | 253/18723 | 2.59e-09 | 5.73e-08 | 162 |
| GO:00464744 | Esophagus | ESCC | glycerophospholipid biosynthetic process | 135/8552 | 211/18723 | 5.75e-08 | 1.02e-06 | 135 |
| GO:00450175 | Esophagus | ESCC | glycerolipid biosynthetic process | 154/8552 | 252/18723 | 5.20e-07 | 6.96e-06 | 154 |
| GO:00607595 | Esophagus | ESCC | regulation of response to cytokine stimulus | 103/8552 | 162/18723 | 3.14e-06 | 3.53e-05 | 103 |
| GO:00066446 | Esophagus | ESCC | phospholipid metabolic process | 218/8552 | 383/18723 | 5.37e-06 | 5.59e-05 | 218 |
| GO:00019595 | Esophagus | ESCC | regulation of cytokine-mediated signaling pathway | 95/8552 | 150/18723 | 9.48e-06 | 9.04e-05 | 95 |
| GO:00066505 | Esophagus | ESCC | glycerophospholipid metabolic process | 174/8552 | 306/18723 | 4.92e-05 | 3.85e-04 | 174 |
| GO:00066541 | Esophagus | ESCC | phosphatidic acid biosynthetic process | 26/8552 | 33/18723 | 1.06e-04 | 7.43e-04 | 26 |
| GO:00464733 | Esophagus | ESCC | phosphatidic acid metabolic process | 28/8552 | 37/18723 | 2.00e-04 | 1.26e-03 | 28 |
| GO:00019615 | Esophagus | ESCC | positive regulation of cytokine-mediated signaling pathway | 35/8552 | 50/18723 | 4.33e-04 | 2.44e-03 | 35 |
| GO:00607605 | Esophagus | ESCC | positive regulation of response to cytokine stimulus | 39/8552 | 57/18723 | 4.34e-04 | 2.44e-03 | 39 |
| GO:00464864 | Esophagus | ESCC | glycerolipid metabolic process | 211/8552 | 392/18723 | 6.51e-04 | 3.46e-03 | 211 |
| GO:000181916 | Esophagus | ESCC | positive regulation of cytokine production | 244/8552 | 467/18723 | 2.29e-03 | 1.01e-02 | 244 |
| GO:00463411 | Esophagus | ESCC | CDP-diacylglycerol metabolic process | 11/8552 | 14/18723 | 1.30e-02 | 4.27e-02 | 11 |
| GO:00086542 | Liver | HCC | phospholipid biosynthetic process | 150/7958 | 253/18723 | 4.77e-08 | 1.03e-06 | 150 |
| GO:00066444 | Liver | HCC | phospholipid metabolic process | 214/7958 | 383/18723 | 7.25e-08 | 1.48e-06 | 214 |
| GO:004648611 | Liver | HCC | glycerolipid metabolic process | 215/7958 | 392/18723 | 4.54e-07 | 7.49e-06 | 215 |
| GO:004501711 | Liver | HCC | glycerolipid biosynthetic process | 143/7958 | 252/18723 | 3.27e-06 | 4.31e-05 | 143 |
| GO:00066504 | Liver | HCC | glycerophospholipid metabolic process | 168/7958 | 306/18723 | 7.27e-06 | 8.62e-05 | 168 |
| GO:004647411 | Liver | HCC | glycerophospholipid biosynthetic process | 121/7958 | 211/18723 | 9.12e-06 | 1.06e-04 | 121 |
| Page: 1 2 |
| Pathway ID | Tissue | Disease Stage | Description | Gene Ratio | Bg Ratio | pvalue | p.adjust | qvalue | Count |
| hsa005615 | Liver | HCC | Glycerolipid metabolism | 41/4020 | 63/8465 | 3.59e-03 | 1.12e-02 | 6.22e-03 | 41 |
| hsa0056112 | Liver | HCC | Glycerolipid metabolism | 41/4020 | 63/8465 | 3.59e-03 | 1.12e-02 | 6.22e-03 | 41 |
| Page: 1 |
Top |
Cell-cell communication analysis |
| Identification of potential cell-cell interactions between two cell types and their ligand-receptor pairs for different disease states |
| Ligand | Receptor | LRpair | Pathway | Tissue | Disease Stage |
| Page: 1 |
Top |
Single-cell gene regulatory network inference analysis |
| Find out the significant the regulons (TFs) and the target genes of each regulon across cell types for different disease states |
| TF | Cell Type | Tissue | Disease Stage | Target Gene | RSS | Regulon Activity |
| ∗The dot plots of a searched regulon are shown for all cell subpopulations in each disease state of each tissue based on the regulon specific score inferred using pySCENIC and by calculating the average expression. |
| Page: 1 |
Top |
Somatic mutation of malignant transformation related genes |
| Annotation of somatic variants for genes involved in malignant transformation |
| Hugo Symbol | Variant Class | Variant Classification | dbSNP RS | HGVSc | HGVSp | HGVSp Short | SWISSPROT | BIOTYPE | SIFT | PolyPhen | Tumor Sample Barcode | Tissue | Histology | Sex | Age | Stage | Therapy Types | Drugs | Outcome |
| AGPAT1 | SNV | Missense_Mutation | c.664N>T | p.Arg222Cys | p.R222C | Q99943 | protein_coding | deleterious(0) | possibly_damaging(0.786) | TCGA-AA-3864-01 | Colorectum | colon adenocarcinoma | Male | >=65 | I/II | Unknown | Unknown | SD | |
| AGPAT1 | SNV | Missense_Mutation | novel | c.208N>T | p.Arg70Cys | p.R70C | Q99943 | protein_coding | tolerated(0.1) | benign(0.023) | TCGA-AA-3947-01 | Colorectum | colon adenocarcinoma | Female | <65 | I/II | Unknown | Unknown | SD |
| AGPAT1 | SNV | Missense_Mutation | novel | c.716C>T | p.Thr239Met | p.T239M | Q99943 | protein_coding | deleterious(0) | probably_damaging(0.996) | TCGA-AA-3950-01 | Colorectum | colon adenocarcinoma | Female | >=65 | I/II | Unknown | Unknown | SD |
| AGPAT1 | SNV | Missense_Mutation | novel | c.667C>T | p.Arg223Cys | p.R223C | Q99943 | protein_coding | deleterious(0.04) | possibly_damaging(0.786) | TCGA-AA-A00N-01 | Colorectum | colon adenocarcinoma | Male | >=65 | I/II | Unknown | Unknown | PD |
| AGPAT1 | SNV | Missense_Mutation | novel | c.340A>C | p.Met114Leu | p.M114L | Q99943 | protein_coding | deleterious(0.02) | benign(0.348) | TCGA-AM-5821-01 | Colorectum | colon adenocarcinoma | Female | >=65 | I/II | Unknown | Unknown | SD |
| AGPAT1 | SNV | Missense_Mutation | rs867669239 | c.739N>A | p.Val247Ile | p.V247I | Q99943 | protein_coding | tolerated(0.08) | benign(0.353) | TCGA-NH-A50V-01 | Colorectum | colon adenocarcinoma | Male | >=65 | III/IV | Chemotherapy | fluorouracil | CR |
| AGPAT1 | SNV | Missense_Mutation | novel | c.565N>T | p.Pro189Ser | p.P189S | Q99943 | protein_coding | deleterious(0.01) | probably_damaging(0.999) | TCGA-A5-A0G2-01 | Endometrium | uterine corpus endometrioid carcinoma | Female | <65 | III/IV | Unknown | Unknown | SD |
| AGPAT1 | SNV | Missense_Mutation | novel | c.45N>G | p.Phe15Leu | p.F15L | Q99943 | protein_coding | tolerated_low_confidence(0.59) | benign(0) | TCGA-AJ-A2QM-01 | Endometrium | uterine corpus endometrioid carcinoma | Female | >=65 | I/II | Chemotherapy | carboplatin | CR |
| AGPAT1 | SNV | Missense_Mutation | novel | c.479C>A | p.Ser160Tyr | p.S160Y | Q99943 | protein_coding | deleterious(0) | possibly_damaging(0.796) | TCGA-AX-A2HC-01 | Endometrium | uterine corpus endometrioid carcinoma | Female | <65 | III/IV | Chemotherapy | paclitaxel | PD |
| AGPAT1 | SNV | Missense_Mutation | novel | c.667N>T | p.Arg223Cys | p.R223C | Q99943 | protein_coding | deleterious(0.04) | possibly_damaging(0.786) | TCGA-EO-A22X-01 | Endometrium | uterine corpus endometrioid carcinoma | Female | <65 | III/IV | Unspecific | Carboplatin | Complete Response |
| Page: 1 2 3 |
Top |
Related drugs of malignant transformation related genes |
| Identification of chemicals and drugs interact with genes involved in malignant transfromation |
| (DGIdb 4.0) |
| Entrez ID | Symbol | Category | Interaction Types | Drug Claim Name | Drug Name | PMIDs |
| Page: 1 |

Copyright 2023-Present -The University of Texas Health Science Center at Houston |