
|
|||||
|
 | |
| |
| |
| |
| |
| |
|
Gene: AGO4 |
Gene summary for AGO4 |
| Gene information | Species | Human | Gene symbol | AGO4 | Gene ID | 192670 |
| Gene name | argonaute RISC component 4 | |
| Gene Alias | EIF2C4 | |
| Cytomap | 1p34.3 | |
| Gene Type | protein-coding | GO ID | GO:0000003 | UniProtAcc | Q9HCK5 |
Top |
Malignant transformation analysis |
| Identification of the aberrant gene expression in precancerous and cancerous lesions by comparing the gene expression of stem-like cells in diseased tissues with normal stem cells |
| Entrez ID | Symbol | Replicates | Species | Organ | Tissue | Adj P-value | Log2FC | Malignancy |
| 192670 | AGO4 | NAFLD1 | Human | Liver | NAFLD | 7.61e-07 | 6.35e-01 | -0.04 |
| 192670 | AGO4 | HCC1_Meng | Human | Liver | HCC | 6.22e-12 | -8.15e-04 | 0.0246 |
| 192670 | AGO4 | HCC2_Meng | Human | Liver | HCC | 3.25e-13 | 8.39e-02 | 0.0107 |
| 192670 | AGO4 | HCC2 | Human | Liver | HCC | 1.10e-05 | 1.71e+00 | 0.5341 |
| 192670 | AGO4 | S015 | Human | Liver | HCC | 4.58e-03 | 2.16e-01 | 0.2375 |
| 192670 | AGO4 | S028 | Human | Liver | HCC | 2.69e-04 | 2.91e-01 | 0.2503 |
| 192670 | AGO4 | S029 | Human | Liver | HCC | 1.72e-04 | 2.95e-01 | 0.2581 |
| 192670 | AGO4 | RNA-P6T2-P6T2-1 | Human | Lung | IAC | 5.53e-10 | 4.71e-01 | -0.0166 |
| 192670 | AGO4 | RNA-P6T2-P6T2-2 | Human | Lung | IAC | 1.99e-14 | 5.43e-01 | -0.0132 |
| 192670 | AGO4 | RNA-P6T2-P6T2-3 | Human | Lung | IAC | 3.65e-17 | 5.34e-01 | -0.013 |
| 192670 | AGO4 | RNA-P6T2-P6T2-4 | Human | Lung | IAC | 1.18e-15 | 5.73e-01 | -0.0121 |
| Page: 1 |
| Tissue | Expression Dynamics | Abbreviation |
| Liver | 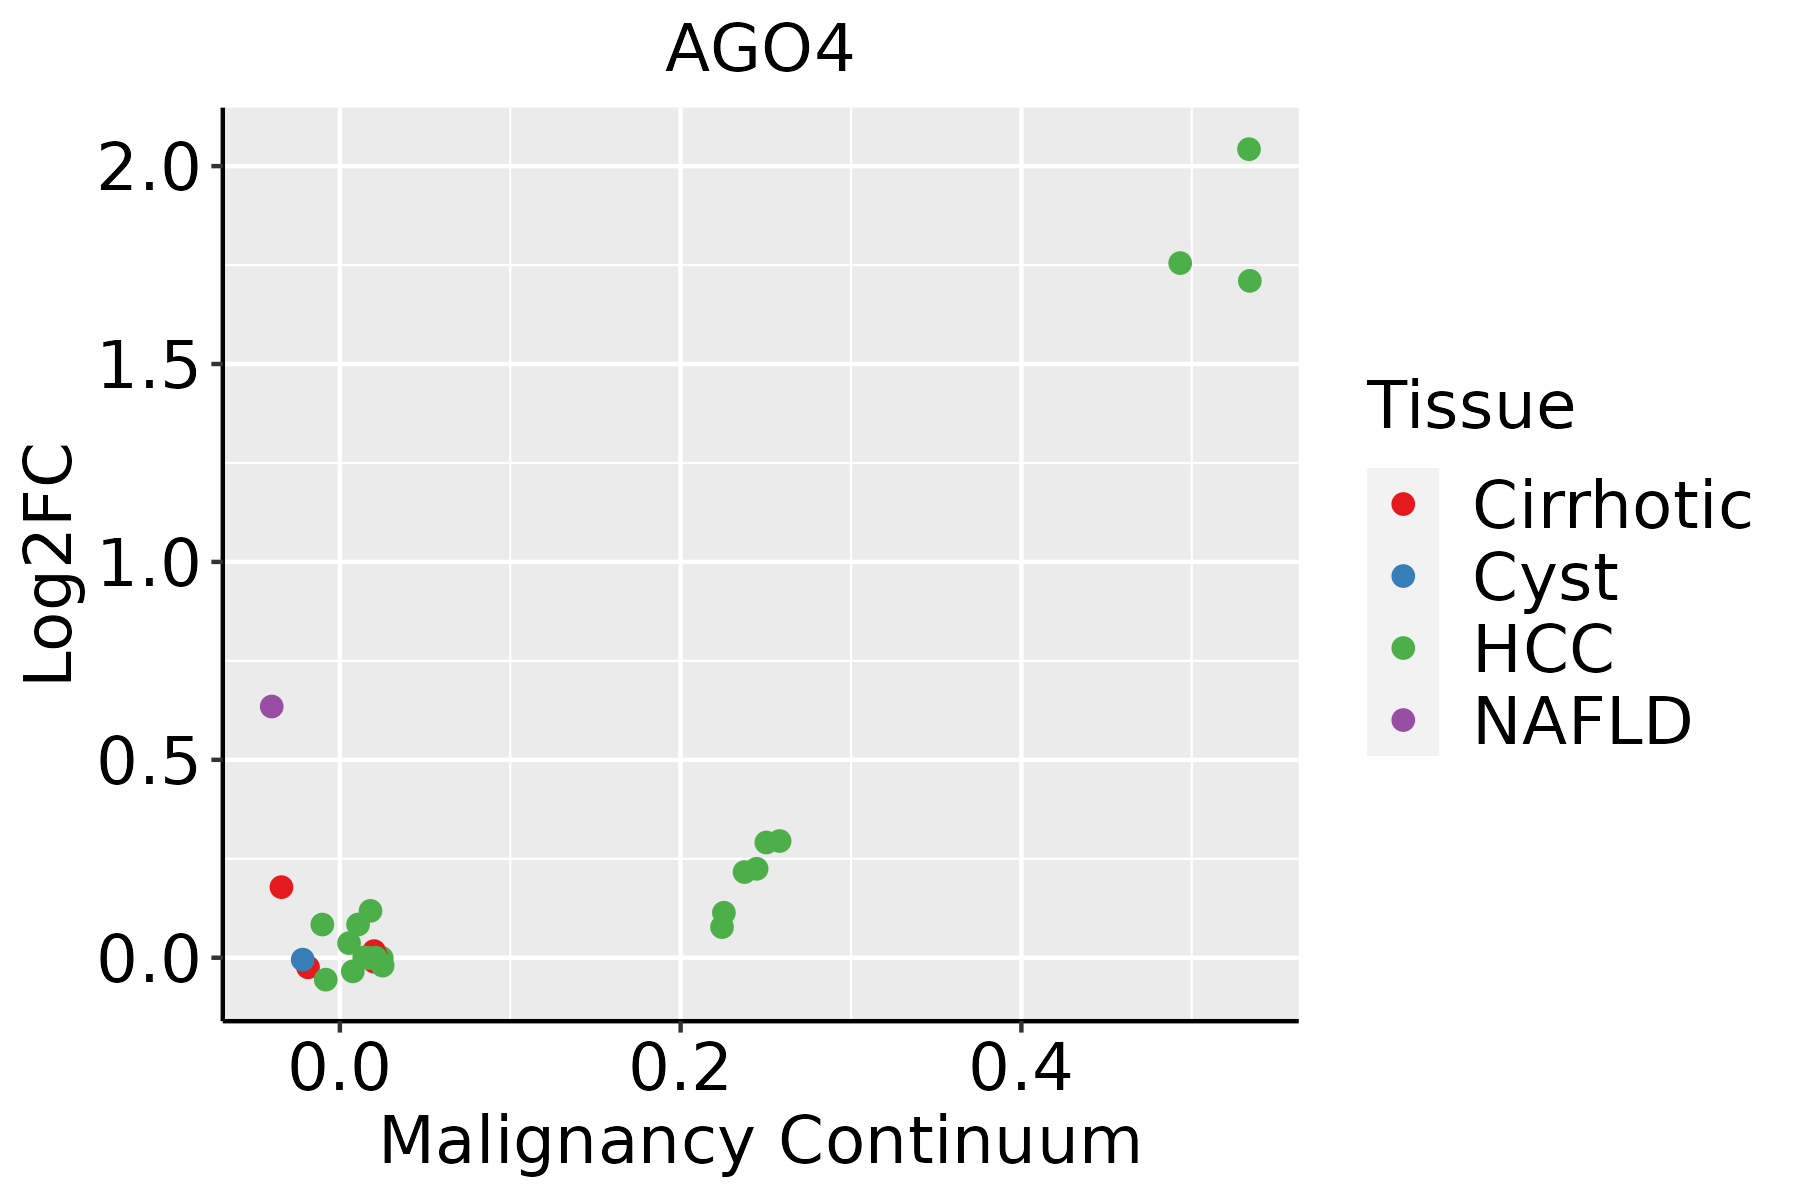 | HCC: Hepatocellular carcinoma |
| NAFLD: Non-alcoholic fatty liver disease | ||
| Lung | 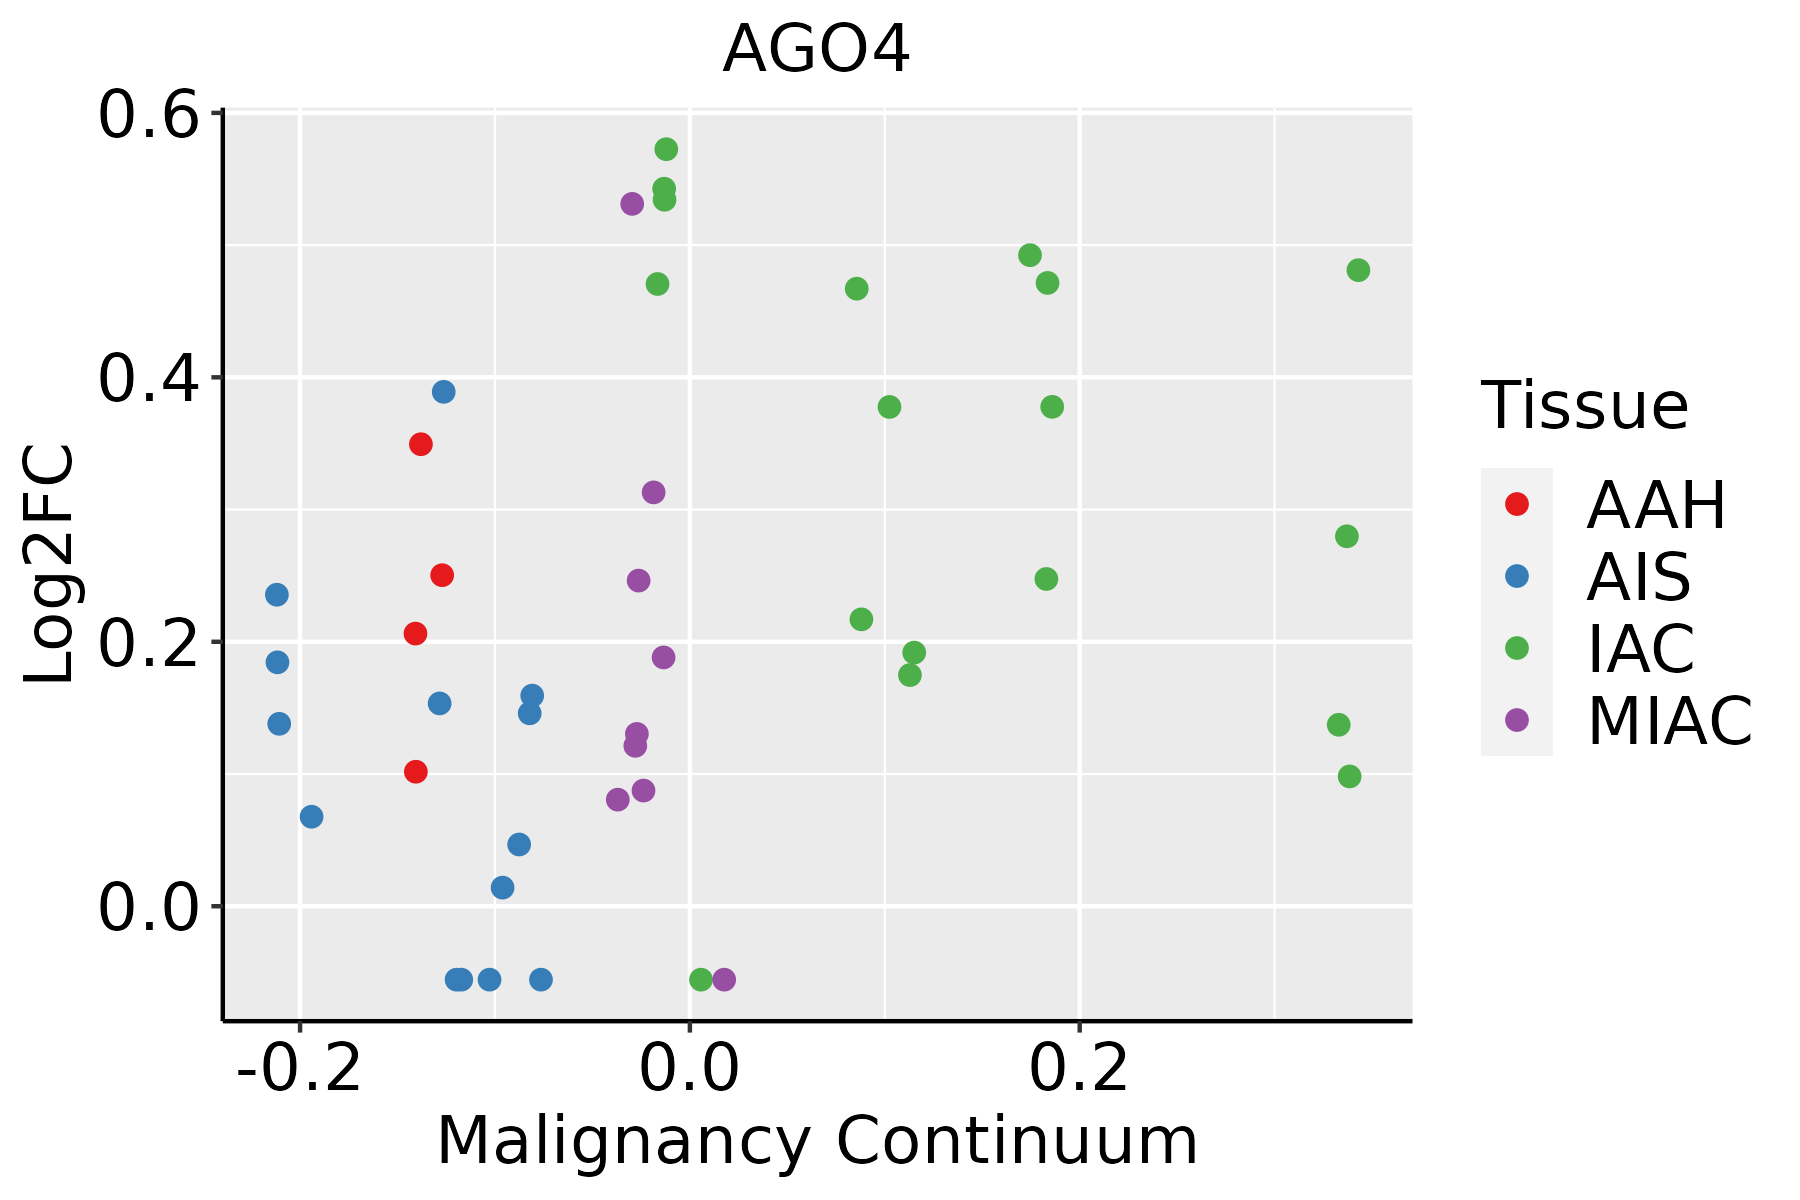 | AAH: Atypical adenomatous hyperplasia |
| AIS: Adenocarcinoma in situ | ||
| IAC: Invasive lung adenocarcinoma | ||
| MIA: Minimally invasive adenocarcinoma |
| ∗log2FC in expression of this searched gene in stem-like cells from each diseased tissue sample relative to stem-like cells in normal samples in each tissue plotted against the malignancy continuum. Samples are colored based on if they are from different disease stage. |
Top |
Malignant transformation related pathway analysis |
| Find out the enriched GO biological processes and KEGG pathways involved in transition from healthy to precancer to cancer |
| Tissue | Disease Stage | Enriched GO biological Processes |
| Colorectum | AD |  |
| Colorectum | SER |  |
| Colorectum | MSS |  |
| Colorectum | MSI-H |  |
| Colorectum | FAP |  |
| ∗Top 15 enriched GO BP terms are showed in the bar plot of each disease state in each tissue. Each row represents a significant GO biological process which is colored according to the -log10(p.adjust). |
| Page: 1 2 3 4 5 6 7 8 9 |
| GO ID | Tissue | Disease Stage | Description | Gene Ratio | Bg Ratio | pvalue | p.adjust | Count |
| GO:00194396 | Liver | NAFLD | aromatic compound catabolic process | 102/1882 | 467/18723 | 2.29e-14 | 1.91e-11 | 102 |
| GO:19013616 | Liver | NAFLD | organic cyclic compound catabolic process | 105/1882 | 495/18723 | 7.04e-14 | 5.15e-11 | 105 |
| GO:00442707 | Liver | NAFLD | cellular nitrogen compound catabolic process | 93/1882 | 451/18723 | 1.04e-11 | 4.34e-09 | 93 |
| GO:00467006 | Liver | NAFLD | heterocycle catabolic process | 92/1882 | 445/18723 | 1.16e-11 | 4.52e-09 | 92 |
| GO:00064026 | Liver | NAFLD | mRNA catabolic process | 56/1882 | 232/18723 | 3.49e-10 | 9.27e-08 | 56 |
| GO:00346556 | Liver | NAFLD | nucleobase-containing compound catabolic process | 80/1882 | 407/18723 | 3.07e-09 | 4.61e-07 | 80 |
| GO:00064016 | Liver | NAFLD | RNA catabolic process | 61/1882 | 278/18723 | 3.26e-09 | 4.76e-07 | 61 |
| GO:00064177 | Liver | NAFLD | regulation of translation | 85/1882 | 468/18723 | 4.58e-08 | 4.54e-06 | 85 |
| GO:00226047 | Liver | NAFLD | regulation of cell morphogenesis | 62/1882 | 309/18723 | 8.35e-08 | 7.09e-06 | 62 |
| GO:00226137 | Liver | NAFLD | ribonucleoprotein complex biogenesis | 76/1882 | 463/18723 | 1.19e-05 | 3.67e-04 | 76 |
| GO:00226187 | Liver | NAFLD | ribonucleoprotein complex assembly | 42/1882 | 220/18723 | 3.40e-05 | 8.80e-04 | 42 |
| GO:00718267 | Liver | NAFLD | ribonucleoprotein complex subunit organization | 42/1882 | 227/18723 | 7.21e-05 | 1.51e-03 | 42 |
| GO:00171483 | Liver | NAFLD | negative regulation of translation | 43/1882 | 245/18723 | 2.05e-04 | 3.56e-03 | 43 |
| GO:00342493 | Liver | NAFLD | negative regulation of cellular amide metabolic process | 46/1882 | 273/18723 | 3.27e-04 | 5.04e-03 | 46 |
| GO:00351964 | Liver | NAFLD | production of miRNAs involved in gene silencing by miRNA | 14/1882 | 52/18723 | 4.58e-04 | 6.71e-03 | 14 |
| GO:00310504 | Liver | NAFLD | dsRNA processing | 14/1882 | 54/18723 | 6.94e-04 | 8.88e-03 | 14 |
| GO:00709184 | Liver | NAFLD | production of small RNA involved in gene silencing by RNA | 14/1882 | 54/18723 | 6.94e-04 | 8.88e-03 | 14 |
| GO:00105863 | Liver | NAFLD | miRNA metabolic process | 9/1882 | 27/18723 | 8.96e-04 | 1.08e-02 | 9 |
| GO:0031054 | Liver | NAFLD | pre-miRNA processing | 6/1882 | 14/18723 | 1.51e-03 | 1.64e-02 | 6 |
| GO:00344704 | Liver | NAFLD | ncRNA processing | 57/1882 | 395/18723 | 3.34e-03 | 2.93e-02 | 57 |
| Page: 1 2 3 |
| Pathway ID | Tissue | Disease Stage | Description | Gene Ratio | Bg Ratio | pvalue | p.adjust | qvalue | Count |
| Page: 1 |
Top |
Cell-cell communication analysis |
| Identification of potential cell-cell interactions between two cell types and their ligand-receptor pairs for different disease states |
| Ligand | Receptor | LRpair | Pathway | Tissue | Disease Stage |
| Page: 1 |
Top |
Single-cell gene regulatory network inference analysis |
| Find out the significant the regulons (TFs) and the target genes of each regulon across cell types for different disease states |
| TF | Cell Type | Tissue | Disease Stage | Target Gene | RSS | Regulon Activity |
| ∗The dot plots of a searched regulon are shown for all cell subpopulations in each disease state of each tissue based on the regulon specific score inferred using pySCENIC and by calculating the average expression. |
| Page: 1 |
Top |
Somatic mutation of malignant transformation related genes |
| Annotation of somatic variants for genes involved in malignant transformation |
| Hugo Symbol | Variant Class | Variant Classification | dbSNP RS | HGVSc | HGVSp | HGVSp Short | SWISSPROT | BIOTYPE | SIFT | PolyPhen | Tumor Sample Barcode | Tissue | Histology | Sex | Age | Stage | Therapy Types | Drugs | Outcome |
| AGO4 | SNV | Missense_Mutation | rs140974452 | c.1978N>T | p.Arg660Cys | p.R660C | Q9HCK5 | protein_coding | deleterious(0.01) | possibly_damaging(0.901) | TCGA-A1-A0SO-01 | Breast | breast invasive carcinoma | Female | >=65 | I/II | Chemotherapy | SD | |
| AGO4 | SNV | Missense_Mutation | novel | c.1288N>G | p.Arg430Gly | p.R430G | Q9HCK5 | protein_coding | deleterious(0) | possibly_damaging(0.749) | TCGA-A2-A04P-01 | Breast | breast invasive carcinoma | Female | <65 | III/IV | Chemotherapy | taxol | PD |
| AGO4 | SNV | Missense_Mutation | novel | c.1255N>T | p.Val419Leu | p.V419L | Q9HCK5 | protein_coding | tolerated(0.44) | benign(0.001) | TCGA-A2-A0CS-01 | Breast | breast invasive carcinoma | Female | >=65 | III/IV | Hormone Therapy | anastrozole | SD |
| AGO4 | SNV | Missense_Mutation | novel | c.1070N>T | p.Ala357Val | p.A357V | Q9HCK5 | protein_coding | tolerated(0.38) | benign(0.13) | TCGA-AN-A04A-01 | Breast | breast invasive carcinoma | Female | <65 | III/IV | Unknown | Unknown | SD |
| AGO4 | SNV | Missense_Mutation | c.1994N>A | p.Arg665Gln | p.R665Q | Q9HCK5 | protein_coding | deleterious(0.03) | probably_damaging(0.97) | TCGA-AN-A0AM-01 | Breast | breast invasive carcinoma | Female | <65 | I/II | Unknown | Unknown | SD | |
| AGO4 | SNV | Missense_Mutation | c.1369N>A | p.Asp457Asn | p.D457N | Q9HCK5 | protein_coding | tolerated(0.42) | benign(0) | TCGA-AO-A124-01 | Breast | breast invasive carcinoma | Female | <65 | I/II | Chemotherapy | doxorubicin | SD | |
| AGO4 | SNV | Missense_Mutation | novel | c.1255N>T | p.Val419Leu | p.V419L | Q9HCK5 | protein_coding | tolerated(0.44) | benign(0.001) | TCGA-B6-A1KF-01 | Breast | breast invasive carcinoma | Female | >=65 | I/II | Unknown | Unknown | SD |
| AGO4 | SNV | Missense_Mutation | novel | c.1255N>T | p.Val419Leu | p.V419L | Q9HCK5 | protein_coding | tolerated(0.44) | benign(0.001) | TCGA-D8-A1JP-01 | Breast | breast invasive carcinoma | Female | >=65 | I/II | Hormone Therapy | tamoxiphen | SD |
| AGO4 | SNV | Missense_Mutation | novel | c.1255N>T | p.Val419Leu | p.V419L | Q9HCK5 | protein_coding | tolerated(0.44) | benign(0.001) | TCGA-D8-A1XG-01 | Breast | breast invasive carcinoma | Female | >=65 | III/IV | Unknown | Unknown | SD |
| AGO4 | SNV | Missense_Mutation | novel | c.1255N>T | p.Val419Leu | p.V419L | Q9HCK5 | protein_coding | tolerated(0.44) | benign(0.001) | TCGA-E2-A1L8-01 | Breast | breast invasive carcinoma | Female | <65 | I/II | Chemotherapy | cyclophosphamide | SD |
| Page: 1 2 3 4 5 6 7 8 9 10 11 |
Top |
Related drugs of malignant transformation related genes |
| Identification of chemicals and drugs interact with genes involved in malignant transfromation |
| (DGIdb 4.0) |
| Entrez ID | Symbol | Category | Interaction Types | Drug Claim Name | Drug Name | PMIDs |
| Page: 1 |

Copyright 2023-Present -The University of Texas Health Science Center at Houston |