Schematic overview of the cellular and molecular mechanisms involved in the cancer progression, including the proposed cellular and molecular mechanisms in cancer cells trajectory. AT1: alveolar type 1 cells; AT2: alveolar type 2 cells; AAH: atypical adenomatous hyperplasia; AIS: adenocarcinoma in situ; MIA: minimally invasive adenocarcinoma; IA: invasive adenocarcinoma; EMT: epithelial-mesenchymal transition

Home

Download

Statistics

Help

Contact

Center for Computational Systems Medicine
leaf

Gene summary

leaf

Malignant transformation analysis

leaf

Malignant transformation related pathway analysis

leaf

Cell-cell communication analysis

leaf

Single-cell gene regulatory network inference analysis

leaf

Somatic mutation of malignant transformation related genes

leaf

Related drugs of malignant transformation related genes

Gene: AGO2

Gene summary for AGO2

check button Gene summary.

Gene informationSpeciesHuman
Gene symbol

AGO2

Gene ID

27161

Gene nameargonaute RISC catalytic component 2
Gene AliasCASC7
Cytomap8q24.3
Gene Typeprotein-coding
GO ID

GO:0000003

UniProtAcc

Q9UKV8


Top

Malignant transformation analysis

check button Identification of the aberrant gene expression in precancerous and cancerous lesions by comparing the gene expression of stem-like cells in diseased tissues with normal stem cells
check button Malignant transformation involving gene list.
Entrez IDSymbolReplicatesSpeciesOrganTissueAdj P-valueLog2FCMalignancy
27161AGO2LZE4THumanEsophagusESCC1.10e-091.37e-020.0811
27161AGO2LZE7THumanEsophagusESCC1.50e-053.31e-010.0667
27161AGO2LZE8THumanEsophagusESCC6.48e-071.58e-010.067
27161AGO2LZE20THumanEsophagusESCC1.38e-081.23e-010.0662
27161AGO2LZE24THumanEsophagusESCC6.55e-072.37e-010.0596
27161AGO2LZE6THumanEsophagusESCC6.44e-03-3.04e-020.0845
27161AGO2P1T-EHumanEsophagusESCC1.00e-032.29e-010.0875
27161AGO2P2T-EHumanEsophagusESCC2.13e-224.05e-010.1177
27161AGO2P4T-EHumanEsophagusESCC1.15e-124.25e-010.1323
27161AGO2P5T-EHumanEsophagusESCC3.30e-101.93e-010.1327
27161AGO2P8T-EHumanEsophagusESCC3.33e-142.96e-010.0889
27161AGO2P9T-EHumanEsophagusESCC1.14e-152.87e-010.1131
27161AGO2P10T-EHumanEsophagusESCC7.01e-305.73e-010.116
27161AGO2P11T-EHumanEsophagusESCC3.57e-072.84e-010.1426
27161AGO2P12T-EHumanEsophagusESCC5.99e-225.36e-010.1122
27161AGO2P15T-EHumanEsophagusESCC8.69e-265.75e-010.1149
27161AGO2P16T-EHumanEsophagusESCC4.93e-256.66e-010.1153
27161AGO2P17T-EHumanEsophagusESCC1.94e-052.78e-010.1278
27161AGO2P20T-EHumanEsophagusESCC9.31e-172.60e-010.1124
27161AGO2P21T-EHumanEsophagusESCC6.28e-274.72e-010.1617
Page: 1 2 3 4 5 6 

check button Transcriptomic changes along malignancy continuum.
TissueExpression DynamicsAbbreviation
EsophagusThe image shows the transcriptomic changes along malignancy continuum.log2FC in expression of this searched gene in stem-like cells from each diseased tissue sample relative to stem-like cells in normal samples in each tissue plotted against the malignancy continuum. Samples are colored based on if they are from different disease stage.
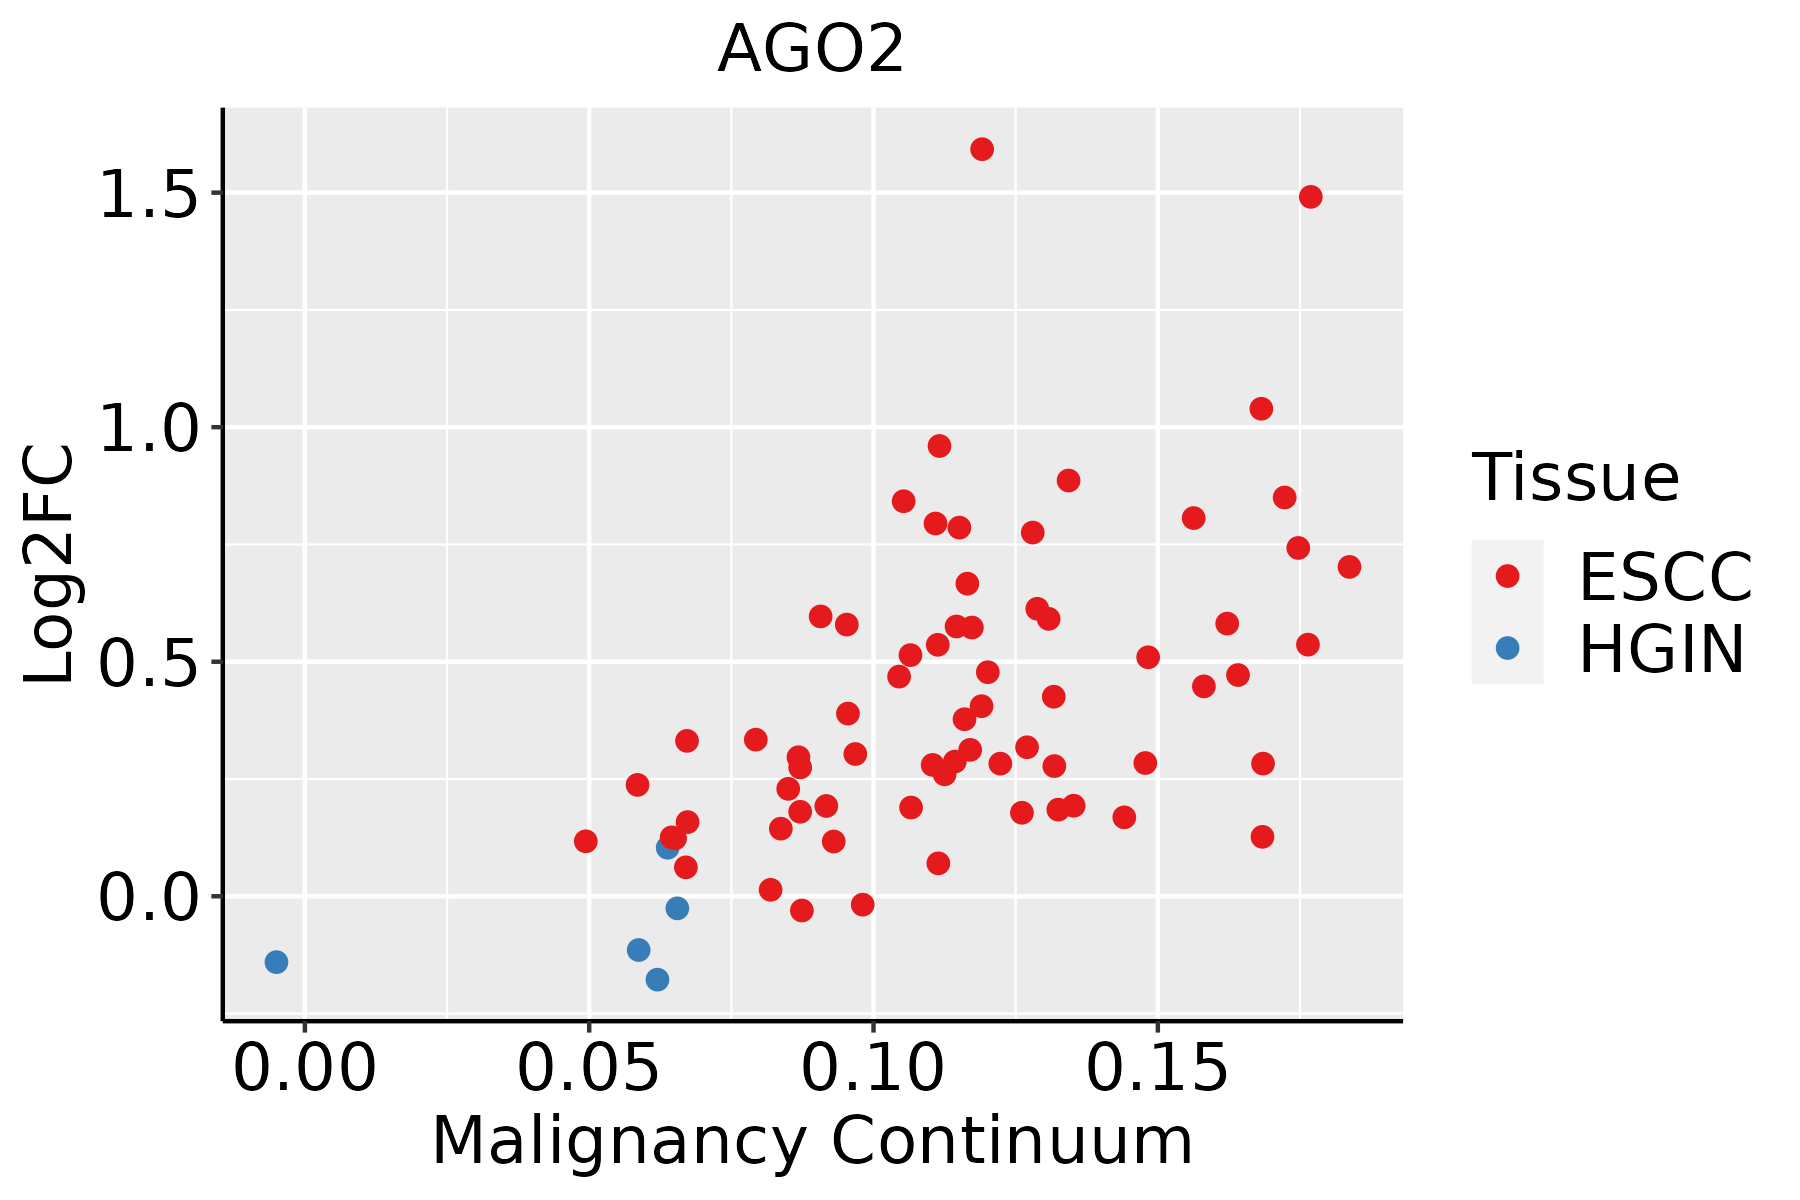
ESCC: Esophageal squamous cell carcinoma
HGIN: High-grade intraepithelial neoplasias
LGIN: Low-grade intraepithelial neoplasias
LiverThe image shows the transcriptomic changes along malignancy continuum.log2FC in expression of this searched gene in stem-like cells from each diseased tissue sample relative to stem-like cells in normal samples in each tissue plotted against the malignancy continuum. Samples are colored based on if they are from different disease stage.
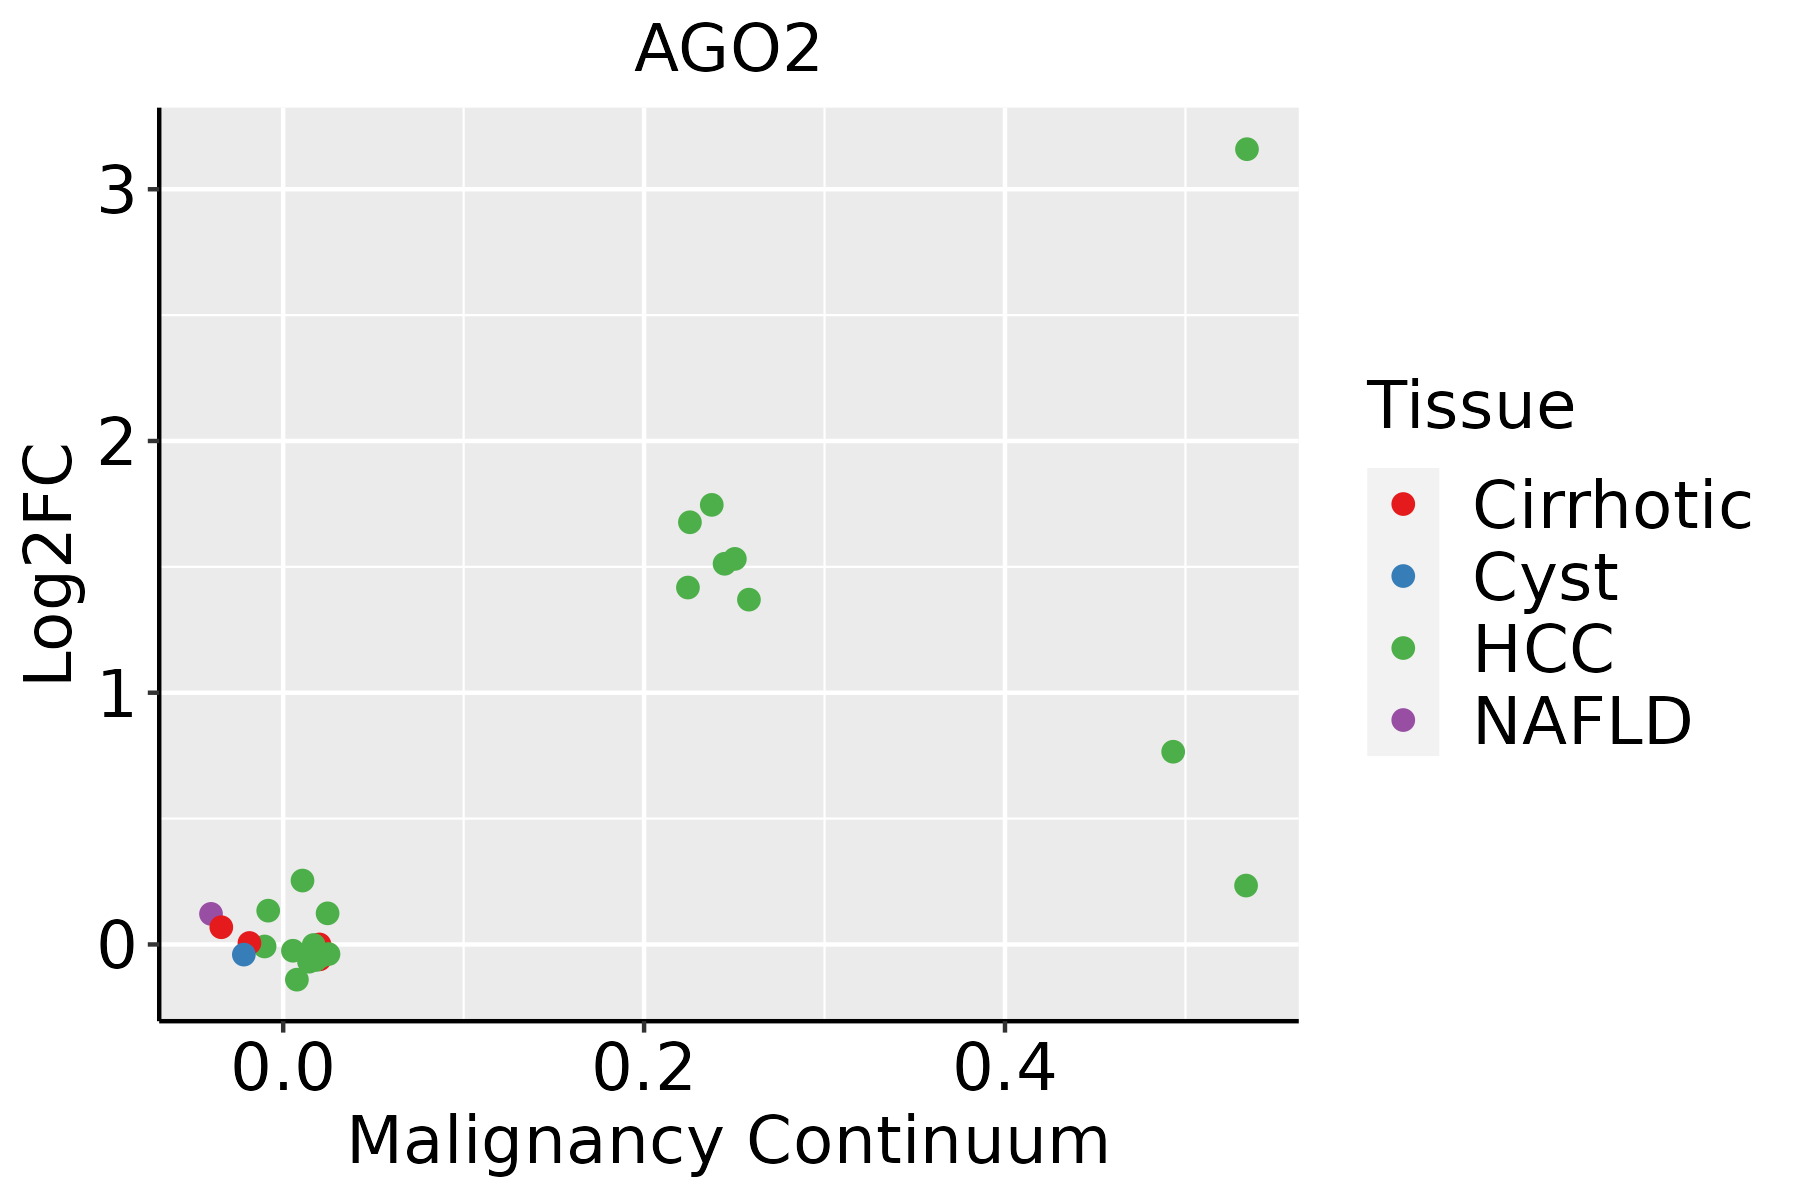
HCC: Hepatocellular carcinoma
NAFLD: Non-alcoholic fatty liver disease
Oral CavityThe image shows the transcriptomic changes along malignancy continuum.log2FC in expression of this searched gene in stem-like cells from each diseased tissue sample relative to stem-like cells in normal samples in each tissue plotted against the malignancy continuum. Samples are colored based on if they are from different disease stage.EOLP: Erosive Oral lichen planus
LP: leukoplakia
NEOLP: Non-erosive oral lichen planus
OSCC: Oral squamous cell carcinoma
ProstateThe image shows the transcriptomic changes along malignancy continuum.log2FC in expression of this searched gene in stem-like cells from each diseased tissue sample relative to stem-like cells in normal samples in each tissue plotted against the malignancy continuum. Samples are colored based on if they are from different disease stage.
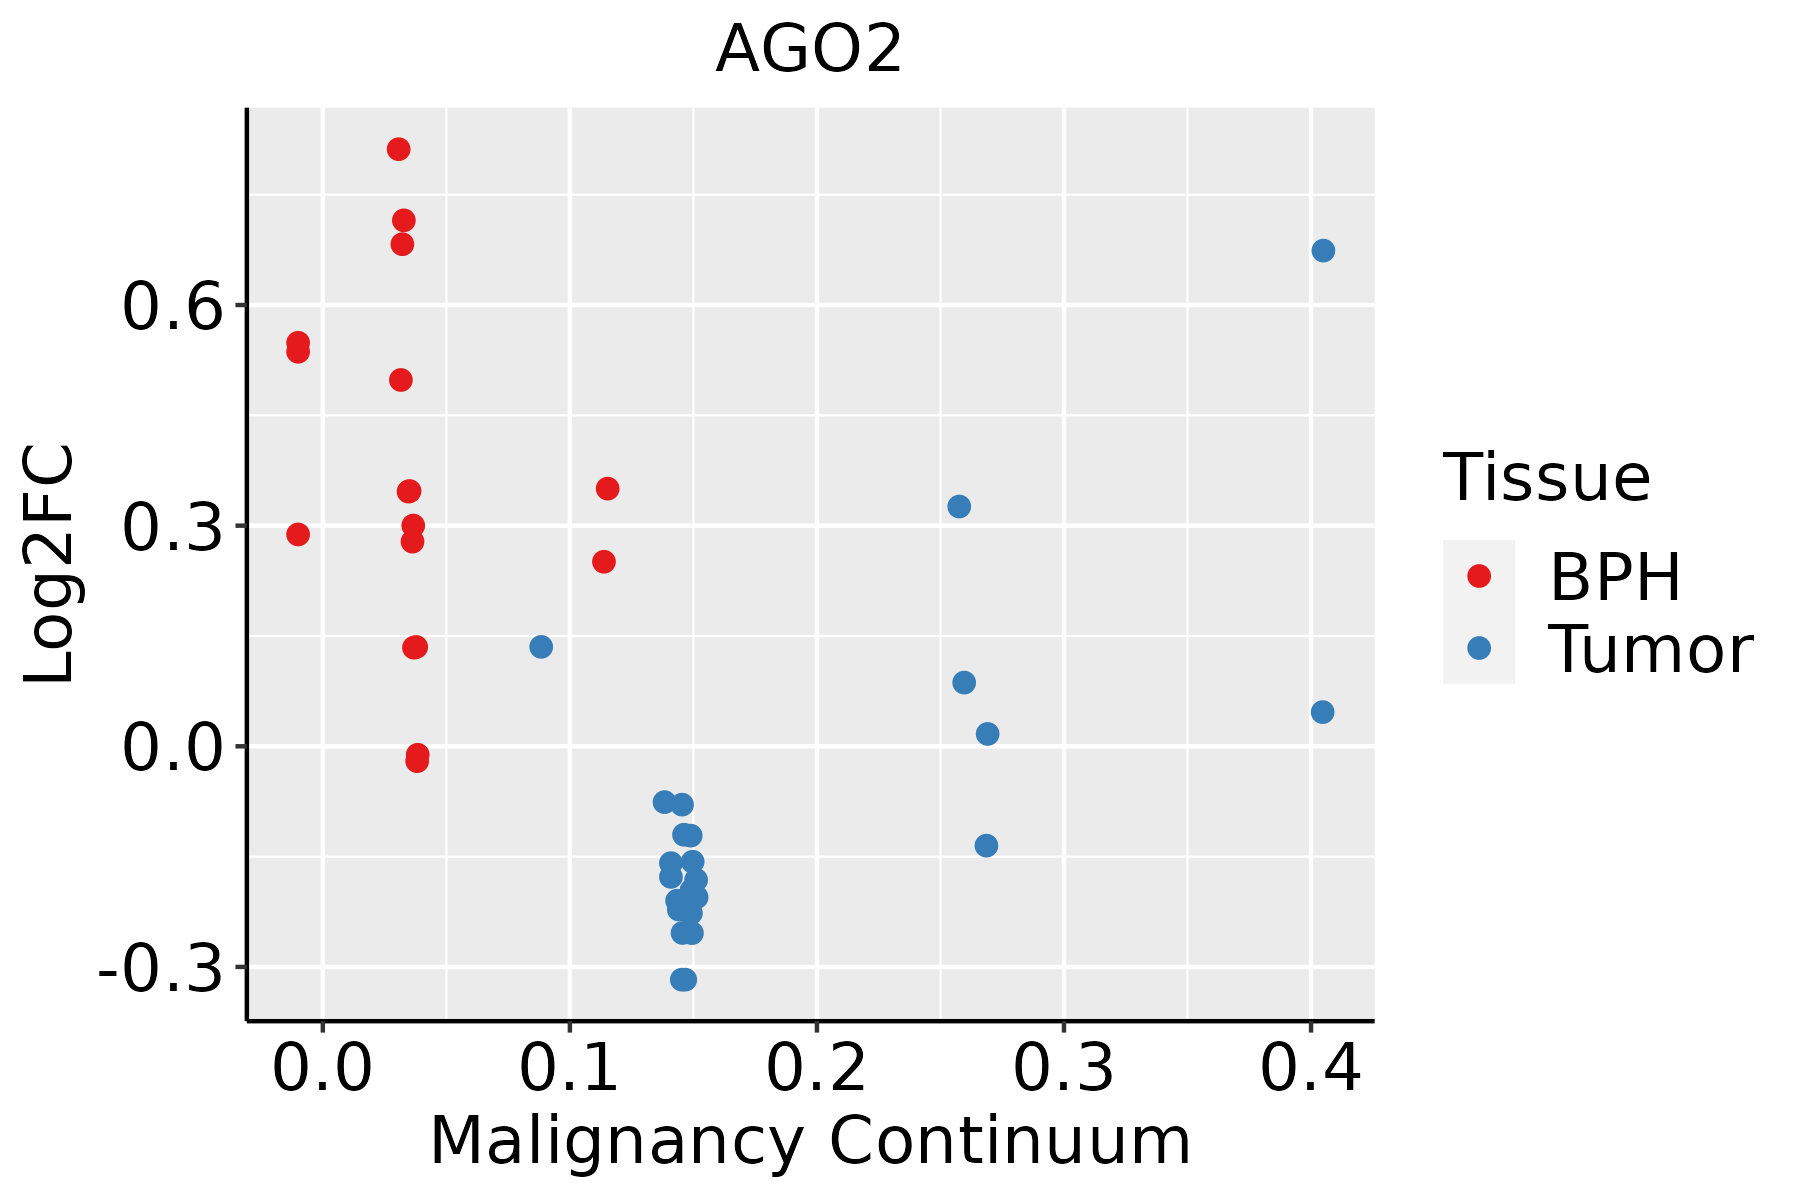
BPH: Benign Prostatic Hyperplasia
ThyroidThe image shows the transcriptomic changes along malignancy continuum.log2FC in expression of this searched gene in stem-like cells from each diseased tissue sample relative to stem-like cells in normal samples in each tissue plotted against the malignancy continuum. Samples are colored based on if they are from different disease stage.ATC: Anaplastic thyroid cancer
HT: Hashimoto's thyroiditis
PTC: Papillary thyroid cancer
∗log2FC in expression of this searched gene in stem-like cells from each diseased tissue sample relative to stem-like cells in normal samples in each tissue plotted against the malignancy continuum. Samples are colored based on if they are from different disease stage.

Top

Malignant transformation related pathway analysis

check buttonFind out the enriched GO biological processes and KEGG pathways involved in transition from healthy to precancer to cancer
check button Figure of enriched GO biological processes.
TissueDisease StageEnriched GO biological Processes
ColorectumADGO analysis - Figure of enriched GO biological processes: Top 15 enriched GO BP terms are showed in the bar plot of each disease state in each tissue. Each row represents a significant GO biological process which is colored according to the -log10(p.adjust).
ColorectumSERGO analysis - Figure of enriched GO biological processes: Top 15 enriched GO BP terms are showed in the bar plot of each disease state in each tissue. Each row represents a significant GO biological process which is colored according to the -log10(p.adjust).
ColorectumMSSGO analysis - Figure of enriched GO biological processes: Top 15 enriched GO BP terms are showed in the bar plot of each disease state in each tissue. Each row represents a significant GO biological process which is colored according to the -log10(p.adjust).
ColorectumMSI-HGO analysis - Figure of enriched GO biological processes: Top 15 enriched GO BP terms are showed in the bar plot of each disease state in each tissue. Each row represents a significant GO biological process which is colored according to the -log10(p.adjust).
ColorectumFAPGO analysis - Figure of enriched GO biological processes: Top 15 enriched GO BP terms are showed in the bar plot of each disease state in each tissue. Each row represents a significant GO biological process which is colored according to the -log10(p.adjust).
∗Top 15 enriched GO BP terms are showed in the bar plot of each disease state in each tissue. Each row represents a significant GO biological process which is colored according to the -log10(p.adjust).
Page: 1 2 3 4 5 6 7 8 9 

check button Enriched GO biological processes.
GO IDTissueDisease StageDescriptionGene RatioBg Ratiopvaluep.adjustCount
GO:0022613111EsophagusESCCribonucleoprotein complex biogenesis365/8552463/187231.74e-491.11e-45365
GO:003447015EsophagusESCCncRNA processing300/8552395/187233.09e-353.26e-32300
GO:003466012EsophagusESCCncRNA metabolic process346/8552485/187234.35e-312.51e-28346
GO:0009896111EsophagusESCCpositive regulation of catabolic process332/8552492/187234.36e-239.22e-21332
GO:0031331111EsophagusESCCpositive regulation of cellular catabolic process292/8552427/187238.67e-221.53e-19292
GO:1903311110EsophagusESCCregulation of mRNA metabolic process210/8552288/187233.25e-215.56e-19210
GO:0006401110EsophagusESCCRNA catabolic process204/8552278/187233.39e-215.66e-19204
GO:0006413110EsophagusESCCtranslational initiation100/8552118/187231.16e-181.25e-16100
GO:0034655110EsophagusESCCnucleobase-containing compound catabolic process272/8552407/187232.92e-182.90e-16272
GO:0006402110EsophagusESCCmRNA catabolic process170/8552232/187238.70e-188.00e-16170
GO:0006417111EsophagusESCCregulation of translation304/8552468/187231.53e-171.33e-15304
GO:0071826111EsophagusESCCribonucleoprotein complex subunit organization166/8552227/187232.94e-172.42e-15166
GO:0022618111EsophagusESCCribonucleoprotein complex assembly159/8552220/187238.19e-165.71e-14159
GO:004670018EsophagusESCCheterocycle catabolic process286/8552445/187231.12e-157.47e-14286
GO:0045727111EsophagusESCCpositive regulation of translation107/8552136/187232.79e-151.68e-13107
GO:004427019EsophagusESCCcellular nitrogen compound catabolic process288/8552451/187233.03e-151.79e-13288
GO:0034250111EsophagusESCCpositive regulation of cellular amide metabolic process123/8552162/187233.32e-151.93e-13123
GO:001943918EsophagusESCCaromatic compound catabolic process295/8552467/187231.09e-145.98e-13295
GO:190136118EsophagusESCCorganic cyclic compound catabolic process307/8552495/187239.99e-144.80e-12307
GO:000095618EsophagusESCCnuclear-transcribed mRNA catabolic process88/8552112/187239.41e-134.14e-1188
Page: 1 2 3 4 5 6 7 8 9 10 11 12 13 14 15 16 17 18 19 20 21 22 23 24 25 26 27 

check button Enriched KEGG pathways.
Pathway IDTissueDisease StageDescriptionGene RatioBg Ratiopvaluep.adjustqvalueCount
Page: 1 

Top

Cell-cell communication analysis

check buttonIdentification of potential cell-cell interactions between two cell types and their ligand-receptor pairs for different disease states
LigandReceptorLRpairPathwayTissueDisease Stage
Page: 1 

Top

Single-cell gene regulatory network inference analysis

check buttonFind out the significant the regulons (TFs) and the target genes of each regulon across cell types for different disease states
TFCell TypeTissueDisease StageTarget GeneRSSRegulon Activity
∗The dot plots of a searched regulon are shown for all cell subpopulations in each disease state of each tissue based on the regulon specific score inferred using pySCENIC and by calculating the average expression.
Page: 1 

Top

Somatic mutation of malignant transformation related genes

check buttonAnnotation of somatic variants for genes involved in malignant transformation
Hugo SymbolVariant ClassVariant ClassificationdbSNP RSHGVScHGVSpHGVSp ShortSWISSPROTBIOTYPESIFTPolyPhenTumor Sample BarcodeTissueHistologySexAgeStageTherapy TypesDrugsOutcome
AGO2SNVMissense_Mutationc.1378N>Tp.Arg460Cysp.R460CQ9UKV8protein_codingdeleterious(0)possibly_damaging(0.674)TCGA-A2-A0CV-01Breastbreast invasive carcinomaFemale<65I/IIChemotherapycytoxanSD
AGO2SNVMissense_Mutationc.1103C>Gp.Thr368Serp.T368SQ9UKV8protein_codingtolerated(0.1)possibly_damaging(0.626)TCGA-A2-A0CW-01Breastbreast invasive carcinomaFemale>=65I/IIHormone TherapyanastrozoleSD
AGO2SNVMissense_Mutationc.614N>Tp.Ser205Phep.S205FQ9UKV8protein_codingdeleterious(0)probably_damaging(0.999)TCGA-A2-A0SY-01Breastbreast invasive carcinomaFemale<65III/IVHormone TherapyarimidexSD
AGO2SNVMissense_Mutationrs866981753c.2140N>Tp.Arg714Trpp.R714WQ9UKV8protein_codingdeleterious(0)probably_damaging(1)TCGA-A7-A4SC-01Breastbreast invasive carcinomaFemale<65I/IIHormone TherapytamoxiphenSD
AGO2SNVMissense_Mutationc.2149T>Ap.Cys717Serp.C717SQ9UKV8protein_codingtolerated(0.13)benign(0.271)TCGA-AQ-A04H-01Breastbreast invasive carcinomaFemale<65III/IVChemotherapytaxotereSD
AGO2SNVMissense_Mutationnovelc.1981N>Ap.Pro661Thrp.P661TQ9UKV8protein_codingdeleterious(0.01)probably_damaging(1)TCGA-C8-A26X-01Breastbreast invasive carcinomaFemale<65I/IIChemotherapy5-fluorouracilCR
AGO2SNVMissense_Mutationc.931N>Cp.Tyr311Hisp.Y311HQ9UKV8protein_codingdeleterious(0.02)possibly_damaging(0.857)TCGA-D8-A1XK-01Breastbreast invasive carcinomaFemale<65I/IIChemotherapydoxorubicine+cyclophosphamideSD
AGO2SNVMissense_Mutationnovelc.2165N>Tp.Glu722Valp.E722VQ9UKV8protein_codingdeleterious(0)possibly_damaging(0.811)TCGA-E2-A15M-01Breastbreast invasive carcinomaFemale>=65I/IIHormone TherapyarimidexSD
AGO2SNVMissense_Mutationnovelc.1940N>Ap.Arg647Hisp.R647HQ9UKV8protein_codingdeleterious(0)probably_damaging(0.932)TCGA-EW-A3E8-01Breastbreast invasive carcinomaFemale<65I/IIHormone TherapyanastrozoleSD
AGO2SNVMissense_Mutationc.1250N>Ap.Ser417Tyrp.S417YQ9UKV8protein_codingtolerated(0.09)benign(0.308)TCGA-EK-A3GK-01Cervixcervical & endocervical cancerFemale<65I/IIUnknownUnknownSD
Page: 1 2 3 4 5 6 7 8 9 10 11 12 

Top

Related drugs of malignant transformation related genes

check buttonIdentification of chemicals and drugs interact with genes involved in malignant transfromation
(DGIdb 4.0)
Entrez IDSymbolCategoryInteraction TypesDrug Claim NameDrug NamePMIDs
Page: 1