| Tissue | Expression Dynamics | Abbreviation |
| Cervix | 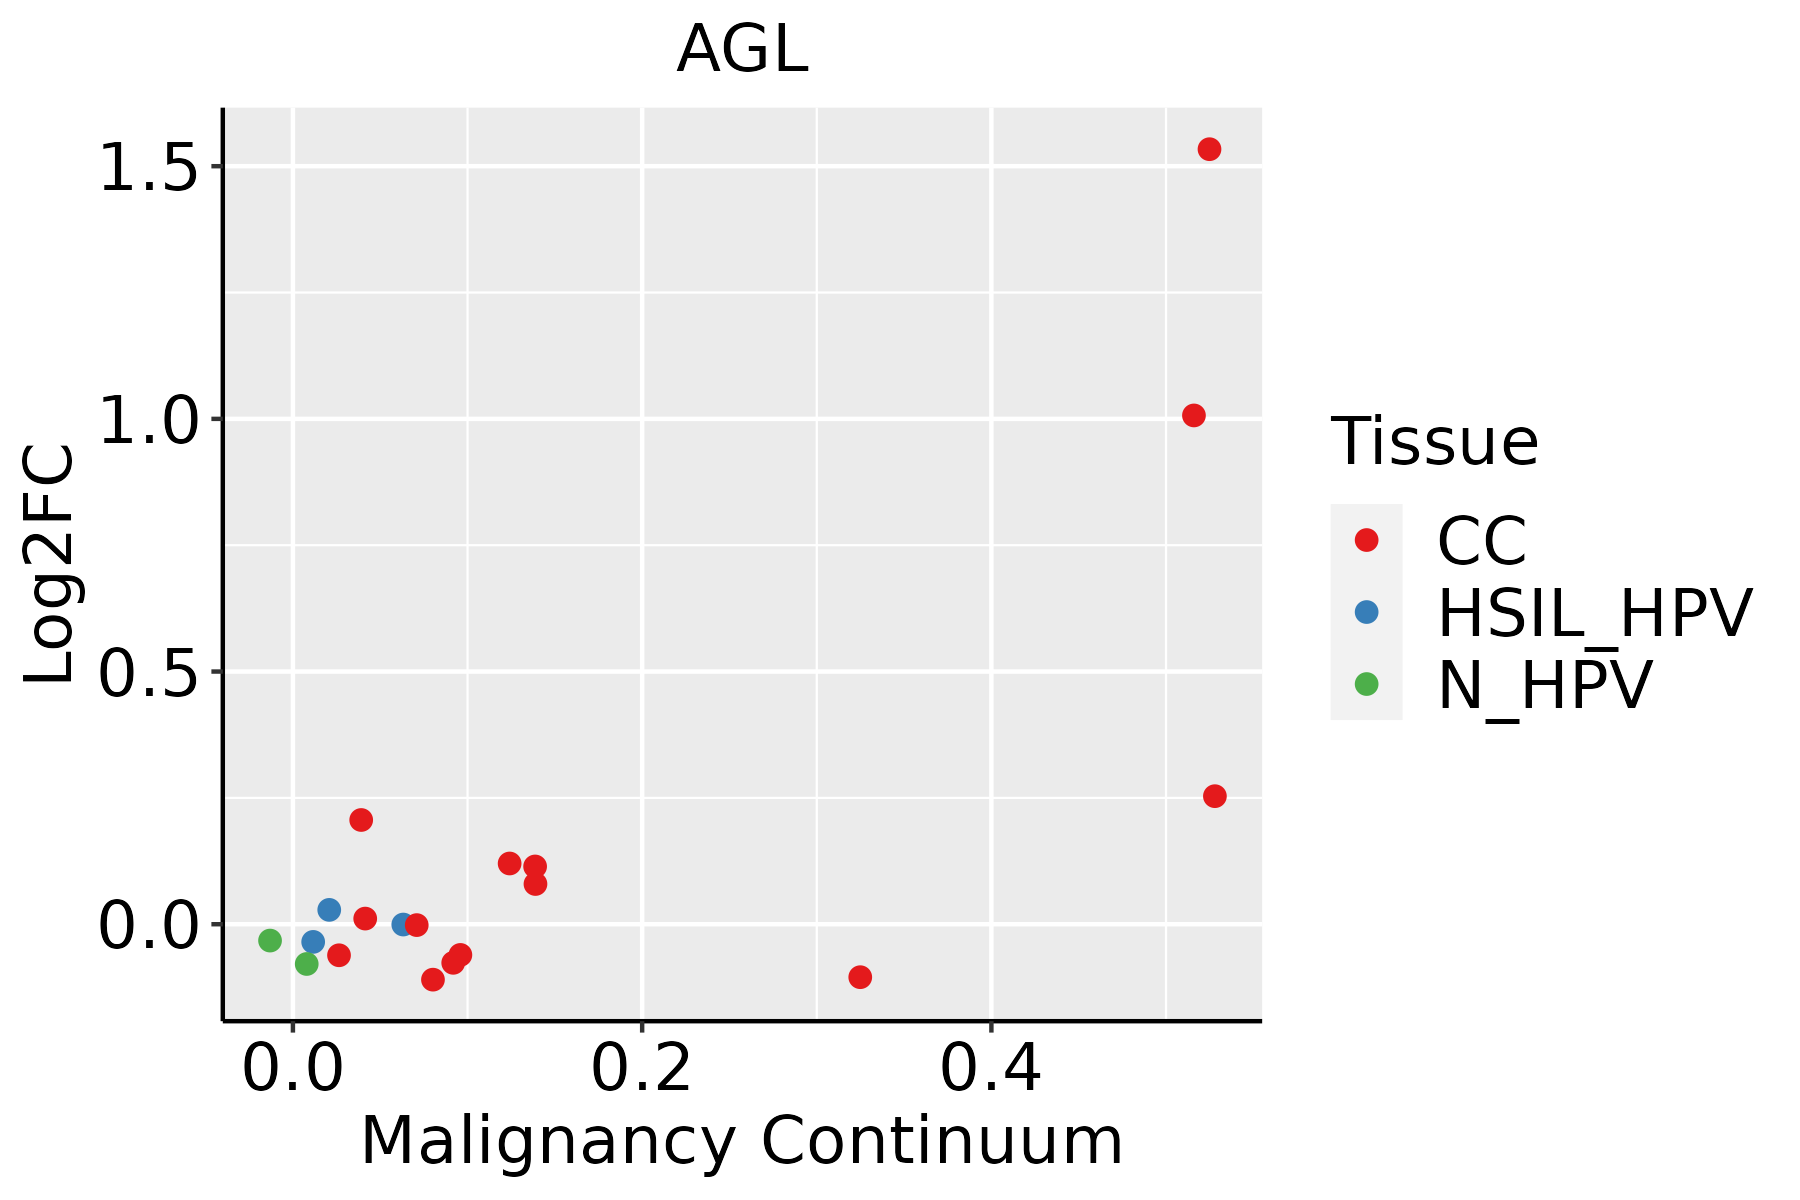 | CC: Cervix cancer |
| HSIL_HPV: HPV-infected high-grade squamous intraepithelial lesions |
| N_HPV: HPV-infected normal cervix |
| Esophagus | 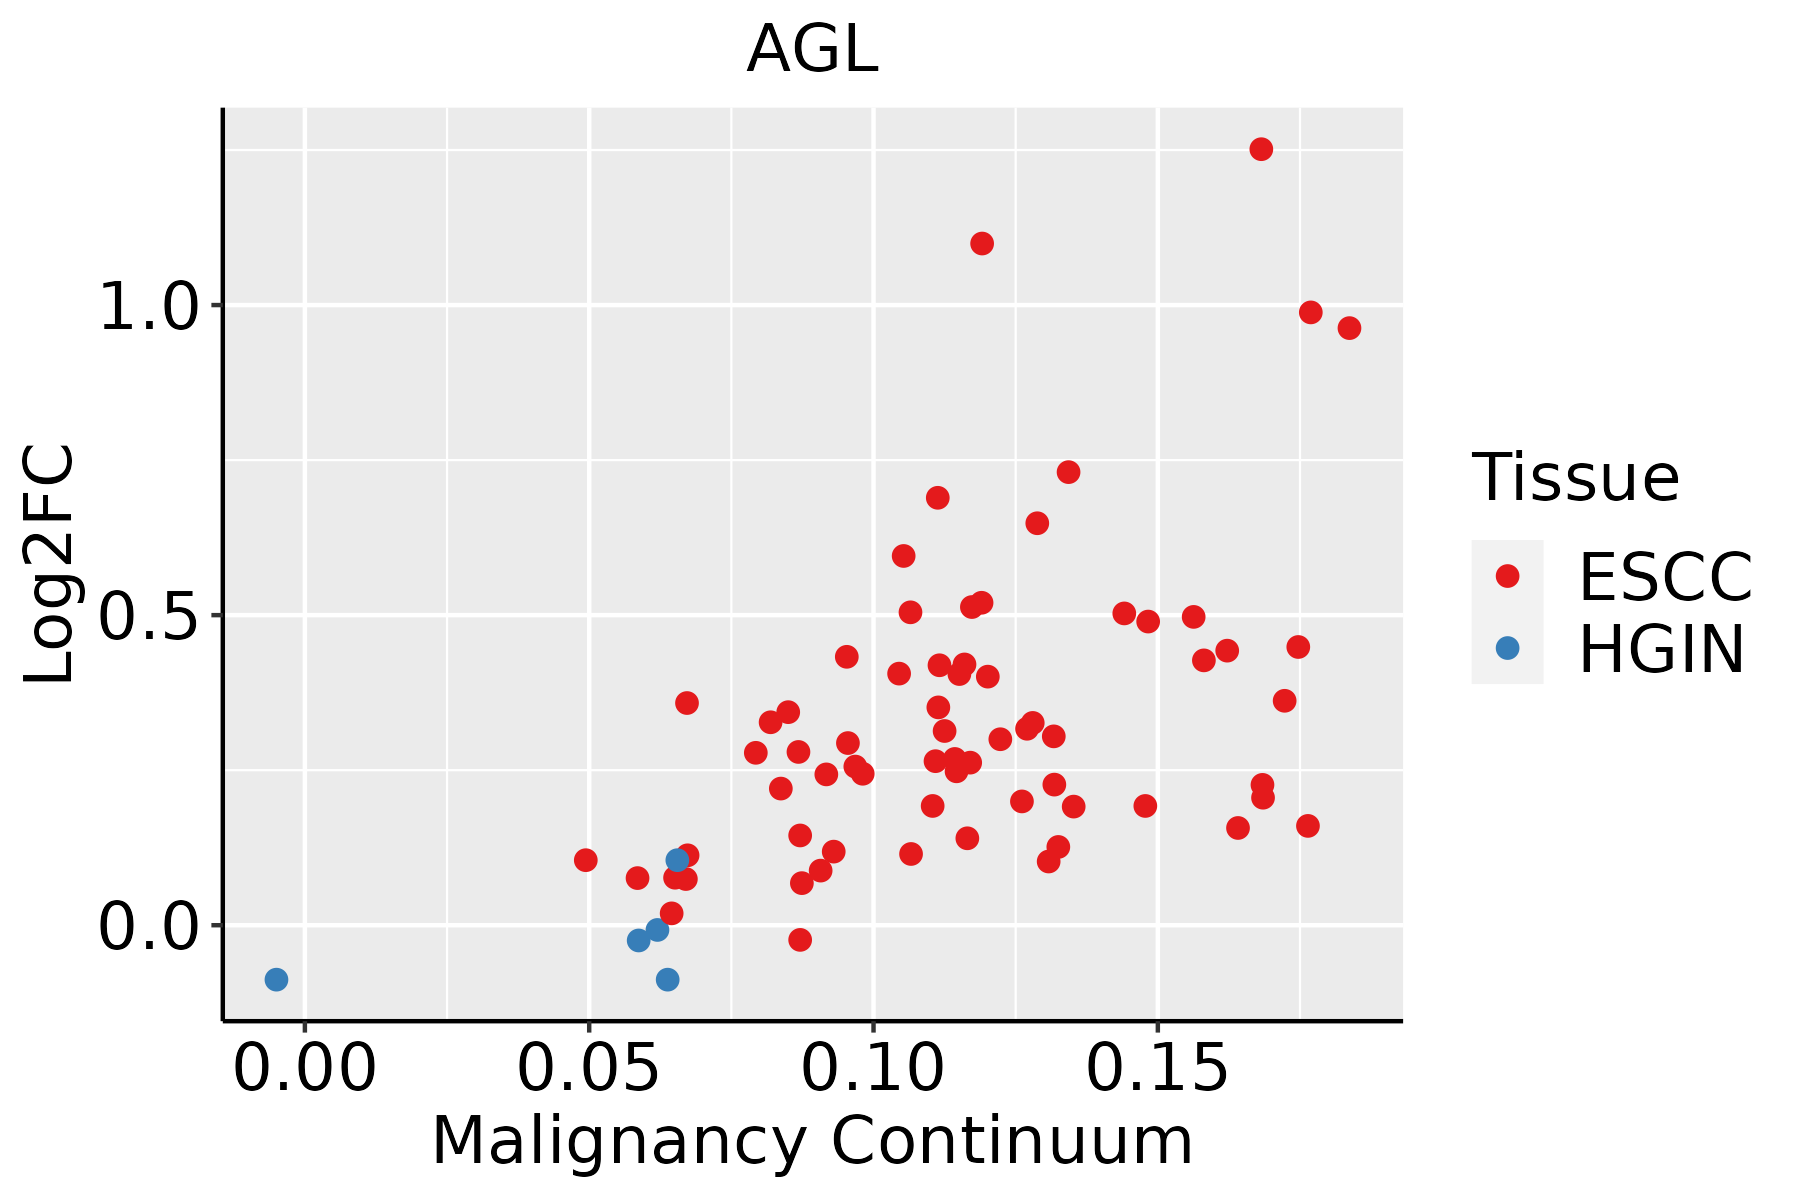 | ESCC: Esophageal squamous cell carcinoma |
| HGIN: High-grade intraepithelial neoplasias |
| LGIN: Low-grade intraepithelial neoplasias |
| Liver | 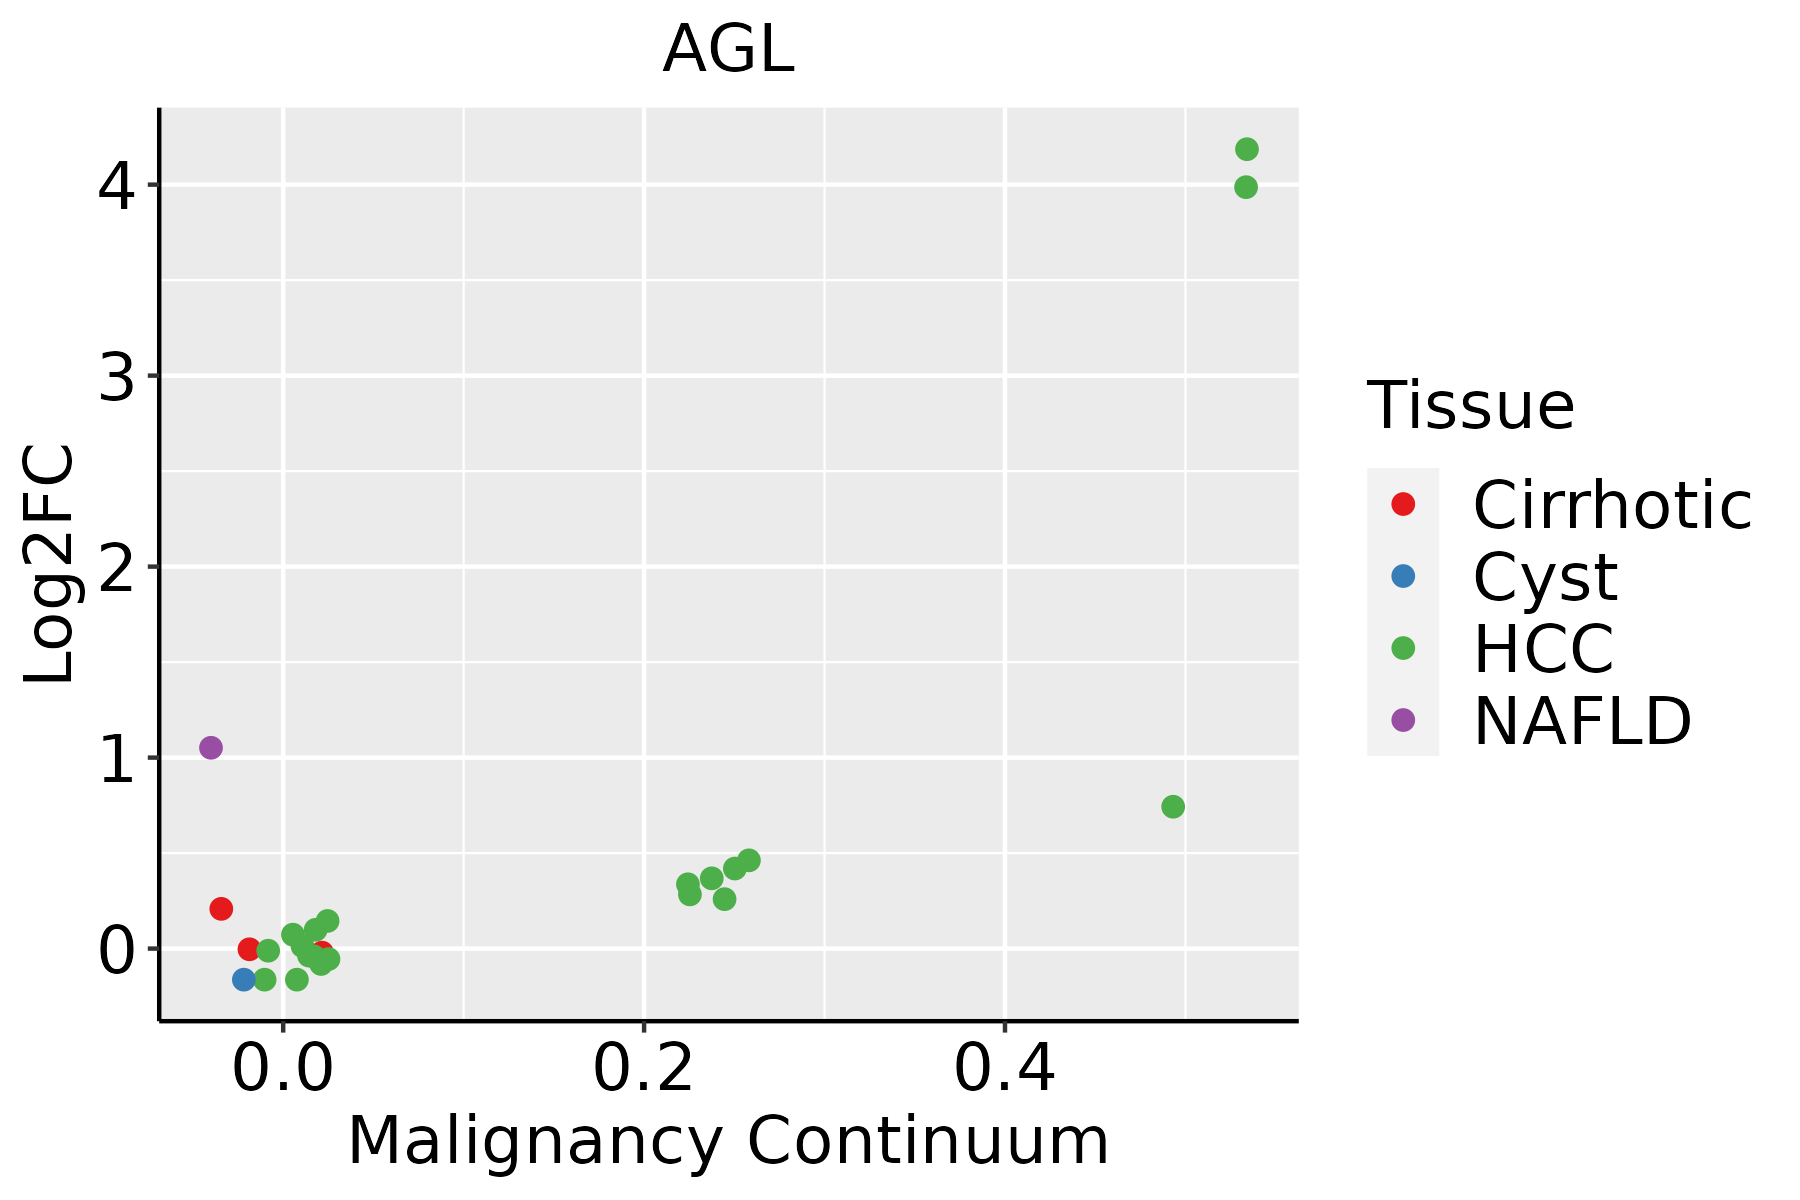 | HCC: Hepatocellular carcinoma |
| NAFLD: Non-alcoholic fatty liver disease |
| Lung | 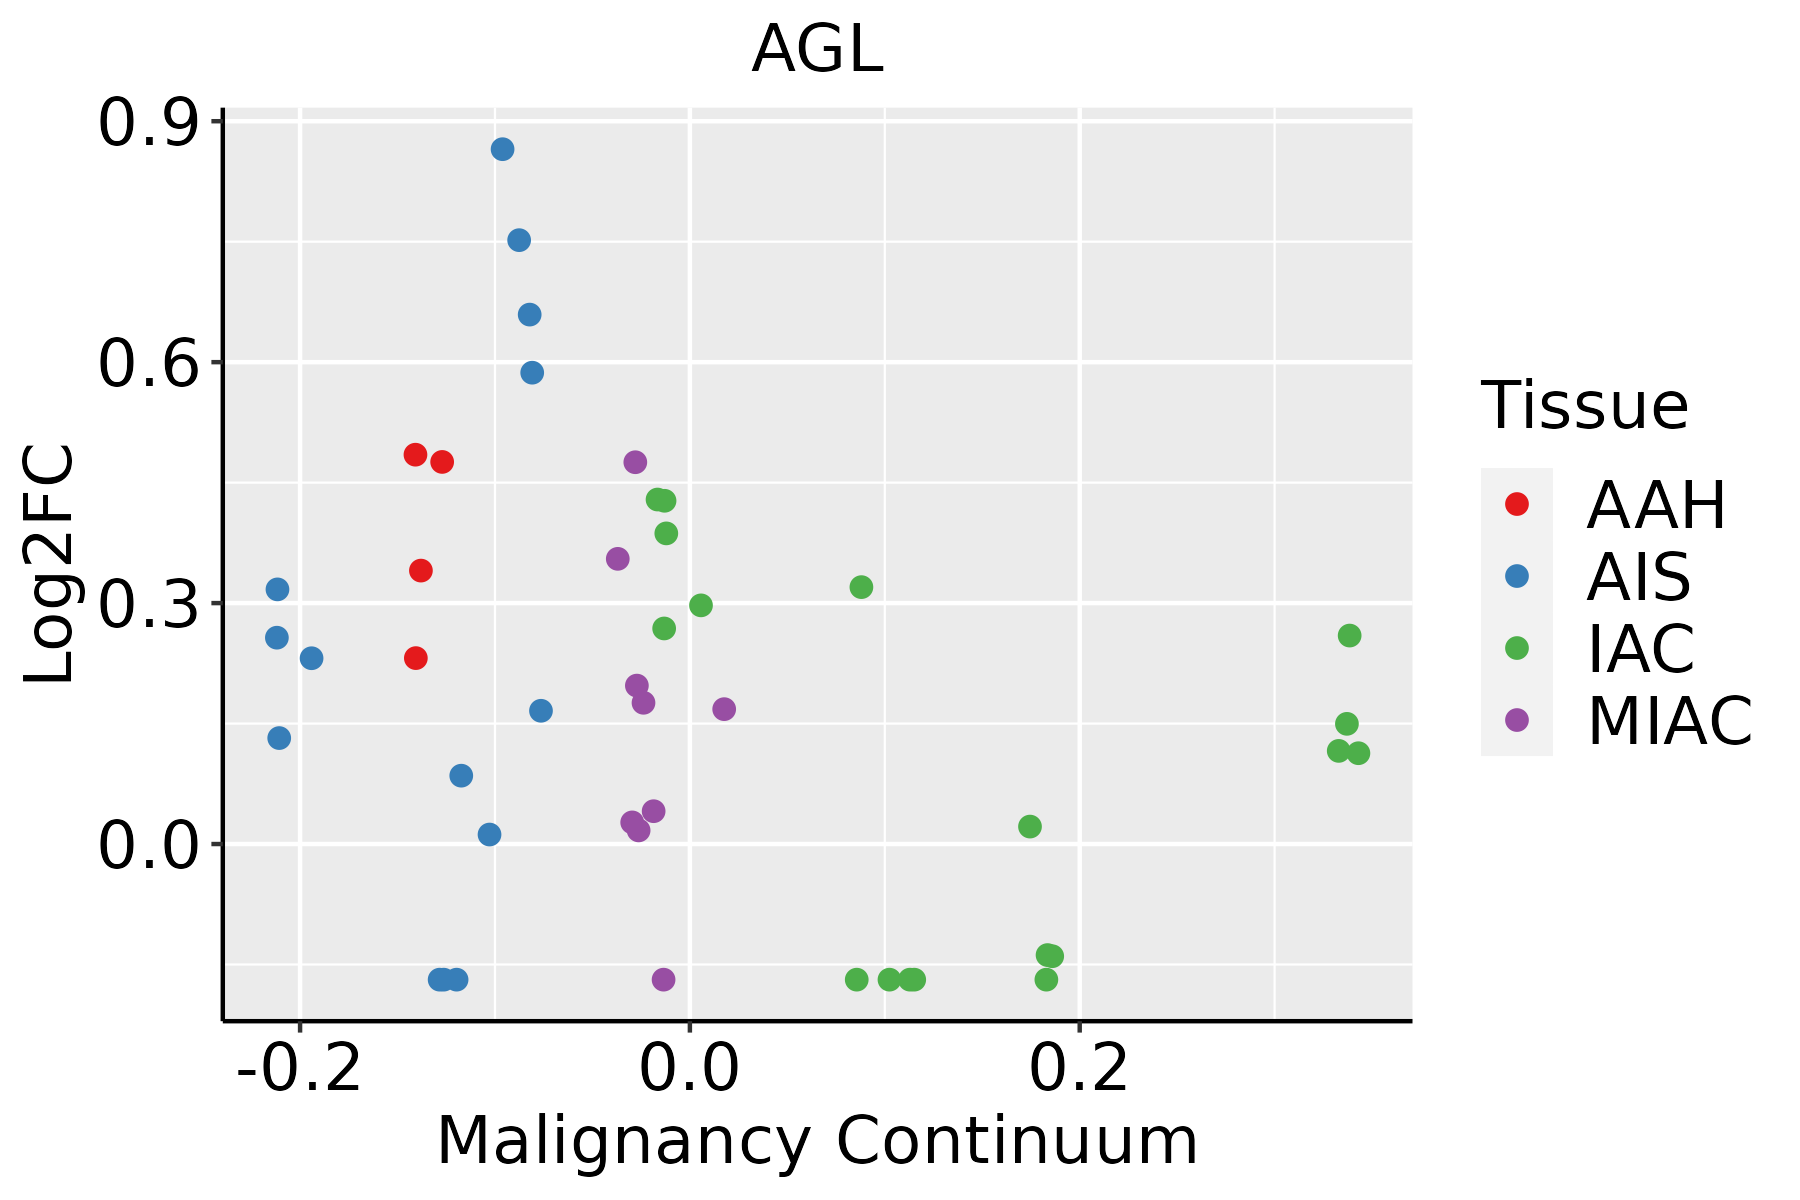 | AAH: Atypical adenomatous hyperplasia |
| AIS: Adenocarcinoma in situ |
| IAC: Invasive lung adenocarcinoma |
| MIA: Minimally invasive adenocarcinoma |
| Oral Cavity |  | EOLP: Erosive Oral lichen planus |
| LP: leukoplakia |
| NEOLP: Non-erosive oral lichen planus |
| OSCC: Oral squamous cell carcinoma |
| Prostate | 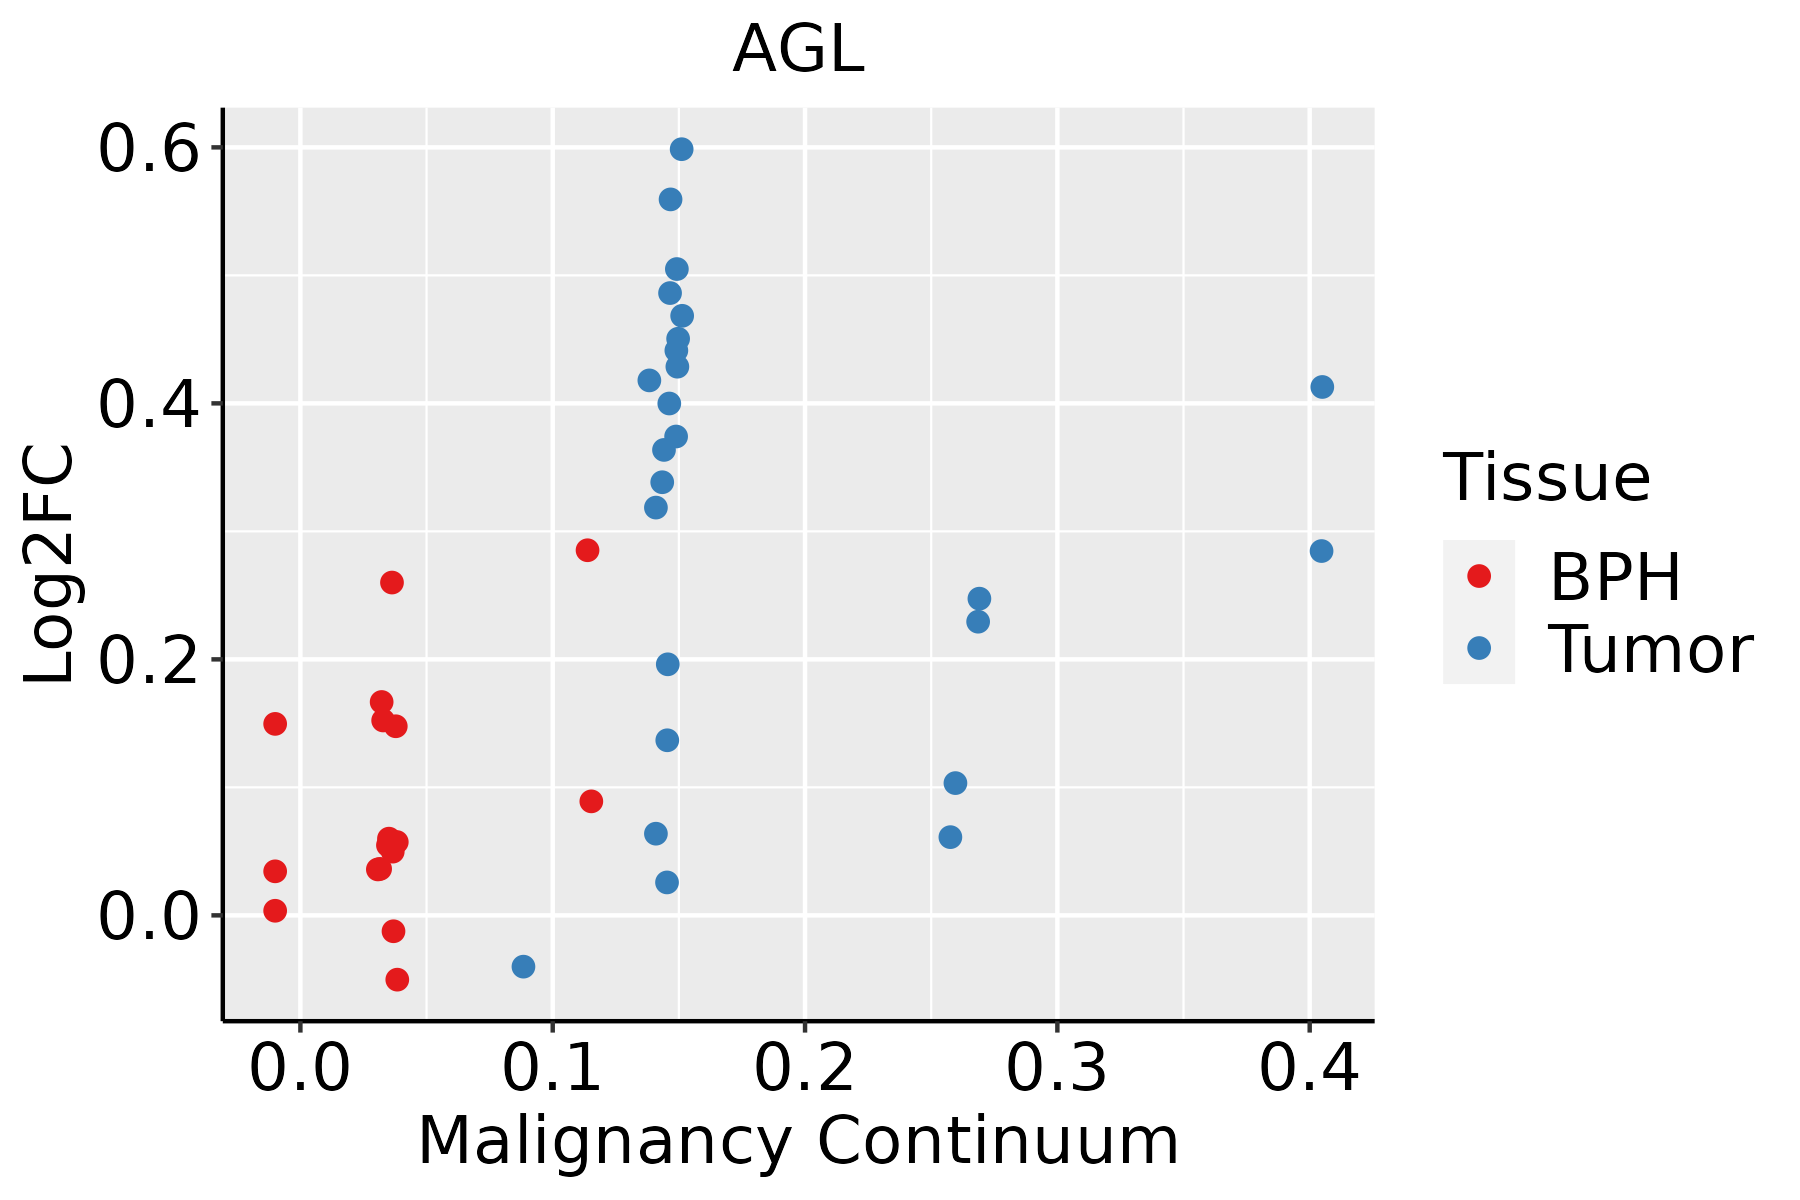 | BPH: Benign Prostatic Hyperplasia |
| Skin | 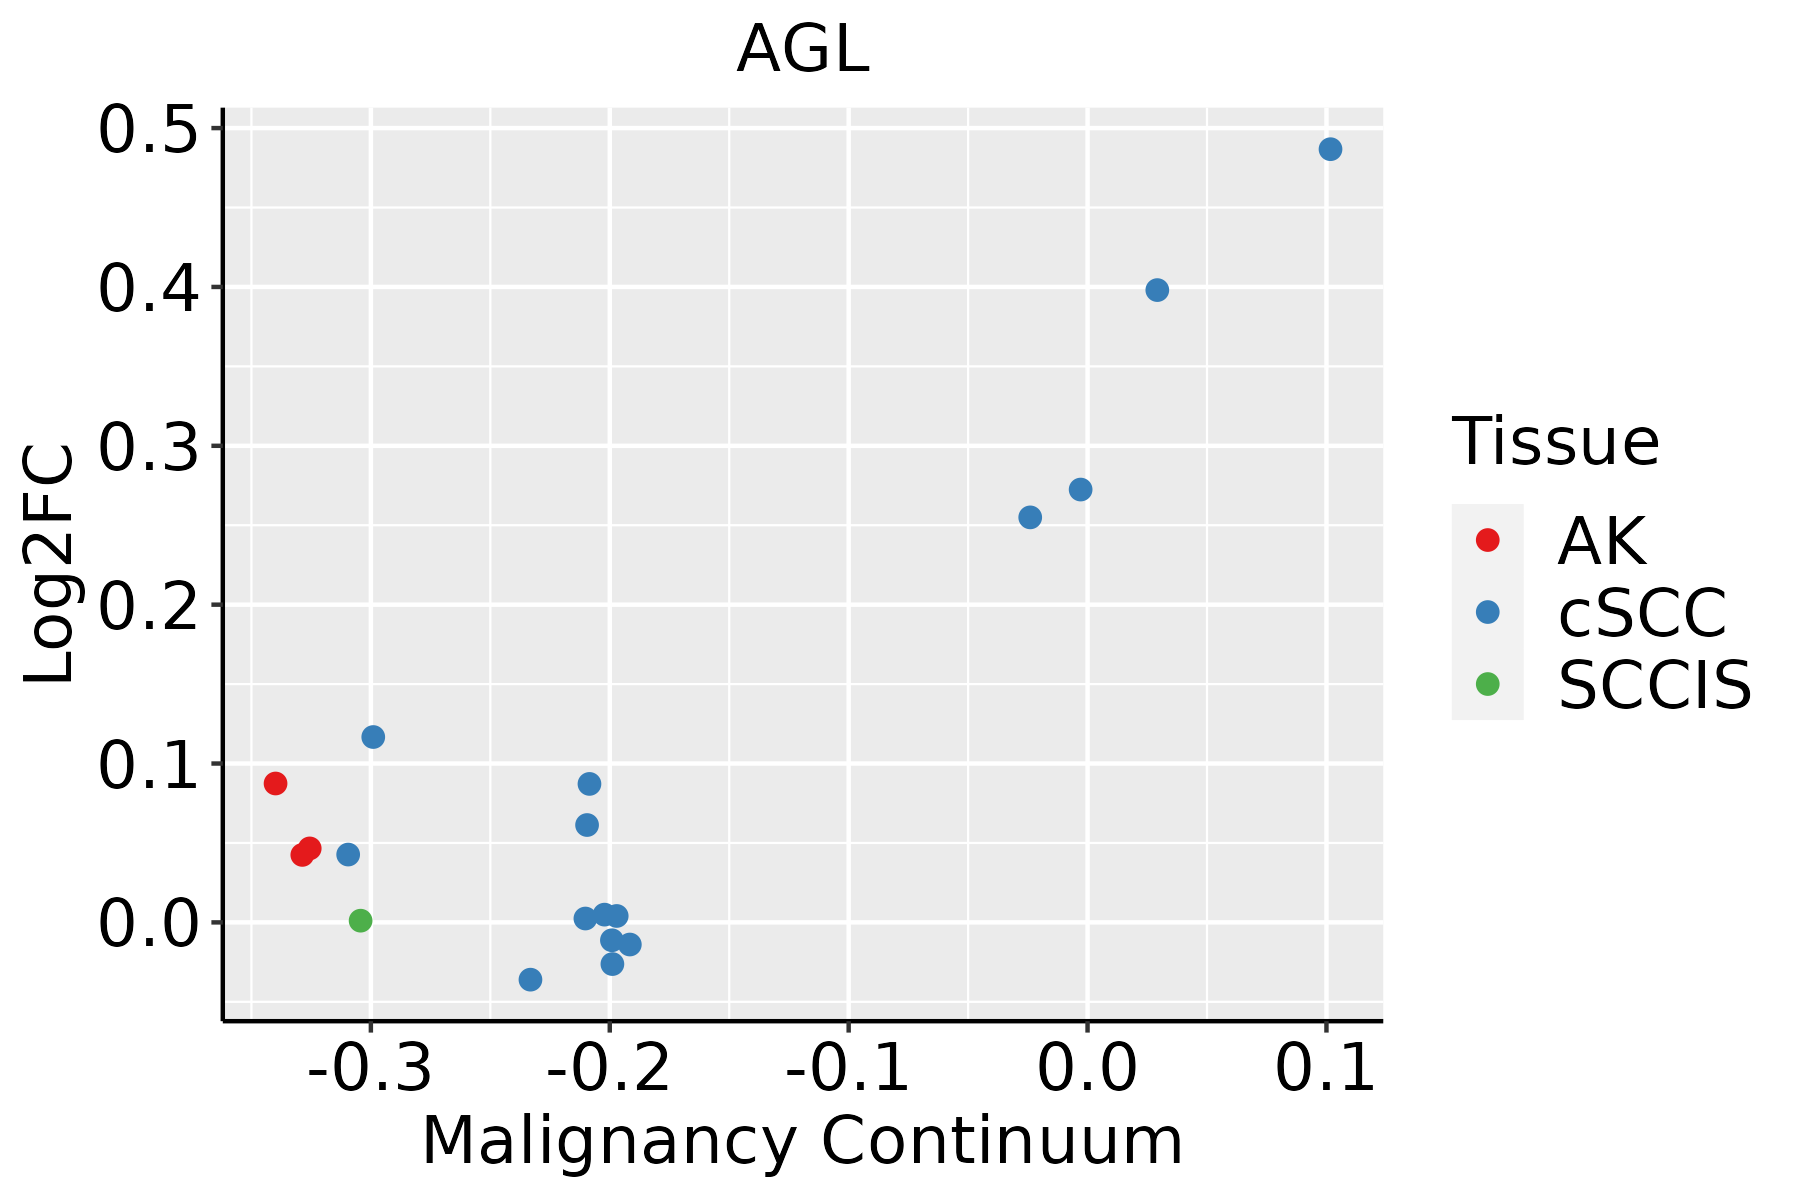 | AK: Actinic keratosis |
| cSCC: Cutaneous squamous cell carcinoma |
| SCCIS:squamous cell carcinoma in situ |
| Thyroid | 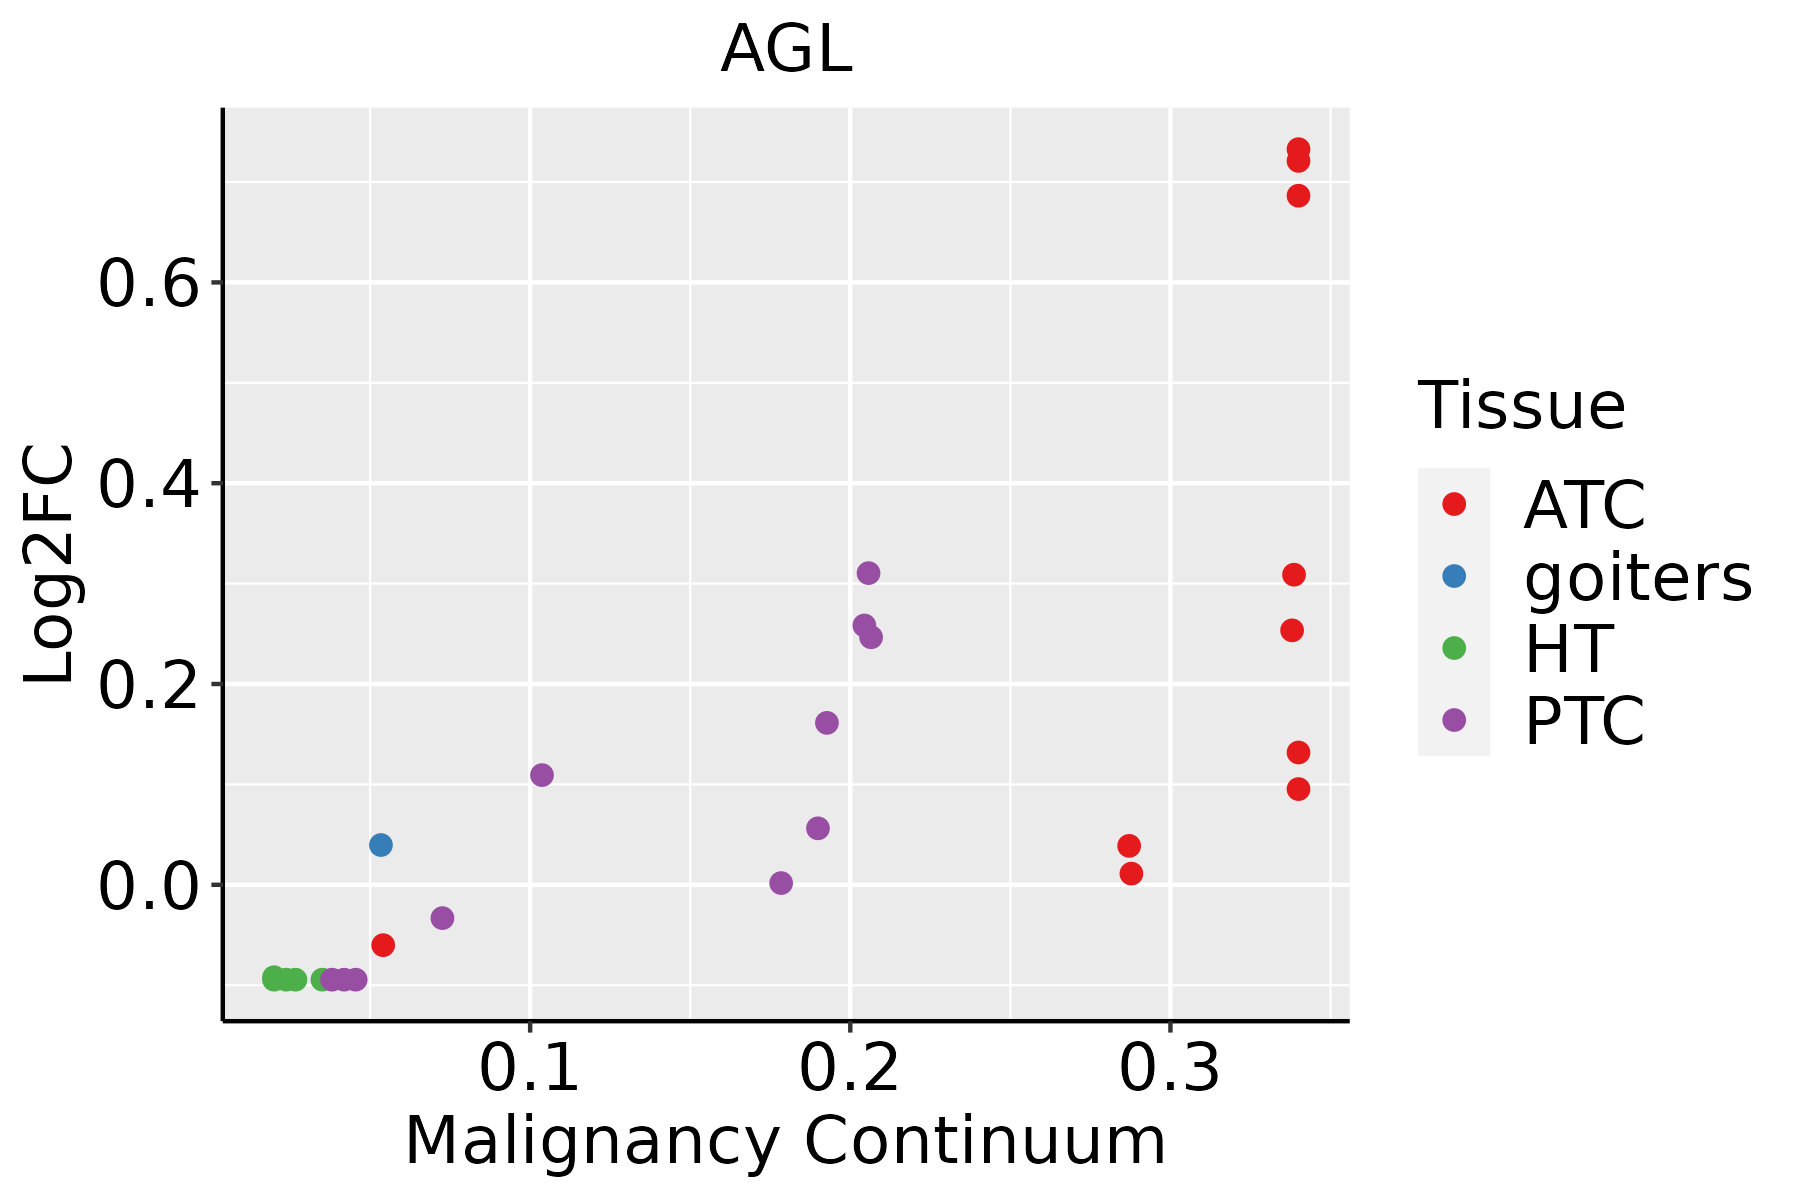 | ATC: Anaplastic thyroid cancer |
| HT: Hashimoto's thyroiditis |
| PTC: Papillary thyroid cancer |
| GO ID | Tissue | Disease Stage | Description | Gene Ratio | Bg Ratio | pvalue | p.adjust | Count |
| GO:00075172 | Breast | IDC | muscle organ development | 38/1434 | 327/18723 | 6.63e-03 | 4.62e-02 | 38 |
| GO:00075171 | Breast | DCIS | muscle organ development | 37/1390 | 327/18723 | 6.86e-03 | 4.75e-02 | 37 |
| GO:00060919 | Cervix | CC | generation of precursor metabolites and energy | 105/2311 | 490/18723 | 7.40e-09 | 6.61e-07 | 105 |
| GO:00159809 | Cervix | CC | energy derivation by oxidation of organic compounds | 74/2311 | 318/18723 | 3.83e-08 | 2.53e-06 | 74 |
| GO:004854510 | Cervix | CC | response to steroid hormone | 74/2311 | 339/18723 | 5.71e-07 | 2.09e-05 | 74 |
| GO:003166710 | Cervix | CC | response to nutrient levels | 92/2311 | 474/18723 | 5.80e-06 | 1.42e-04 | 92 |
| GO:00319609 | Cervix | CC | response to corticosteroid | 39/2311 | 167/18723 | 5.48e-05 | 8.06e-04 | 39 |
| GO:00513849 | Cervix | CC | response to glucocorticoid | 35/2311 | 148/18723 | 9.87e-05 | 1.27e-03 | 35 |
| GO:00161977 | Cervix | CC | endosomal transport | 48/2311 | 230/18723 | 1.65e-04 | 1.97e-03 | 48 |
| GO:00075846 | Cervix | CC | response to nutrient | 33/2311 | 174/18723 | 7.65e-03 | 4.07e-02 | 33 |
| GO:0016197 | Colorectum | AD | endosomal transport | 90/3918 | 230/18723 | 1.88e-10 | 1.73e-08 | 90 |
| GO:00161971 | Colorectum | SER | endosomal transport | 61/2897 | 230/18723 | 1.03e-05 | 3.35e-04 | 61 |
| GO:00161972 | Colorectum | MSS | endosomal transport | 79/3467 | 230/18723 | 7.04e-09 | 4.39e-07 | 79 |
| GO:00161973 | Colorectum | FAP | endosomal transport | 56/2622 | 230/18723 | 1.79e-05 | 4.53e-04 | 56 |
| GO:00075174 | Endometrium | AEH | muscle organ development | 60/2100 | 327/18723 | 8.19e-05 | 1.22e-03 | 60 |
| GO:000751712 | Endometrium | EEC | muscle organ development | 59/2168 | 327/18723 | 3.49e-04 | 3.85e-03 | 59 |
| GO:0097193111 | Esophagus | ESCC | intrinsic apoptotic signaling pathway | 222/8552 | 288/18723 | 5.87e-28 | 2.02e-25 | 222 |
| GO:2001233111 | Esophagus | ESCC | regulation of apoptotic signaling pathway | 256/8552 | 356/18723 | 4.11e-24 | 1.04e-21 | 256 |
| GO:0006091110 | Esophagus | ESCC | generation of precursor metabolites and energy | 331/8552 | 490/18723 | 3.86e-23 | 8.45e-21 | 331 |
| GO:0015980110 | Esophagus | ESCC | energy derivation by oxidation of organic compounds | 220/8552 | 318/18723 | 1.20e-17 | 1.09e-15 | 220 |
| Hugo Symbol | Variant Class | Variant Classification | dbSNP RS | HGVSc | HGVSp | HGVSp Short | SWISSPROT | BIOTYPE | SIFT | PolyPhen | Tumor Sample Barcode | Tissue | Histology | Sex | Age | Stage | Therapy Types | Drugs | Outcome |
| AGL | SNV | Missense_Mutation | | c.526G>C | p.Ala176Pro | p.A176P | P35573 | protein_coding | tolerated(0.1) | probably_damaging(0.922) | TCGA-A2-A0T0-01 | Breast | breast invasive carcinoma | Female | <65 | I/II | Chemotherapy | taxotere | SD |
| AGL | SNV | Missense_Mutation | novel | c.982N>A | p.Asp328Asn | p.D328N | P35573 | protein_coding | tolerated(0.18) | benign(0.024) | TCGA-A7-A6VX-01 | Breast | breast invasive carcinoma | Female | >=65 | I/II | Chemotherapy | docetaxel | CR |
| AGL | SNV | Missense_Mutation | novel | c.1243A>C | p.Lys415Gln | p.K415Q | P35573 | protein_coding | tolerated(0.06) | possibly_damaging(0.566) | TCGA-AN-A046-01 | Breast | breast invasive carcinoma | Female | >=65 | I/II | Unknown | Unknown | SD |
| AGL | SNV | Missense_Mutation | | c.3533N>T | p.Pro1178Leu | p.P1178L | P35573 | protein_coding | deleterious(0.05) | benign(0.398) | TCGA-B6-A0RL-01 | Breast | breast invasive carcinoma | Female | <65 | I/II | Unknown | Unknown | SD |
| AGL | SNV | Missense_Mutation | novel | c.1391N>A | p.Gly464Glu | p.G464E | P35573 | protein_coding | deleterious(0.01) | possibly_damaging(0.644) | TCGA-BH-A0HF-01 | Breast | breast invasive carcinoma | Female | >=65 | I/II | Hormone Therapy | arimidex | SD |
| AGL | SNV | Missense_Mutation | novel | c.3550N>T | p.Pro1184Ser | p.P1184S | P35573 | protein_coding | deleterious(0) | probably_damaging(0.999) | TCGA-OL-A97C-01 | Breast | breast invasive carcinoma | Female | >=65 | I/II | Unknown | Unknown | PD |
| AGL | SNV | Missense_Mutation | rs147977213 | c.2930G>T | p.Arg977Leu | p.R977L | P35573 | protein_coding | tolerated(0.36) | benign(0.298) | TCGA-WT-AB41-01 | Breast | breast invasive carcinoma | Female | <65 | I/II | Chemotherapy | taxotere | CR |
| AGL | deletion | Frame_Shift_Del | | c.3794delN | p.Ser1266ValfsTer24 | p.S1266Vfs*24 | P35573 | protein_coding | | | TCGA-BH-A0GY-01 | Breast | breast invasive carcinoma | Female | >=65 | I/II | Chemotherapy | cyotxan | SD |
| AGL | SNV | Missense_Mutation | rs762935611 | c.136G>A | p.Val46Met | p.V46M | P35573 | protein_coding | deleterious(0.02) | possibly_damaging(0.454) | TCGA-4J-AA1J-01 | Cervix | cervical & endocervical cancer | Female | <65 | I/II | Unknown | Unknown | SD |
| AGL | SNV | Missense_Mutation | | c.1219N>A | p.Glu407Lys | p.E407K | P35573 | protein_coding | tolerated(0.45) | probably_damaging(0.926) | TCGA-DR-A0ZM-01 | Cervix | cervical & endocervical cancer | Female | <65 | III/IV | Unspecific | Cisplatin | SD |


