
|
|||||
|
 | |
| |
| |
| |
| |
| |
|
Gene: AGGF1 |
Gene summary for AGGF1 |
| Gene information | Species | Human | Gene symbol | AGGF1 | Gene ID | 55109 |
| Gene name | angiogenic factor with G-patch and FHA domains 1 | |
| Gene Alias | GPATC7 | |
| Cytomap | 5q13.3 | |
| Gene Type | protein-coding | GO ID | GO:0001525 | UniProtAcc | Q8N302 |
Top |
Malignant transformation analysis |
| Identification of the aberrant gene expression in precancerous and cancerous lesions by comparing the gene expression of stem-like cells in diseased tissues with normal stem cells |
| Entrez ID | Symbol | Replicates | Species | Organ | Tissue | Adj P-value | Log2FC | Malignancy |
| 55109 | AGGF1 | HTA11_2487_2000001011 | Human | Colorectum | SER | 2.31e-04 | 2.09e-01 | -0.1808 |
| 55109 | AGGF1 | HTA11_1938_2000001011 | Human | Colorectum | AD | 5.94e-03 | 2.03e-01 | -0.0811 |
| 55109 | AGGF1 | HTA11_78_2000001011 | Human | Colorectum | AD | 1.92e-14 | 4.30e-01 | -0.1088 |
| 55109 | AGGF1 | HTA11_347_2000001011 | Human | Colorectum | AD | 4.49e-21 | 4.17e-01 | -0.1954 |
| 55109 | AGGF1 | HTA11_411_2000001011 | Human | Colorectum | SER | 5.67e-08 | 5.32e-01 | -0.2602 |
| 55109 | AGGF1 | HTA11_3361_2000001011 | Human | Colorectum | AD | 7.92e-03 | 1.97e-01 | -0.1207 |
| 55109 | AGGF1 | HTA11_83_2000001011 | Human | Colorectum | SER | 1.39e-02 | 2.12e-01 | -0.1526 |
| 55109 | AGGF1 | HTA11_696_2000001011 | Human | Colorectum | AD | 8.10e-07 | 2.30e-01 | -0.1464 |
| 55109 | AGGF1 | HTA11_866_2000001011 | Human | Colorectum | AD | 5.57e-05 | 1.95e-01 | -0.1001 |
| 55109 | AGGF1 | HTA11_1391_2000001011 | Human | Colorectum | AD | 5.16e-10 | 2.80e-01 | -0.059 |
| 55109 | AGGF1 | HTA11_546_2000001011 | Human | Colorectum | AD | 3.37e-05 | 2.98e-01 | -0.0842 |
| 55109 | AGGF1 | HTA11_866_3004761011 | Human | Colorectum | AD | 1.02e-02 | 1.37e-01 | 0.096 |
| 55109 | AGGF1 | HTA11_4255_2000001011 | Human | Colorectum | SER | 1.95e-02 | 3.30e-01 | 0.0446 |
| 55109 | AGGF1 | HTA11_7663_2000001011 | Human | Colorectum | SER | 7.98e-05 | 3.29e-01 | 0.0131 |
| 55109 | AGGF1 | HTA11_10623_2000001011 | Human | Colorectum | AD | 4.64e-04 | 2.57e-01 | -0.0177 |
| 55109 | AGGF1 | HTA11_10711_2000001011 | Human | Colorectum | AD | 4.19e-02 | 1.49e-01 | 0.0338 |
| 55109 | AGGF1 | HTA11_6818_2000001011 | Human | Colorectum | AD | 1.95e-02 | 2.68e-01 | 0.0112 |
| 55109 | AGGF1 | HTA11_6818_2000001021 | Human | Colorectum | AD | 4.50e-05 | 2.25e-01 | 0.0588 |
| 55109 | AGGF1 | HTA11_99999970781_79442 | Human | Colorectum | MSS | 5.65e-15 | 3.75e-01 | 0.294 |
| 55109 | AGGF1 | HTA11_99999965104_69814 | Human | Colorectum | MSS | 8.23e-09 | 3.03e-01 | 0.281 |
| Page: 1 2 3 4 5 6 |
| Tissue | Expression Dynamics | Abbreviation |
| Colorectum (GSE201348) |  | FAP: Familial adenomatous polyposis |
| CRC: Colorectal cancer | ||
| Colorectum (HTA11) | 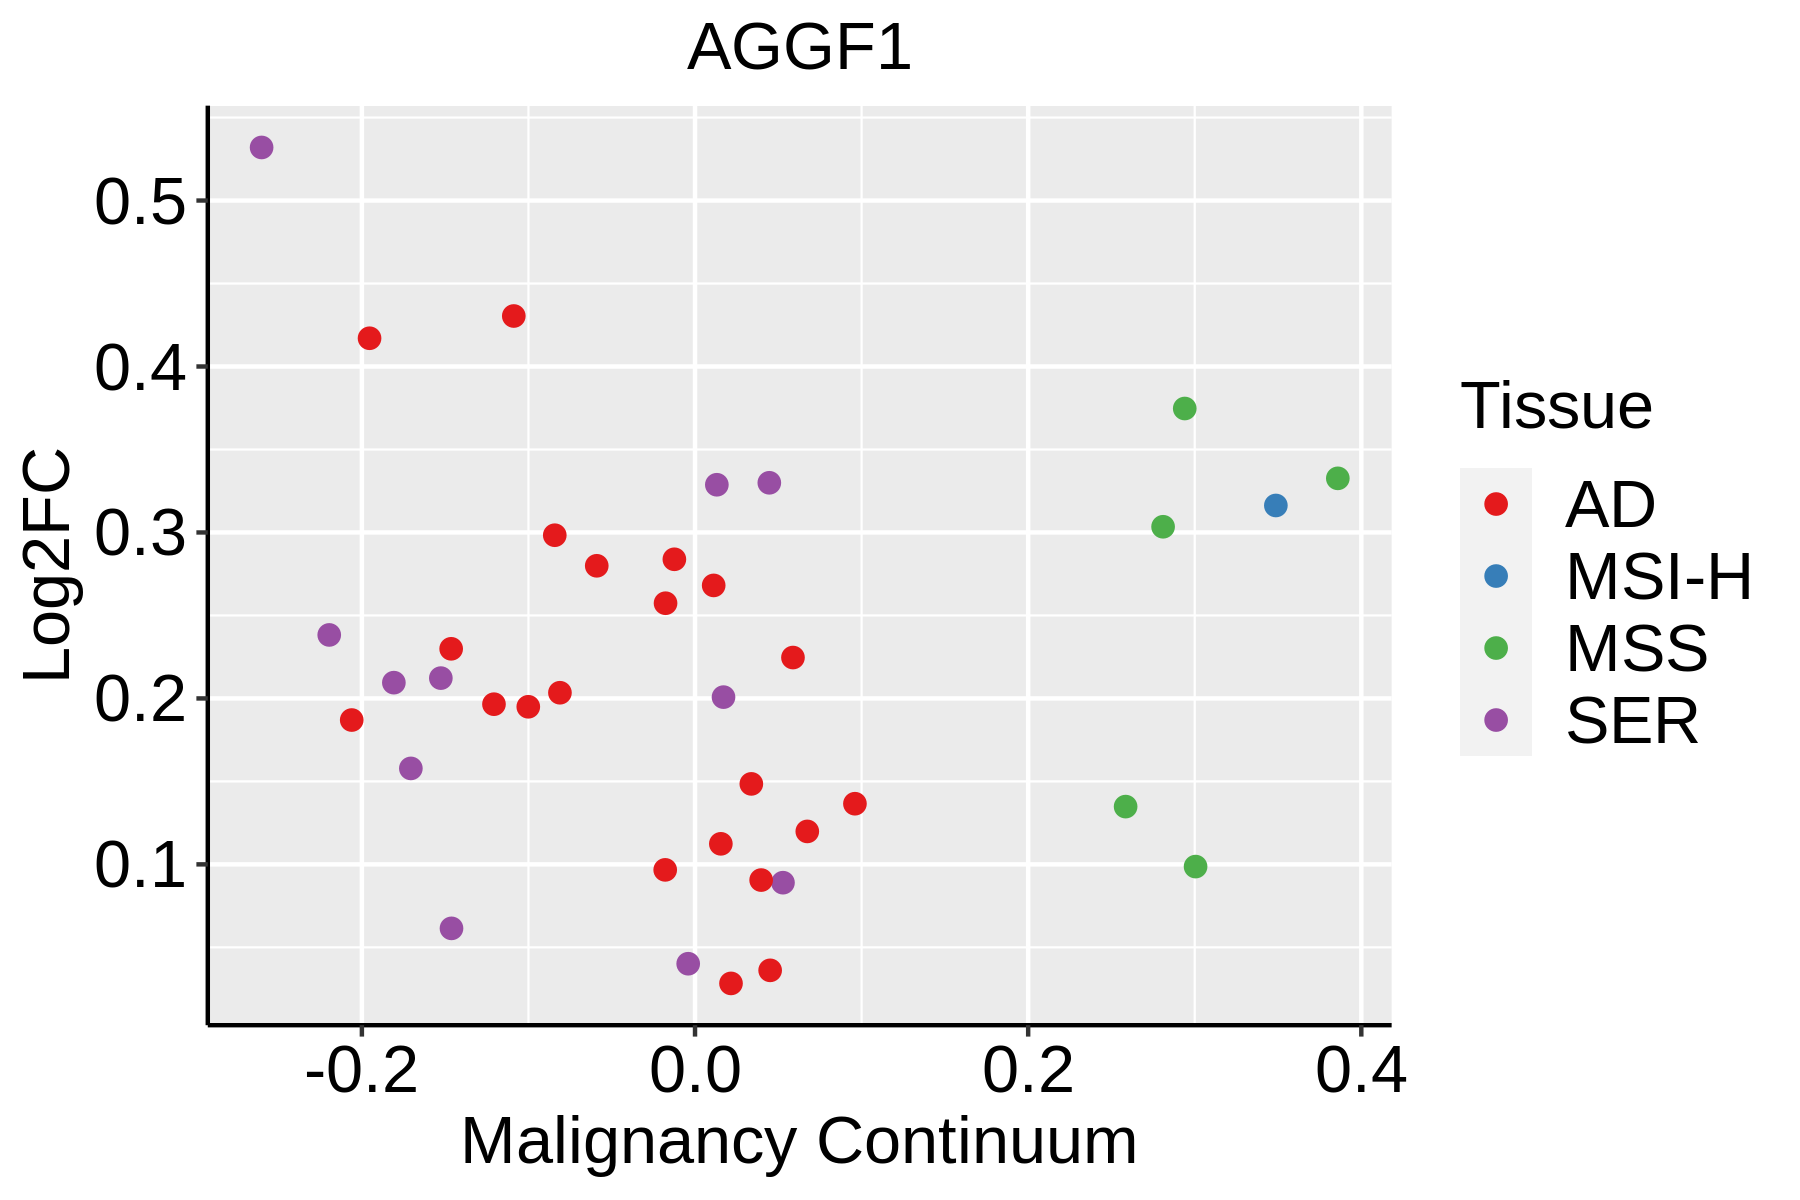 | AD: Adenomas |
| SER: Sessile serrated lesions | ||
| MSI-H: Microsatellite-high colorectal cancer | ||
| MSS: Microsatellite stable colorectal cancer | ||
| Esophagus |  | ESCC: Esophageal squamous cell carcinoma |
| HGIN: High-grade intraepithelial neoplasias | ||
| LGIN: Low-grade intraepithelial neoplasias | ||
| Liver | 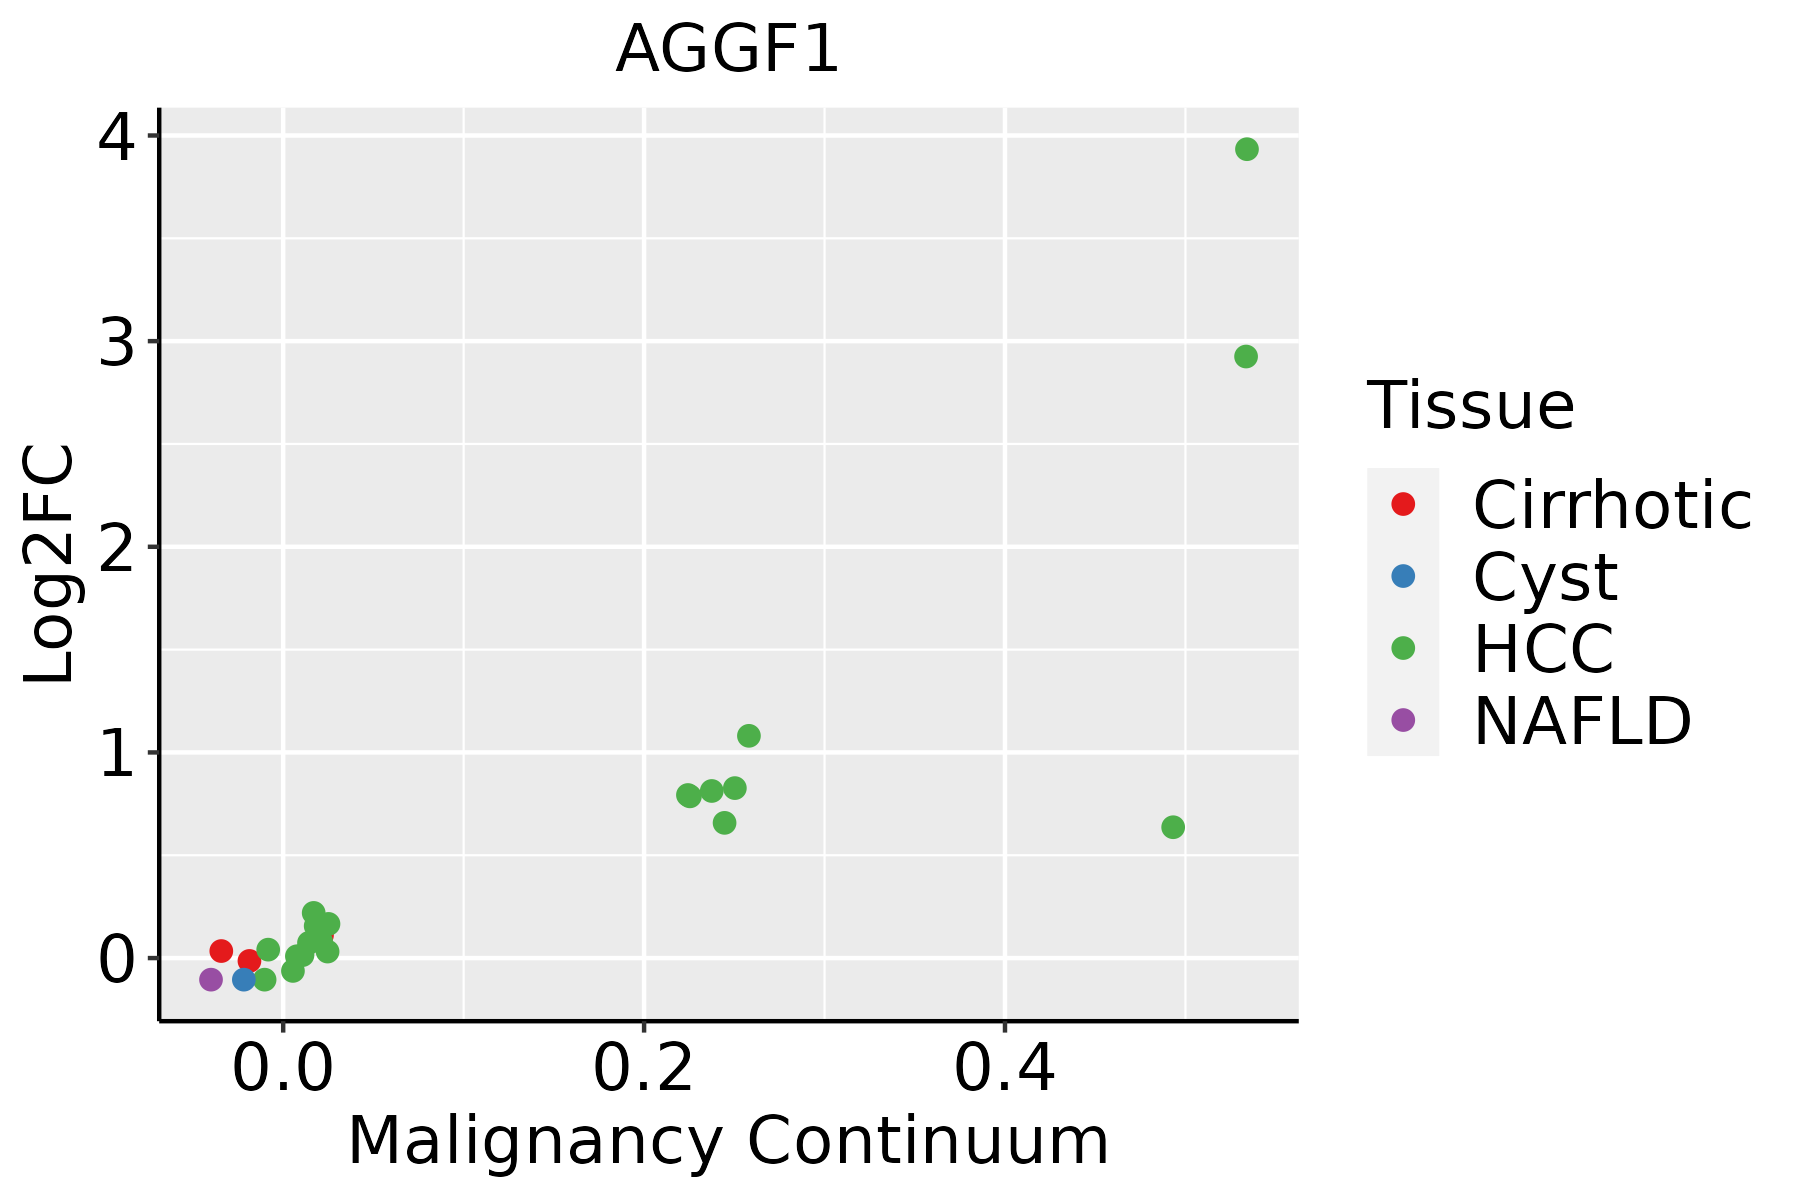 | HCC: Hepatocellular carcinoma |
| NAFLD: Non-alcoholic fatty liver disease | ||
| Oral Cavity | 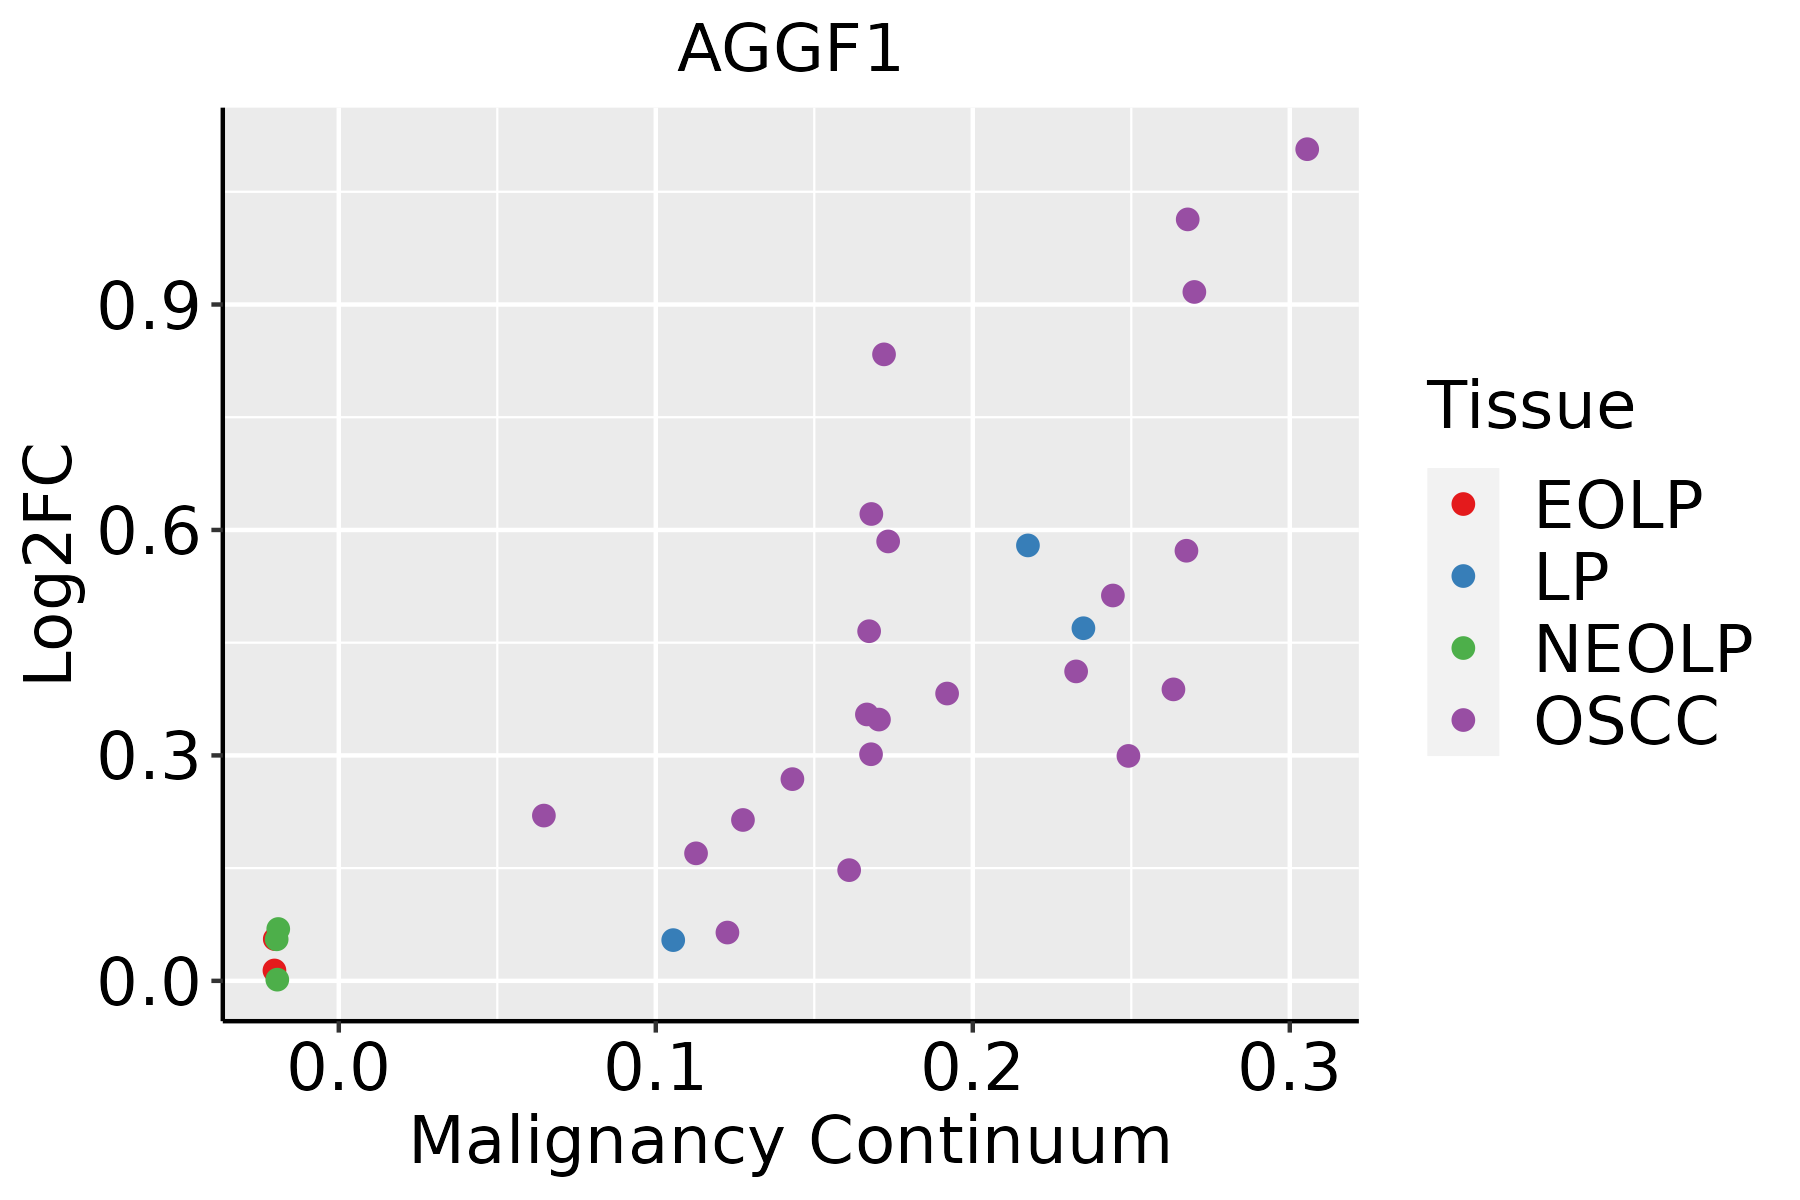 | EOLP: Erosive Oral lichen planus |
| LP: leukoplakia | ||
| NEOLP: Non-erosive oral lichen planus | ||
| OSCC: Oral squamous cell carcinoma | ||
| Skin |  | AK: Actinic keratosis |
| cSCC: Cutaneous squamous cell carcinoma | ||
| SCCIS:squamous cell carcinoma in situ |
| ∗log2FC in expression of this searched gene in stem-like cells from each diseased tissue sample relative to stem-like cells in normal samples in each tissue plotted against the malignancy continuum. Samples are colored based on if they are from different disease stage. |
Top |
Malignant transformation related pathway analysis |
| Find out the enriched GO biological processes and KEGG pathways involved in transition from healthy to precancer to cancer |
| Tissue | Disease Stage | Enriched GO biological Processes |
| Colorectum | AD |  |
| Colorectum | SER |  |
| Colorectum | MSS |  |
| Colorectum | MSI-H |  |
| Colorectum | FAP |  |
| ∗Top 15 enriched GO BP terms are showed in the bar plot of each disease state in each tissue. Each row represents a significant GO biological process which is colored according to the -log10(p.adjust). |
| Page: 1 2 3 4 5 6 7 8 9 |
| GO ID | Tissue | Disease Stage | Description | Gene Ratio | Bg Ratio | pvalue | p.adjust | Count |
| GO:0050673 | Colorectum | AD | epithelial cell proliferation | 119/3918 | 437/18723 | 8.75e-04 | 8.51e-03 | 119 |
| GO:00506731 | Colorectum | MSS | epithelial cell proliferation | 108/3467 | 437/18723 | 6.76e-04 | 7.30e-03 | 108 |
| GO:0050678 | Colorectum | MSS | regulation of epithelial cell proliferation | 90/3467 | 381/18723 | 6.92e-03 | 4.45e-02 | 90 |
| GO:005067318 | Esophagus | ESCC | epithelial cell proliferation | 238/8552 | 437/18723 | 1.19e-04 | 8.20e-04 | 238 |
| GO:005067817 | Esophagus | ESCC | regulation of epithelial cell proliferation | 206/8552 | 381/18723 | 5.51e-04 | 3.02e-03 | 206 |
| GO:005067310 | Oral cavity | OSCC | epithelial cell proliferation | 212/7305 | 437/18723 | 2.82e-05 | 2.61e-04 | 212 |
| GO:005067810 | Oral cavity | OSCC | regulation of epithelial cell proliferation | 180/7305 | 381/18723 | 5.88e-04 | 3.35e-03 | 180 |
| GO:005067324 | Skin | cSCC | epithelial cell proliferation | 144/4864 | 437/18723 | 6.07e-04 | 4.38e-03 | 144 |
| Page: 1 |
| Pathway ID | Tissue | Disease Stage | Description | Gene Ratio | Bg Ratio | pvalue | p.adjust | qvalue | Count |
| Page: 1 |
Top |
Cell-cell communication analysis |
| Identification of potential cell-cell interactions between two cell types and their ligand-receptor pairs for different disease states |
| Ligand | Receptor | LRpair | Pathway | Tissue | Disease Stage |
| Page: 1 |
Top |
Single-cell gene regulatory network inference analysis |
| Find out the significant the regulons (TFs) and the target genes of each regulon across cell types for different disease states |
| TF | Cell Type | Tissue | Disease Stage | Target Gene | RSS | Regulon Activity |
| AGGF1 | MSC | Breast | Precancer | C14orf2,C16orf13,ATP5A1, etc. | 1.90e-01 |  |
| AGGF1 | GC | Esophagus | ADJ | UHRF1BP1,ORMDL1,GPCPD1, etc. | 4.28e-01 |  |
| AGGF1 | GC | Esophagus | ESCC | UHRF1BP1,ORMDL1,GPCPD1, etc. | 4.42e-01 |  |
| ∗The dot plots of a searched regulon are shown for all cell subpopulations in each disease state of each tissue based on the regulon specific score inferred using pySCENIC and by calculating the average expression. |
| Page: 1 |
Top |
Somatic mutation of malignant transformation related genes |
| Annotation of somatic variants for genes involved in malignant transformation |
| Hugo Symbol | Variant Class | Variant Classification | dbSNP RS | HGVSc | HGVSp | HGVSp Short | SWISSPROT | BIOTYPE | SIFT | PolyPhen | Tumor Sample Barcode | Tissue | Histology | Sex | Age | Stage | Therapy Types | Drugs | Outcome |
| AGGF1 | SNV | Missense_Mutation | c.1906G>C | p.Glu636Gln | p.E636Q | Q8N302 | protein_coding | deleterious(0.04) | probably_damaging(0.999) | TCGA-A8-A06Q-01 | Breast | breast invasive carcinoma | Female | <65 | III/IV | Unknown | Unknown | SD | |
| AGGF1 | SNV | Missense_Mutation | c.1405N>A | p.Tyr469Asn | p.Y469N | Q8N302 | protein_coding | deleterious(0) | probably_damaging(1) | TCGA-A8-A09D-01 | Breast | breast invasive carcinoma | Female | <65 | I/II | Chemotherapy | doxorubicin | CR | |
| AGGF1 | SNV | Missense_Mutation | c.1612N>A | p.Asp538Asn | p.D538N | Q8N302 | protein_coding | tolerated(0.43) | probably_damaging(0.942) | TCGA-AO-A0J9-01 | Breast | breast invasive carcinoma | Female | <65 | III/IV | Chemotherapy | cyclophosphamide | PD | |
| AGGF1 | SNV | Missense_Mutation | novel | c.764G>A | p.Arg255Gln | p.R255Q | Q8N302 | protein_coding | tolerated(0.17) | probably_damaging(0.946) | TCGA-B6-A0IH-01 | Breast | breast invasive carcinoma | Female | >=65 | III/IV | Unknown | Unknown | SD |
| AGGF1 | SNV | Missense_Mutation | novel | c.1093N>C | p.Asp365His | p.D365H | Q8N302 | protein_coding | deleterious(0.01) | possibly_damaging(0.77) | TCGA-BH-A0B6-01 | Breast | breast invasive carcinoma | Female | <65 | I/II | Unknown | Unknown | SD |
| AGGF1 | SNV | Missense_Mutation | rs776588923 | c.1971T>G | p.His657Gln | p.H657Q | Q8N302 | protein_coding | tolerated(0.63) | benign(0.285) | TCGA-BH-A1EU-01 | Breast | breast invasive carcinoma | Female | >=65 | I/II | Unknown | Unknown | SD |
| AGGF1 | deletion | Frame_Shift_Del | c.2042delA | p.Asn681ThrfsTer29 | p.N681Tfs*29 | Q8N302 | protein_coding | TCGA-AN-A0AK-01 | Breast | breast invasive carcinoma | Female | >=65 | I/II | Unknown | Unknown | SD | |||
| AGGF1 | SNV | Missense_Mutation | c.436N>C | p.Glu146Gln | p.E146Q | Q8N302 | protein_coding | tolerated(0.32) | benign(0.062) | TCGA-IR-A3LK-01 | Cervix | cervical & endocervical cancer | Female | >=65 | I/II | Chemotherapy | cisplatin | PD | |
| AGGF1 | SNV | Missense_Mutation | novel | c.1369N>T | p.His457Tyr | p.H457Y | Q8N302 | protein_coding | deleterious(0) | probably_damaging(0.999) | TCGA-ZJ-AAXU-01 | Cervix | cervical & endocervical cancer | Female | <65 | I/II | Unknown | Unknown | SD |
| AGGF1 | SNV | Missense_Mutation | novel | c.1502A>C | p.His501Pro | p.H501P | Q8N302 | protein_coding | deleterious(0) | probably_damaging(0.999) | TCGA-5M-AAT6-01 | Colorectum | colon adenocarcinoma | Female | <65 | III/IV | Unknown | Unknown | PD |
| Page: 1 2 3 4 5 6 7 8 9 |
Top |
Related drugs of malignant transformation related genes |
| Identification of chemicals and drugs interact with genes involved in malignant transfromation |
| (DGIdb 4.0) |
| Entrez ID | Symbol | Category | Interaction Types | Drug Claim Name | Drug Name | PMIDs |
| Page: 1 |

Copyright 2023-Present -The University of Texas Health Science Center at Houston |