
|
|||||
|
 | |
| |
| |
| |
| |
| |
|
Gene: AGFG1 |
Gene summary for AGFG1 |
| Gene information | Species | Human | Gene symbol | AGFG1 | Gene ID | 3267 |
| Gene name | ArfGAP with FG repeats 1 | |
| Gene Alias | HRB | |
| Cytomap | 2q36.3 | |
| Gene Type | protein-coding | GO ID | GO:0000003 | UniProtAcc | P52594 |
Top |
Malignant transformation analysis |
| Identification of the aberrant gene expression in precancerous and cancerous lesions by comparing the gene expression of stem-like cells in diseased tissues with normal stem cells |
| Entrez ID | Symbol | Replicates | Species | Organ | Tissue | Adj P-value | Log2FC | Malignancy |
| 3267 | AGFG1 | CCI_2 | Human | Cervix | CC | 1.61e-05 | 6.88e-01 | 0.5249 |
| 3267 | AGFG1 | CCI_3 | Human | Cervix | CC | 2.63e-12 | 8.29e-01 | 0.516 |
| 3267 | AGFG1 | sample3 | Human | Cervix | CC | 1.60e-07 | 2.32e-01 | 0.1387 |
| 3267 | AGFG1 | T3 | Human | Cervix | CC | 1.07e-04 | 2.21e-01 | 0.1389 |
| 3267 | AGFG1 | HTA11_3410_2000001011 | Human | Colorectum | AD | 2.01e-02 | -3.79e-01 | 0.0155 |
| 3267 | AGFG1 | HTA11_7696_3000711011 | Human | Colorectum | AD | 3.72e-03 | -2.75e-01 | 0.0674 |
| 3267 | AGFG1 | F007 | Human | Colorectum | FAP | 1.22e-03 | -4.16e-01 | 0.1176 |
| 3267 | AGFG1 | A001-C-207 | Human | Colorectum | FAP | 3.34e-07 | -3.47e-01 | 0.1278 |
| 3267 | AGFG1 | A015-C-203 | Human | Colorectum | FAP | 3.88e-36 | -5.30e-01 | -0.1294 |
| 3267 | AGFG1 | A015-C-204 | Human | Colorectum | FAP | 3.14e-09 | -4.80e-01 | -0.0228 |
| 3267 | AGFG1 | A014-C-040 | Human | Colorectum | FAP | 1.44e-06 | -6.57e-01 | -0.1184 |
| 3267 | AGFG1 | A002-C-201 | Human | Colorectum | FAP | 1.28e-20 | -5.50e-01 | 0.0324 |
| 3267 | AGFG1 | A002-C-203 | Human | Colorectum | FAP | 3.42e-07 | -2.60e-01 | 0.2786 |
| 3267 | AGFG1 | A001-C-119 | Human | Colorectum | FAP | 4.02e-08 | -5.20e-01 | -0.1557 |
| 3267 | AGFG1 | A001-C-108 | Human | Colorectum | FAP | 1.31e-23 | -3.92e-01 | -0.0272 |
| 3267 | AGFG1 | A002-C-205 | Human | Colorectum | FAP | 1.52e-25 | -5.74e-01 | -0.1236 |
| 3267 | AGFG1 | A001-C-104 | Human | Colorectum | FAP | 2.37e-08 | -2.70e-01 | 0.0184 |
| 3267 | AGFG1 | A015-C-005 | Human | Colorectum | FAP | 1.88e-03 | -2.91e-01 | -0.0336 |
| 3267 | AGFG1 | A015-C-006 | Human | Colorectum | FAP | 4.12e-16 | -5.79e-01 | -0.0994 |
| 3267 | AGFG1 | A015-C-106 | Human | Colorectum | FAP | 1.21e-19 | -3.97e-01 | -0.0511 |
| Page: 1 2 3 4 5 6 7 8 9 |
| Tissue | Expression Dynamics | Abbreviation |
| Cervix | 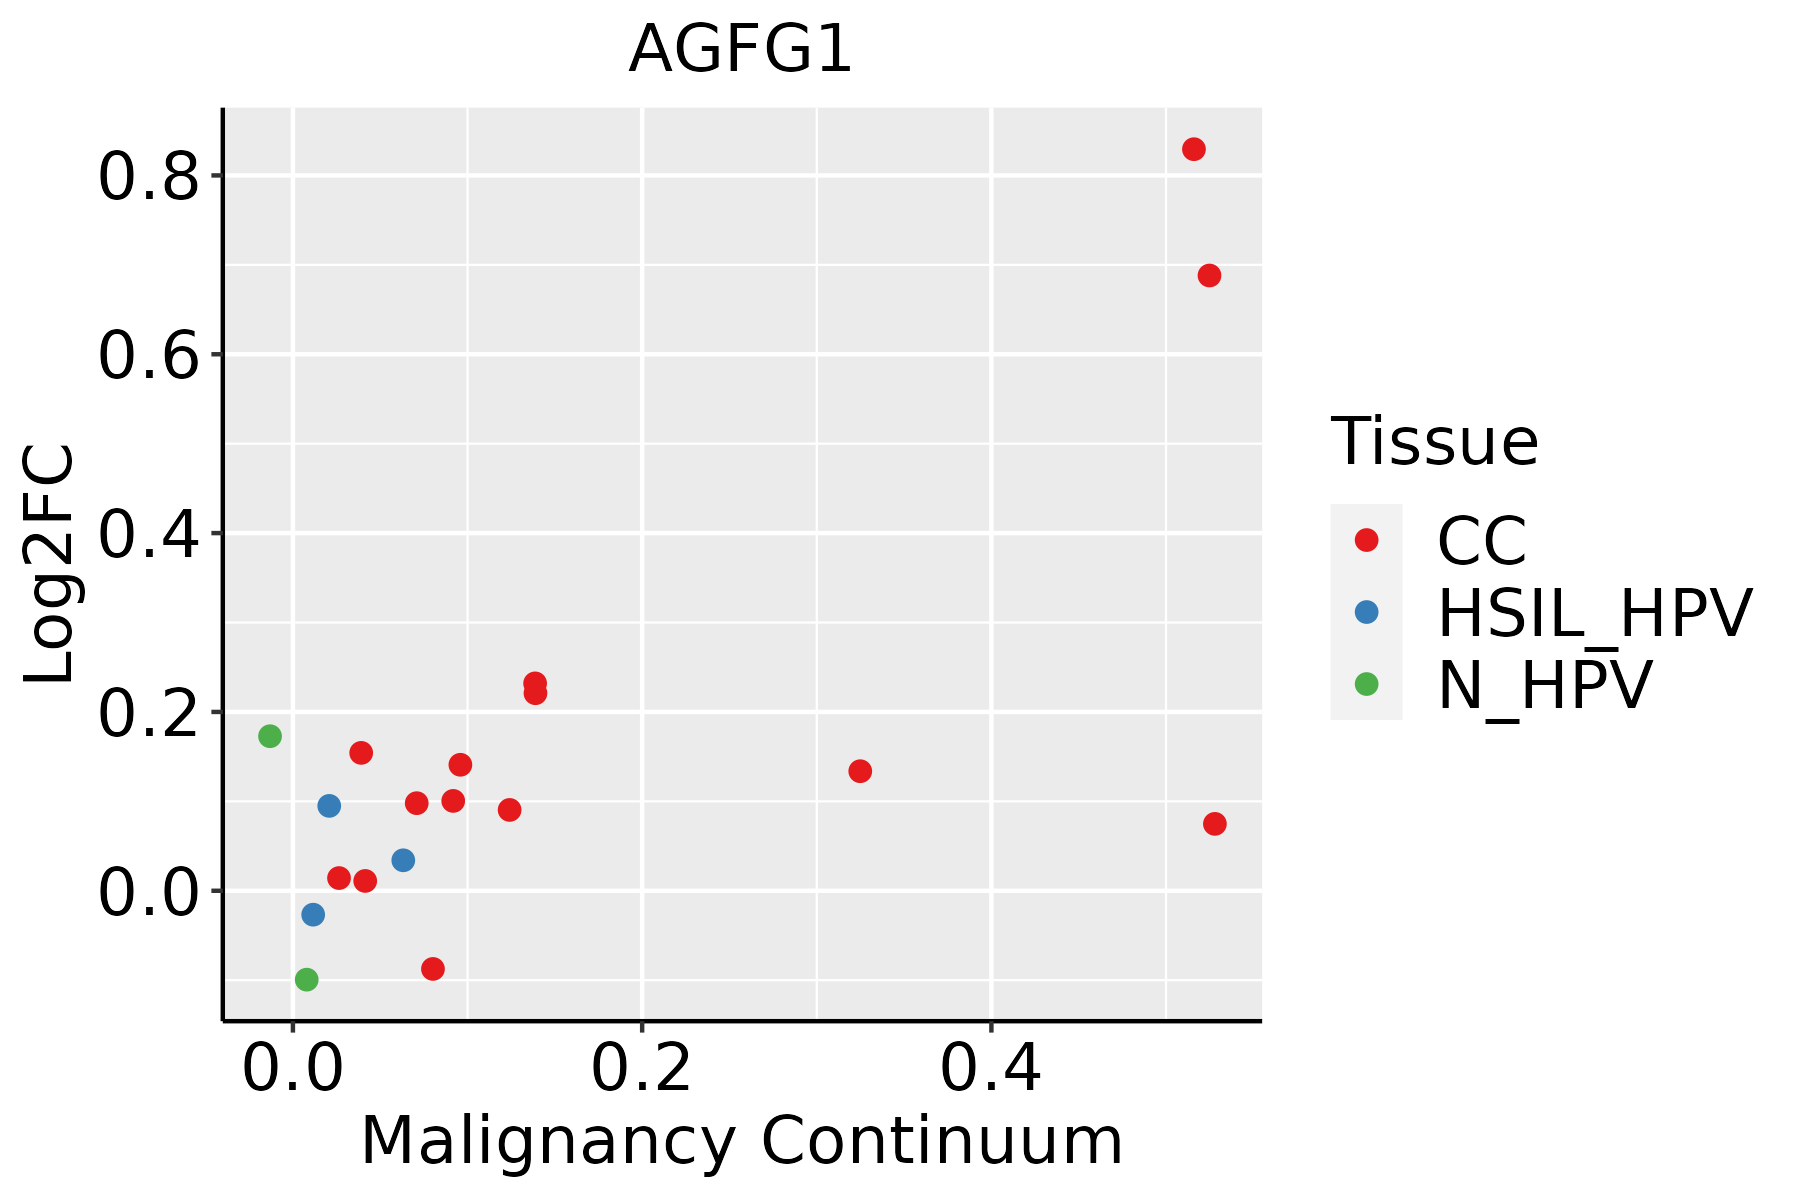 | CC: Cervix cancer |
| HSIL_HPV: HPV-infected high-grade squamous intraepithelial lesions | ||
| N_HPV: HPV-infected normal cervix | ||
| Colorectum (GSE201348) |  | FAP: Familial adenomatous polyposis |
| CRC: Colorectal cancer | ||
| Colorectum (HTA11) |  | AD: Adenomas |
| SER: Sessile serrated lesions | ||
| MSI-H: Microsatellite-high colorectal cancer | ||
| MSS: Microsatellite stable colorectal cancer | ||
| Esophagus | 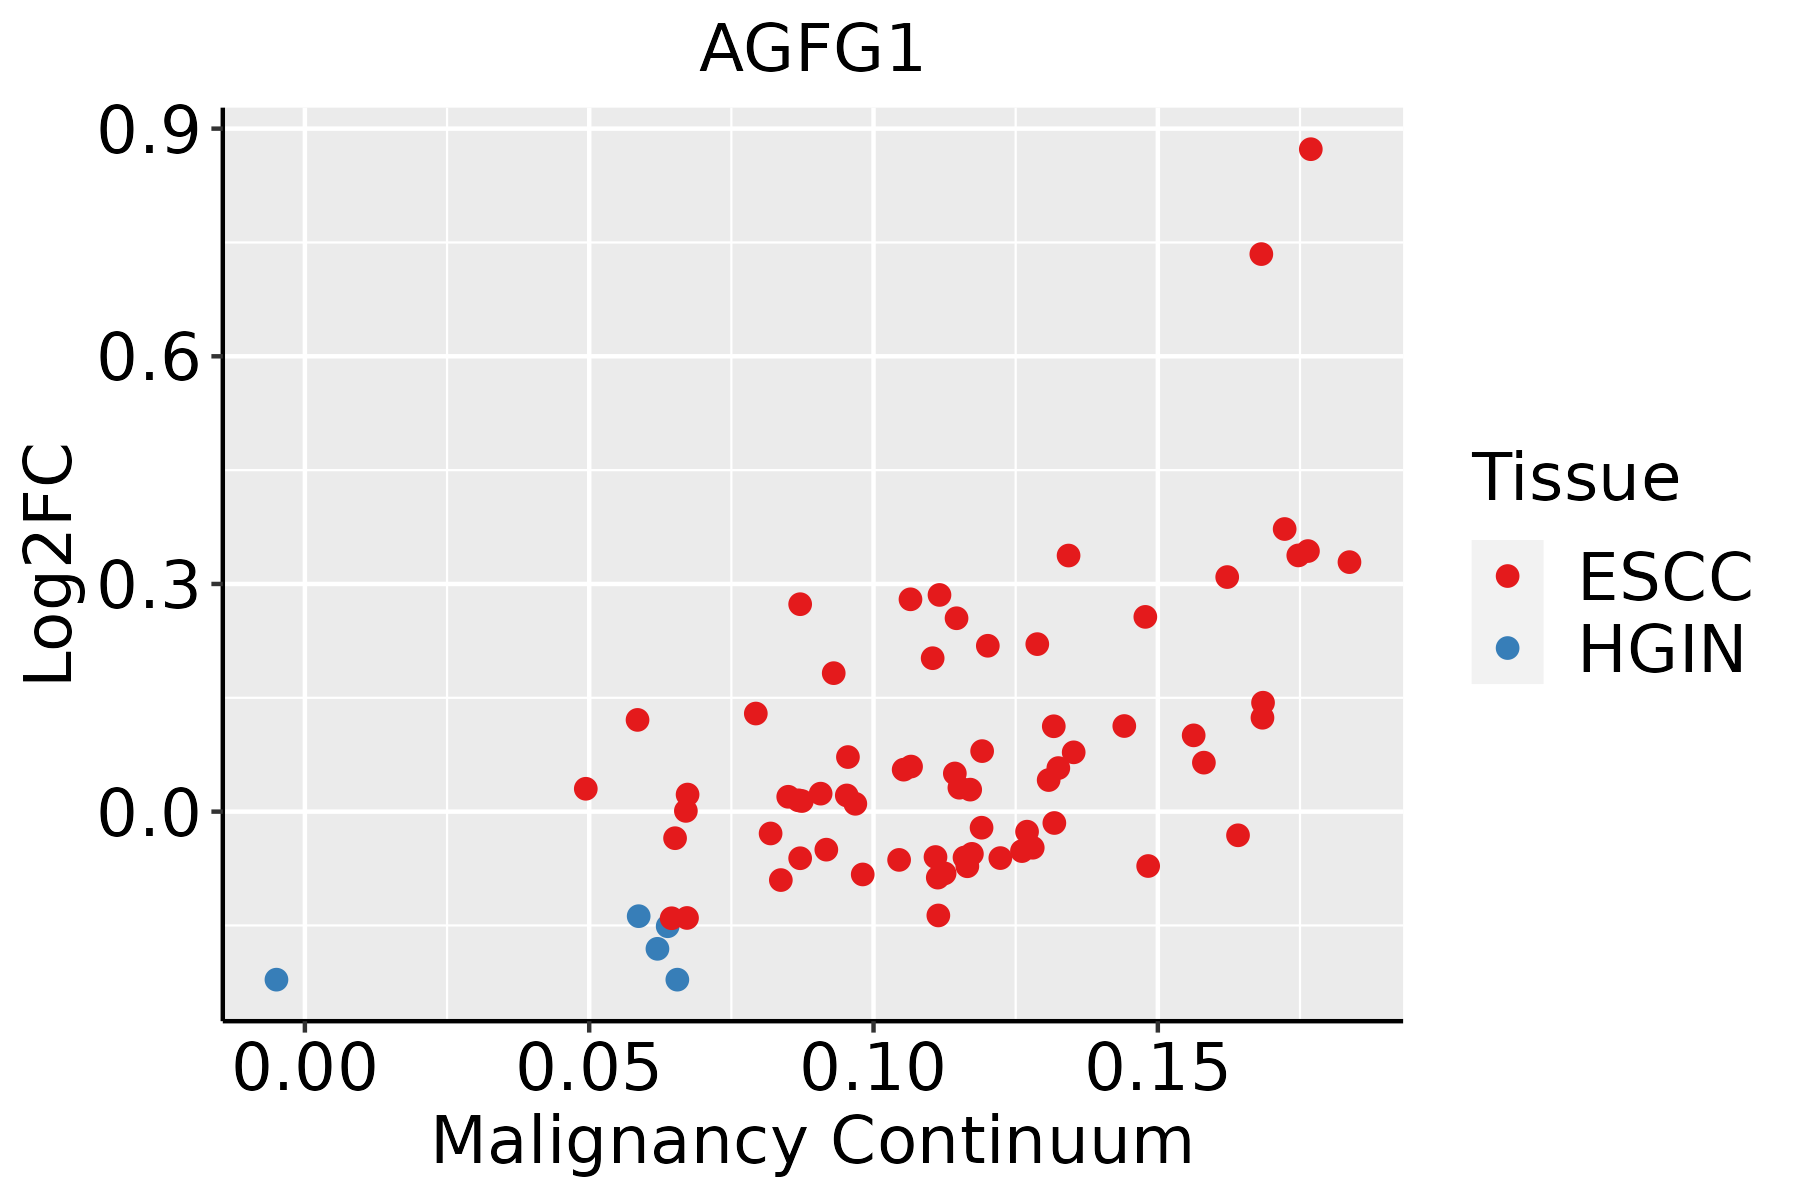 | ESCC: Esophageal squamous cell carcinoma |
| HGIN: High-grade intraepithelial neoplasias | ||
| LGIN: Low-grade intraepithelial neoplasias | ||
| Liver | 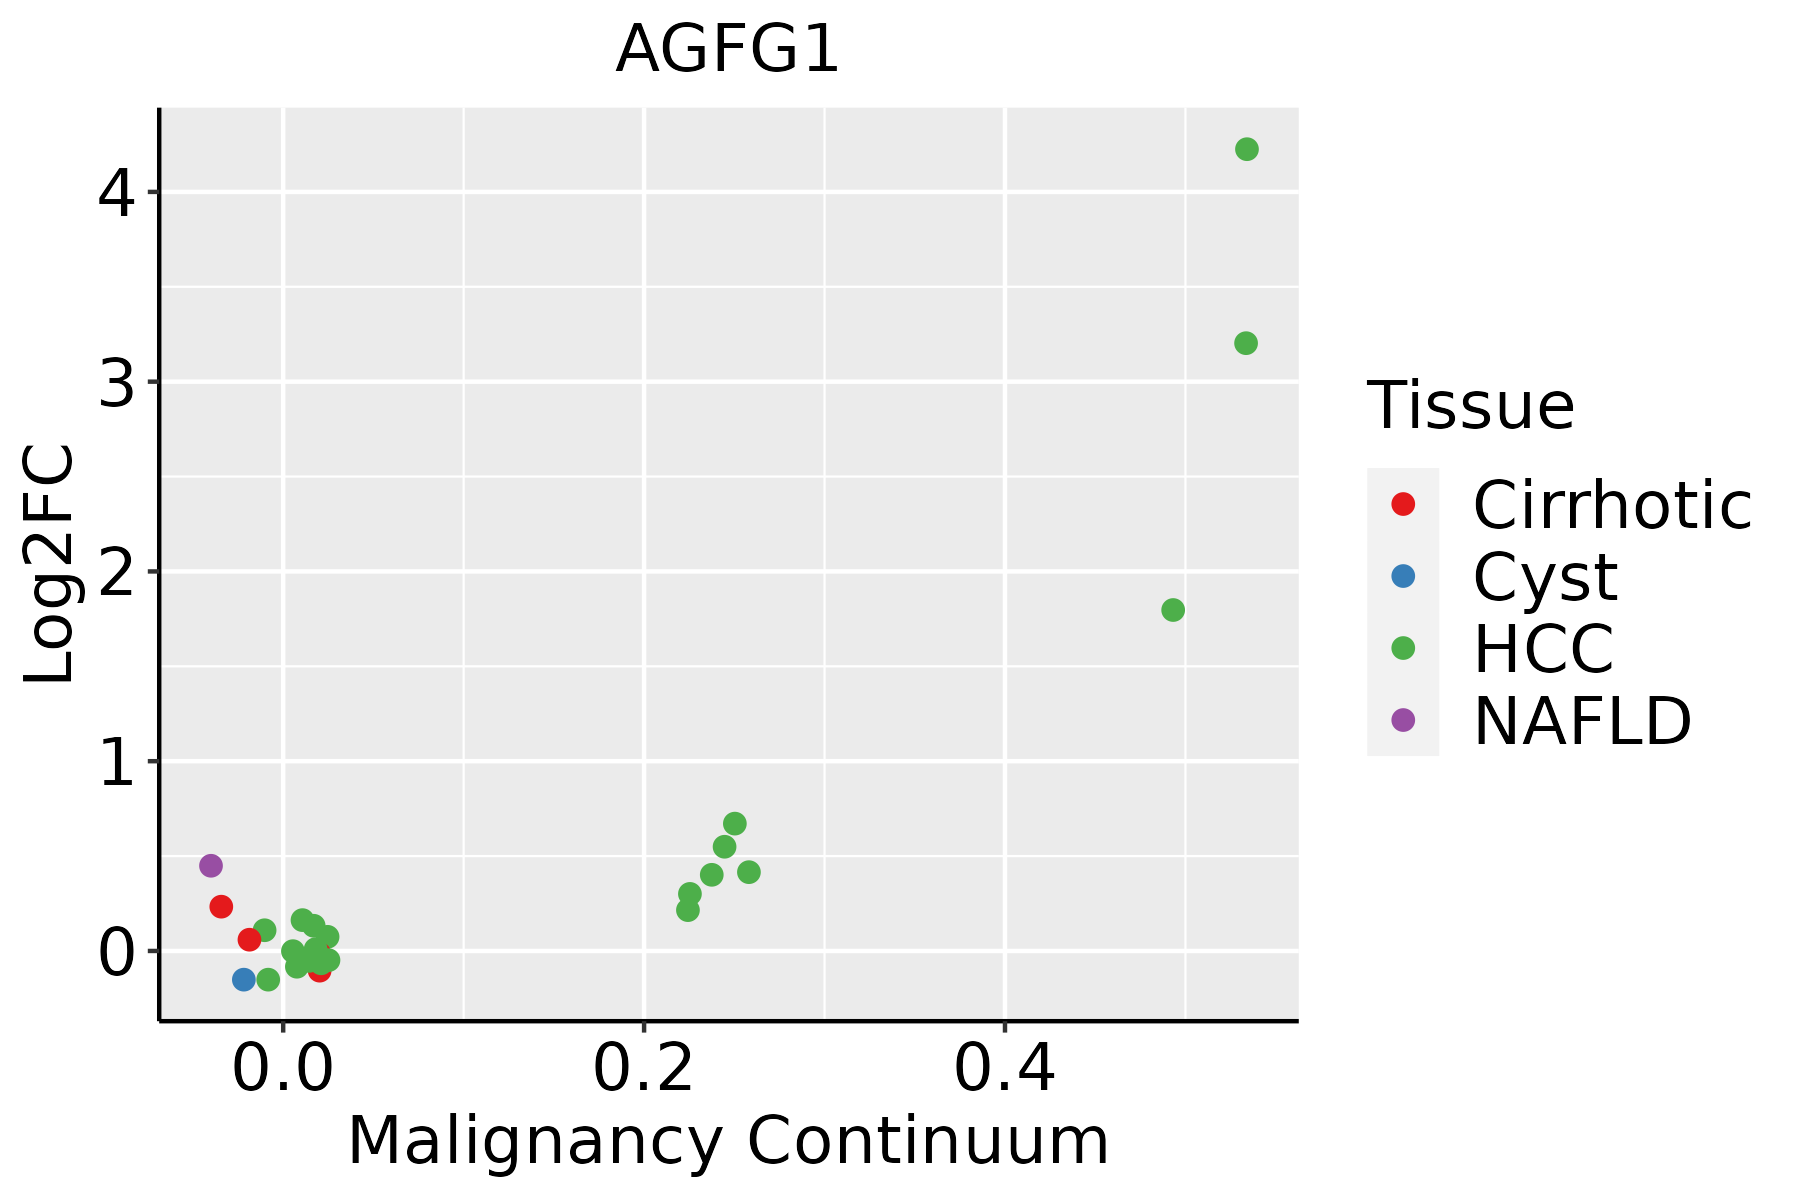 | HCC: Hepatocellular carcinoma |
| NAFLD: Non-alcoholic fatty liver disease | ||
| Lung |  | AAH: Atypical adenomatous hyperplasia |
| AIS: Adenocarcinoma in situ | ||
| IAC: Invasive lung adenocarcinoma | ||
| MIA: Minimally invasive adenocarcinoma | ||
| Oral Cavity | 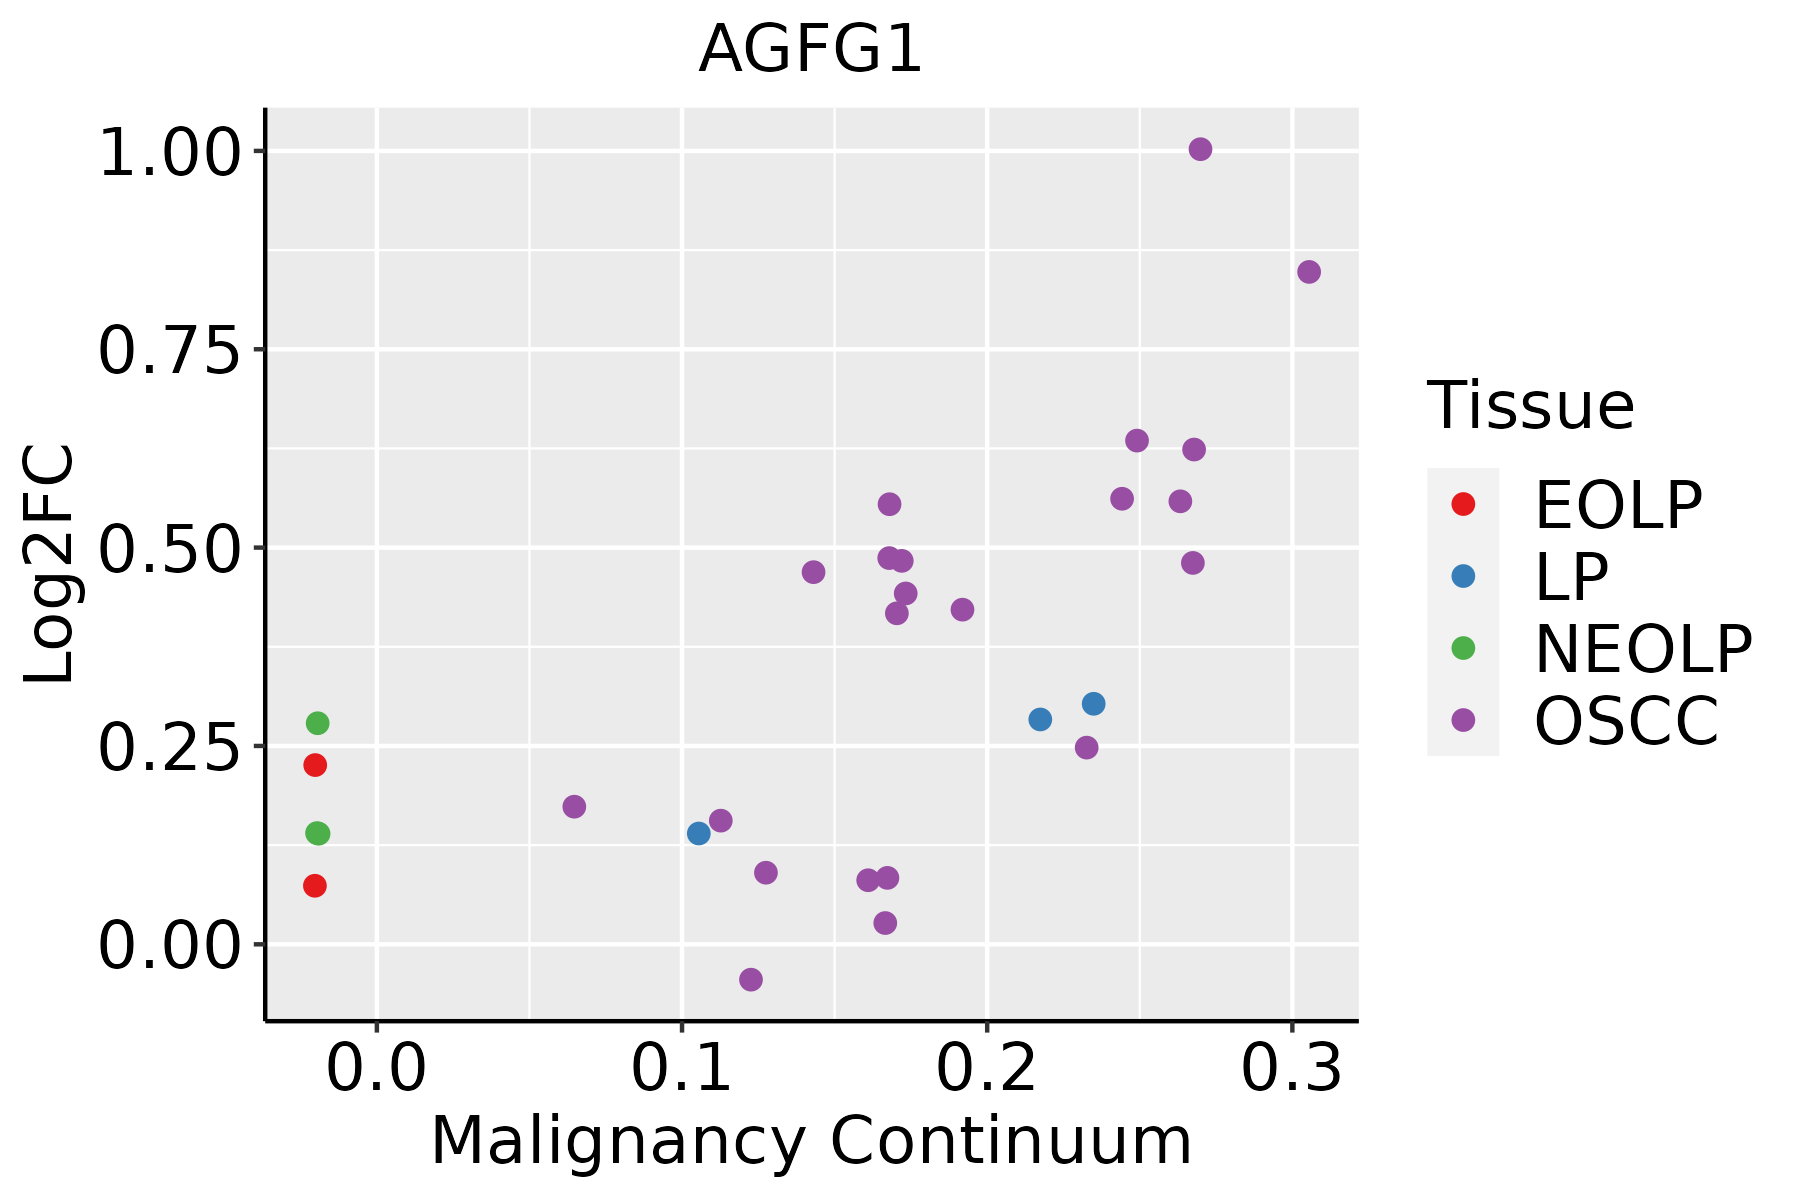 | EOLP: Erosive Oral lichen planus |
| LP: leukoplakia | ||
| NEOLP: Non-erosive oral lichen planus | ||
| OSCC: Oral squamous cell carcinoma | ||
| Prostate | 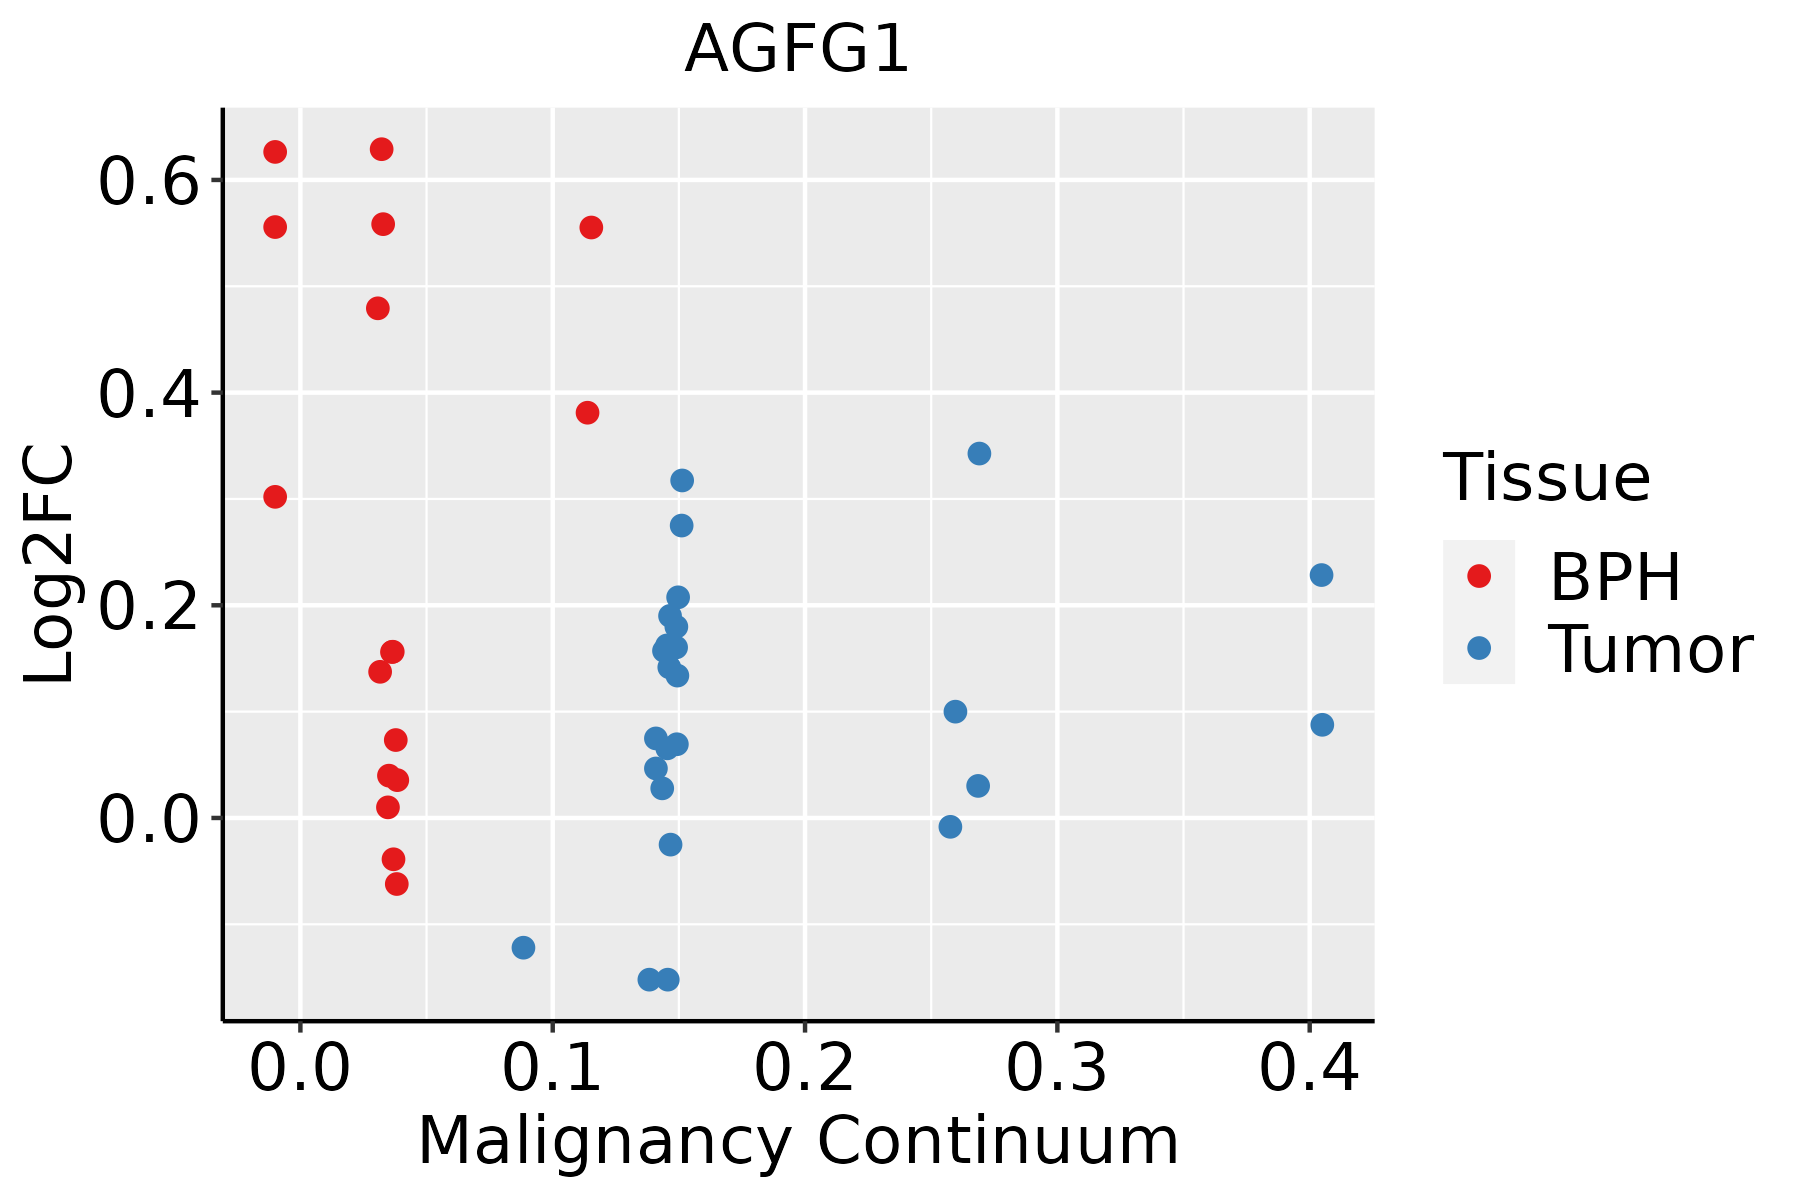 | BPH: Benign Prostatic Hyperplasia |
| Skin | 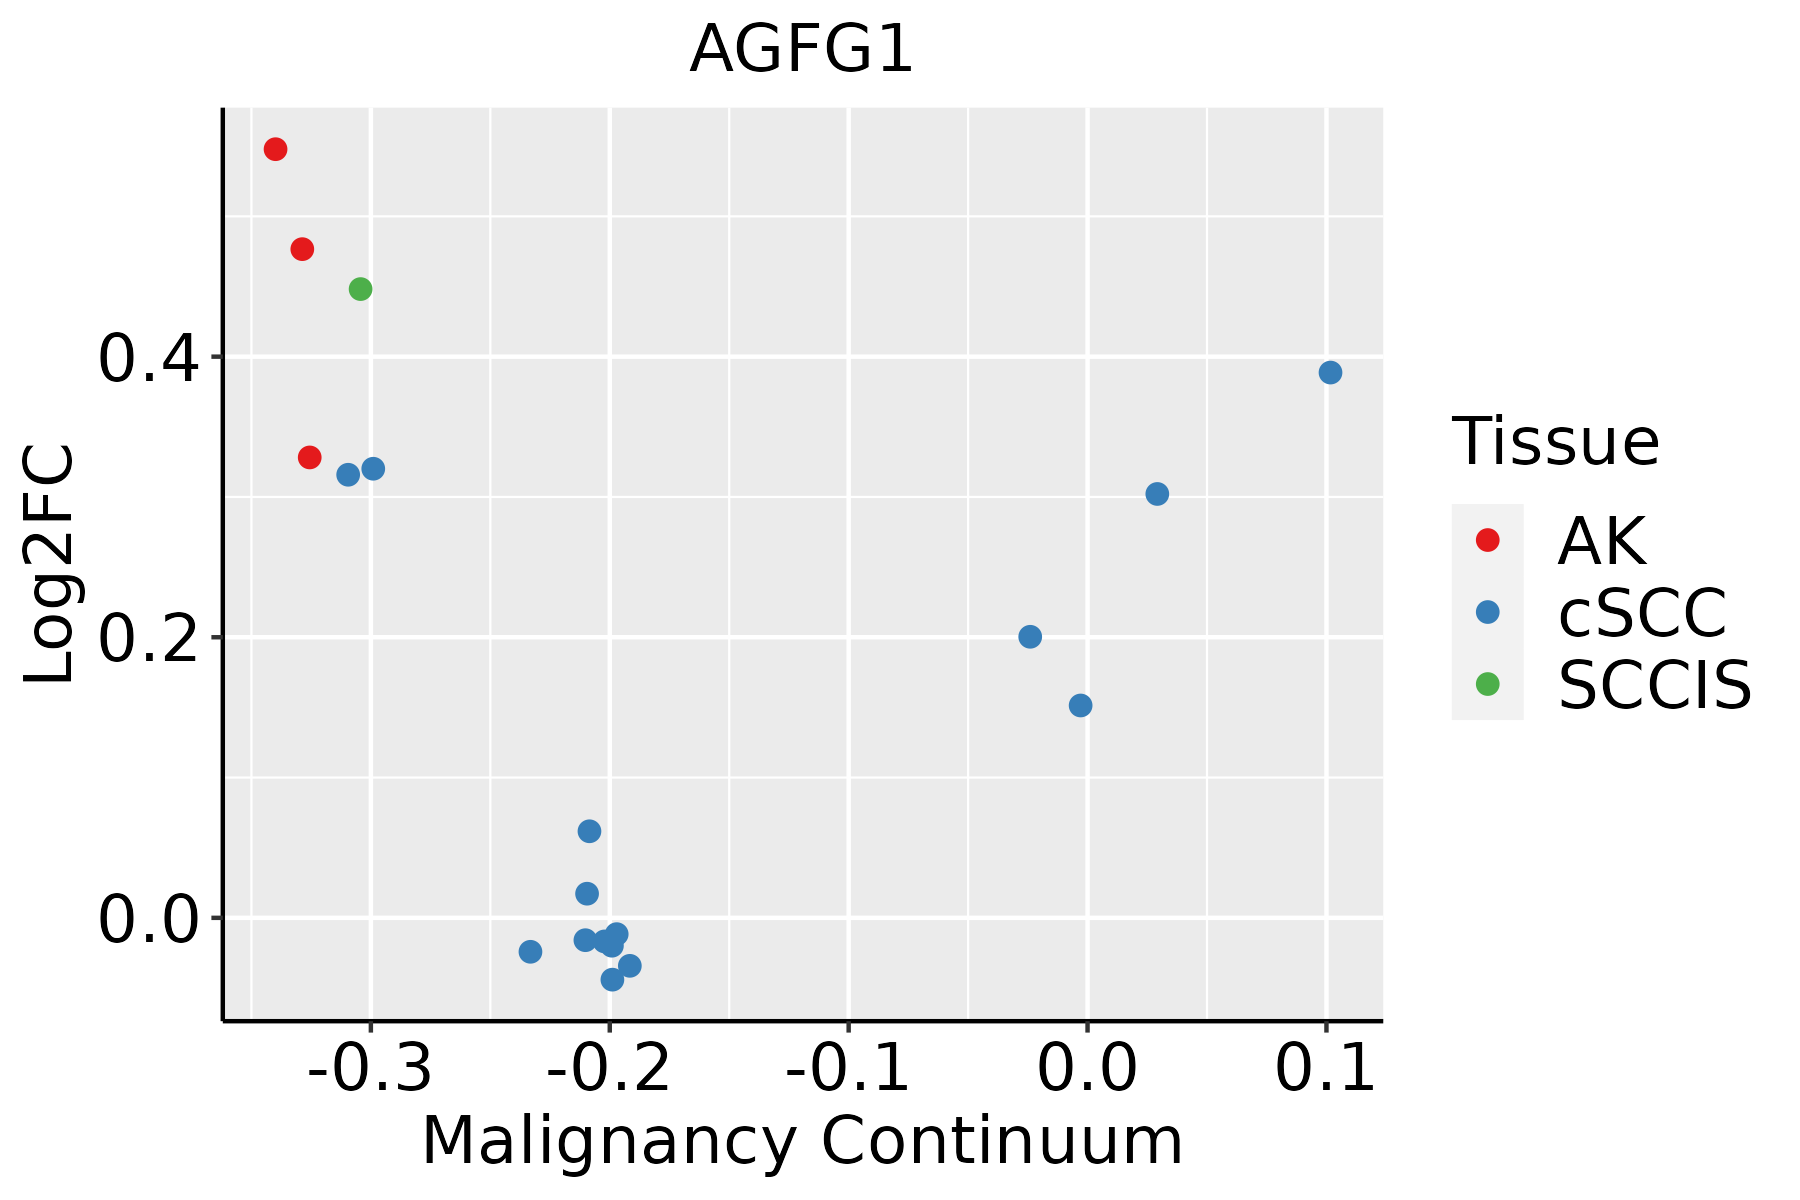 | AK: Actinic keratosis |
| cSCC: Cutaneous squamous cell carcinoma | ||
| SCCIS:squamous cell carcinoma in situ | ||
| Thyroid | 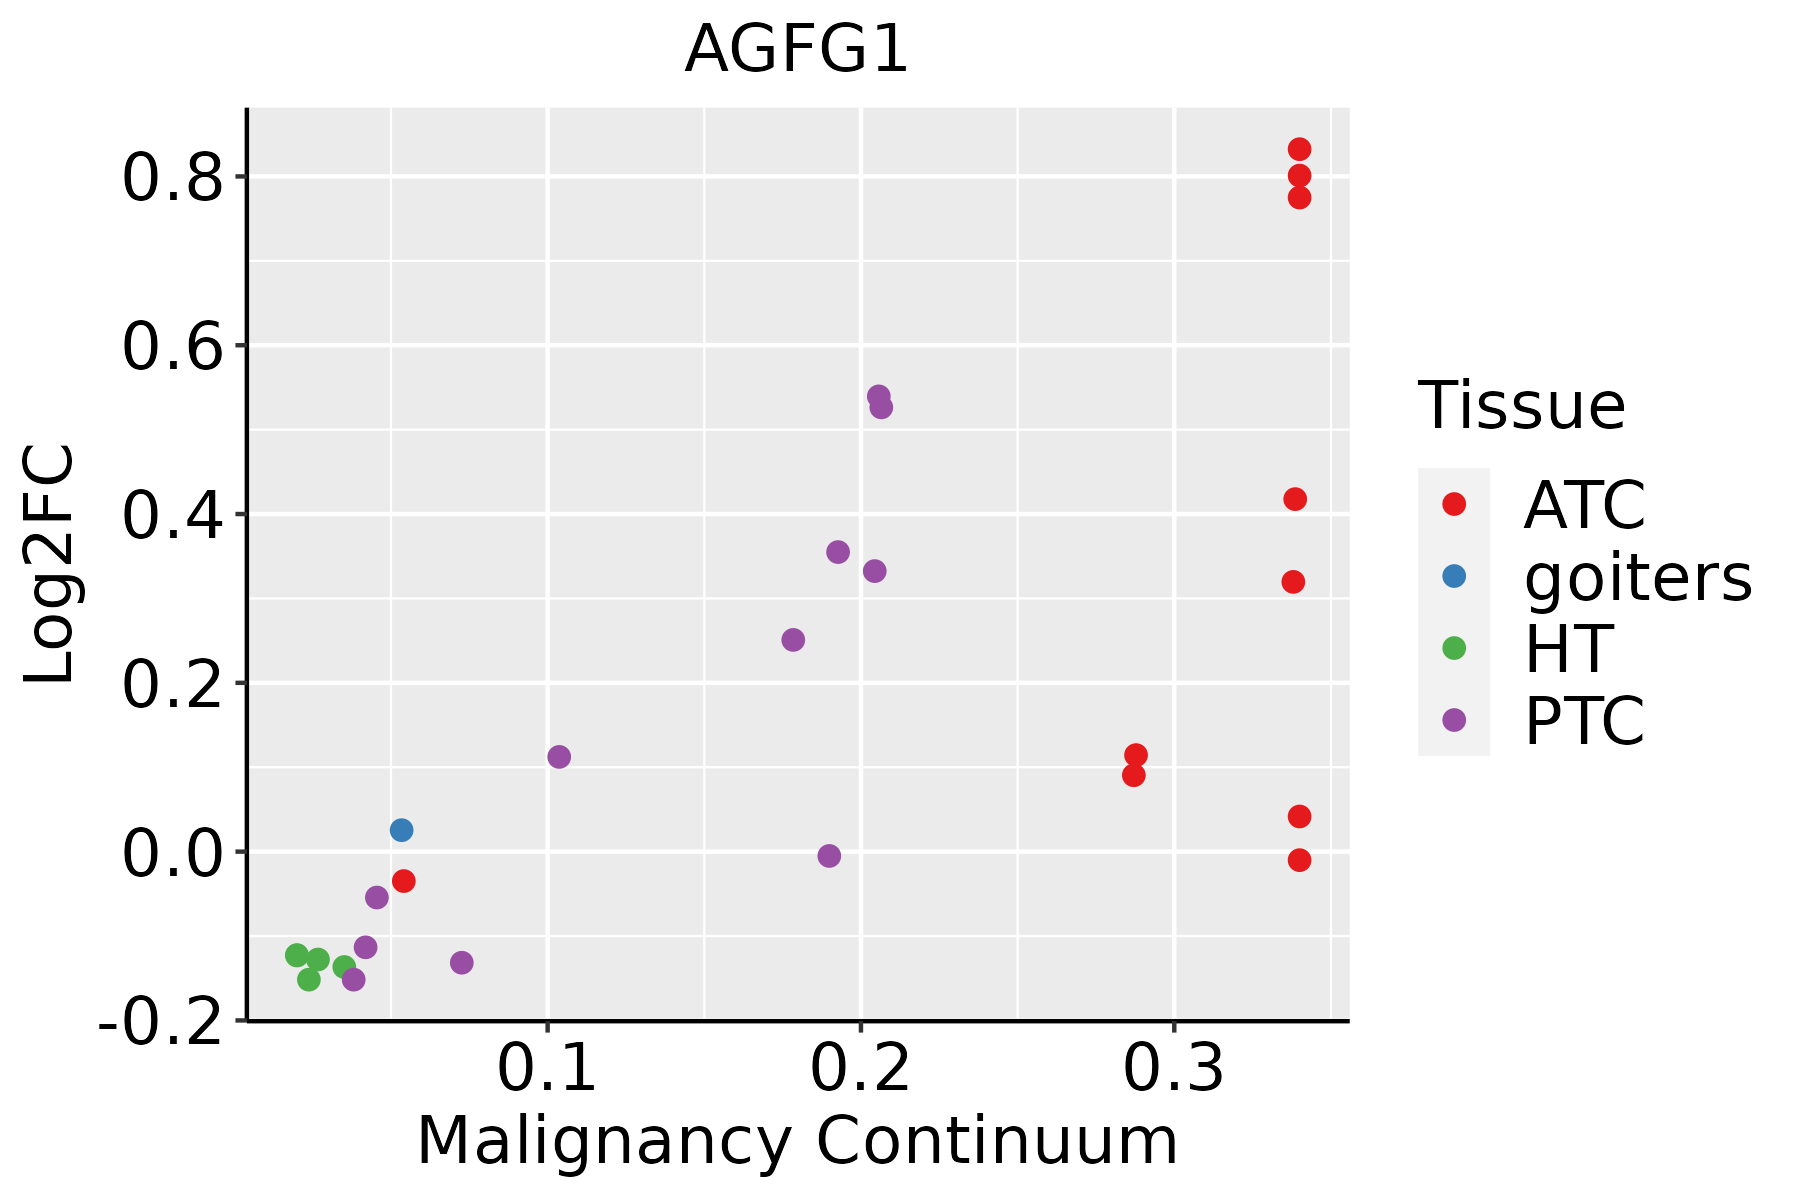 | ATC: Anaplastic thyroid cancer |
| HT: Hashimoto's thyroiditis | ||
| PTC: Papillary thyroid cancer |
| ∗log2FC in expression of this searched gene in stem-like cells from each diseased tissue sample relative to stem-like cells in normal samples in each tissue plotted against the malignancy continuum. Samples are colored based on if they are from different disease stage. |
Top |
Malignant transformation related pathway analysis |
| Find out the enriched GO biological processes and KEGG pathways involved in transition from healthy to precancer to cancer |
| Tissue | Disease Stage | Enriched GO biological Processes |
| Colorectum | AD |  |
| Colorectum | SER |  |
| Colorectum | MSS |  |
| Colorectum | MSI-H |  |
| Colorectum | FAP |  |
| ∗Top 15 enriched GO BP terms are showed in the bar plot of each disease state in each tissue. Each row represents a significant GO biological process which is colored according to the -log10(p.adjust). |
| Page: 1 2 3 4 5 6 7 8 9 |
| GO ID | Tissue | Disease Stage | Description | Gene Ratio | Bg Ratio | pvalue | p.adjust | Count |
| GO:00069139 | Cervix | CC | nucleocytoplasmic transport | 71/2311 | 301/18723 | 4.04e-08 | 2.54e-06 | 71 |
| GO:00511699 | Cervix | CC | nuclear transport | 71/2311 | 301/18723 | 4.04e-08 | 2.54e-06 | 71 |
| GO:00511689 | Cervix | CC | nuclear export | 38/2311 | 154/18723 | 1.86e-05 | 3.46e-04 | 38 |
| GO:00512368 | Cervix | CC | establishment of RNA localization | 39/2311 | 166/18723 | 4.76e-05 | 7.25e-04 | 39 |
| GO:00506578 | Cervix | CC | nucleic acid transport | 38/2311 | 163/18723 | 7.06e-05 | 9.85e-04 | 38 |
| GO:00506588 | Cervix | CC | RNA transport | 38/2311 | 163/18723 | 7.06e-05 | 9.85e-04 | 38 |
| GO:000640310 | Cervix | CC | RNA localization | 43/2311 | 201/18723 | 2.00e-04 | 2.29e-03 | 43 |
| GO:00510284 | Cervix | CC | mRNA transport | 31/2311 | 130/18723 | 2.05e-04 | 2.33e-03 | 31 |
| GO:00159318 | Cervix | CC | nucleobase-containing compound transport | 43/2311 | 222/18723 | 1.72e-03 | 1.30e-02 | 43 |
| GO:00714262 | Cervix | CC | ribonucleoprotein complex export from nucleus | 18/2311 | 76/18723 | 4.45e-03 | 2.71e-02 | 18 |
| GO:00711662 | Cervix | CC | ribonucleoprotein complex localization | 18/2311 | 77/18723 | 5.15e-03 | 3.03e-02 | 18 |
| GO:00064054 | Cervix | CC | RNA export from nucleus | 19/2311 | 84/18723 | 6.02e-03 | 3.43e-02 | 19 |
| GO:0006913 | Colorectum | AD | nucleocytoplasmic transport | 102/3918 | 301/18723 | 1.00e-07 | 4.85e-06 | 102 |
| GO:0051169 | Colorectum | AD | nuclear transport | 102/3918 | 301/18723 | 1.00e-07 | 4.85e-06 | 102 |
| GO:0006403 | Colorectum | AD | RNA localization | 71/3918 | 201/18723 | 1.54e-06 | 4.76e-05 | 71 |
| GO:0051236 | Colorectum | AD | establishment of RNA localization | 58/3918 | 166/18723 | 1.95e-05 | 4.01e-04 | 58 |
| GO:0015931 | Colorectum | AD | nucleobase-containing compound transport | 73/3918 | 222/18723 | 2.02e-05 | 4.10e-04 | 73 |
| GO:0050657 | Colorectum | AD | nucleic acid transport | 57/3918 | 163/18723 | 2.22e-05 | 4.39e-04 | 57 |
| GO:0050658 | Colorectum | AD | RNA transport | 57/3918 | 163/18723 | 2.22e-05 | 4.39e-04 | 57 |
| GO:0051168 | Colorectum | AD | nuclear export | 53/3918 | 154/18723 | 6.89e-05 | 1.11e-03 | 53 |
| Page: 1 2 3 4 5 6 7 8 9 10 11 |
| Pathway ID | Tissue | Disease Stage | Description | Gene Ratio | Bg Ratio | pvalue | p.adjust | qvalue | Count |
| Page: 1 |
Top |
Cell-cell communication analysis |
| Identification of potential cell-cell interactions between two cell types and their ligand-receptor pairs for different disease states |
| Ligand | Receptor | LRpair | Pathway | Tissue | Disease Stage |
| Page: 1 |
Top |
Single-cell gene regulatory network inference analysis |
| Find out the significant the regulons (TFs) and the target genes of each regulon across cell types for different disease states |
| TF | Cell Type | Tissue | Disease Stage | Target Gene | RSS | Regulon Activity |
| ∗The dot plots of a searched regulon are shown for all cell subpopulations in each disease state of each tissue based on the regulon specific score inferred using pySCENIC and by calculating the average expression. |
| Page: 1 |
Top |
Somatic mutation of malignant transformation related genes |
| Annotation of somatic variants for genes involved in malignant transformation |
| Hugo Symbol | Variant Class | Variant Classification | dbSNP RS | HGVSc | HGVSp | HGVSp Short | SWISSPROT | BIOTYPE | SIFT | PolyPhen | Tumor Sample Barcode | Tissue | Histology | Sex | Age | Stage | Therapy Types | Drugs | Outcome |
| AGFG1 | SNV | Missense_Mutation | c.1400N>T | p.Ser467Phe | p.S467F | P52594 | protein_coding | deleterious(0) | benign(0.259) | TCGA-BH-A2L8-01 | Breast | breast invasive carcinoma | Female | <65 | I/II | Chemotherapy | cytoxan | CR | |
| AGFG1 | SNV | Missense_Mutation | novel | c.953N>G | p.Ala318Gly | p.A318G | P52594 | protein_coding | tolerated(0.16) | probably_damaging(0.985) | TCGA-D8-A73U-01 | Breast | breast invasive carcinoma | Female | >=65 | I/II | Hormone Therapy | tamoxiphen | SD |
| AGFG1 | SNV | Missense_Mutation | novel | c.896N>A | p.Ala299Asp | p.A299D | P52594 | protein_coding | tolerated(0.06) | benign(0.03) | TCGA-EA-A3HU-01 | Cervix | cervical & endocervical cancer | Female | <65 | I/II | Unknown | Unknown | SD |
| AGFG1 | SNV | Missense_Mutation | rs755915101 | c.631N>T | p.Pro211Ser | p.P211S | P52594 | protein_coding | deleterious(0.04) | benign(0.011) | TCGA-IR-A3LH-01 | Cervix | cervical & endocervical cancer | Female | <65 | I/II | Chemotherapy | cisplatin | CR |
| AGFG1 | SNV | Missense_Mutation | c.1310C>G | p.Ser437Cys | p.S437C | P52594 | protein_coding | deleterious(0.02) | benign(0.219) | TCGA-Q1-A5R2-01 | Cervix | cervical & endocervical cancer | Female | <65 | I/II | Chemotherapy | cisplatin | PR | |
| AGFG1 | SNV | Missense_Mutation | c.893G>T | p.Ser298Ile | p.S298I | P52594 | protein_coding | deleterious(0.02) | benign(0.441) | TCGA-AA-A00N-01 | Colorectum | colon adenocarcinoma | Male | >=65 | I/II | Unknown | Unknown | PD | |
| AGFG1 | SNV | Missense_Mutation | rs142029380 | c.557N>A | p.Arg186His | p.R186H | P52594 | protein_coding | tolerated(0.08) | benign(0.047) | TCGA-AA-A010-01 | Colorectum | colon adenocarcinoma | Female | <65 | I/II | Chemotherapy | folinic | CR |
| AGFG1 | SNV | Missense_Mutation | c.1700G>A | p.Gly567Asp | p.G567D | P52594 | protein_coding | deleterious(0) | benign(0.076) | TCGA-AD-6895-01 | Colorectum | colon adenocarcinoma | Male | >=65 | III/IV | Unknown | Unknown | SD | |
| AGFG1 | SNV | Missense_Mutation | novel | c.56A>C | p.Asp19Ala | p.D19A | P52594 | protein_coding | deleterious(0) | benign(0.043) | TCGA-AM-5821-01 | Colorectum | colon adenocarcinoma | Female | >=65 | I/II | Unknown | Unknown | SD |
| AGFG1 | SNV | Missense_Mutation | novel | c.1482N>T | p.Met494Ile | p.M494I | P52594 | protein_coding | deleterious(0) | benign(0.021) | TCGA-AZ-4315-01 | Colorectum | colon adenocarcinoma | Male | <65 | I/II | Unknown | Unknown | SD |
| Page: 1 2 3 4 5 |
Top |
Related drugs of malignant transformation related genes |
| Identification of chemicals and drugs interact with genes involved in malignant transfromation |
| (DGIdb 4.0) |
| Entrez ID | Symbol | Category | Interaction Types | Drug Claim Name | Drug Name | PMIDs |
| Page: 1 |

Copyright 2023-Present -The University of Texas Health Science Center at Houston |