
|
|||||
|
 | |
| |
| |
| |
| |
| |
|
Gene: AGBL4 |
Gene summary for AGBL4 |
| Gene information | Species | Human | Gene symbol | AGBL4 | Gene ID | 84871 |
| Gene name | AGBL carboxypeptidase 4 | |
| Gene Alias | CCP6 | |
| Cytomap | 1p33 | |
| Gene Type | protein-coding | GO ID | GO:0001701 | UniProtAcc | Q5VU57 |
Top |
Malignant transformation analysis |
| Identification of the aberrant gene expression in precancerous and cancerous lesions by comparing the gene expression of stem-like cells in diseased tissues with normal stem cells |
| Entrez ID | Symbol | Replicates | Species | Organ | Tissue | Adj P-value | Log2FC | Malignancy |
| 84871 | AGBL4 | HTA11_1938_2000001011 | Human | Colorectum | AD | 1.41e-13 | 6.81e-01 | -0.0811 |
| 84871 | AGBL4 | HTA11_78_2000001011 | Human | Colorectum | AD | 4.03e-14 | 7.22e-01 | -0.1088 |
| 84871 | AGBL4 | HTA11_83_2000001011 | Human | Colorectum | SER | 2.82e-04 | 3.73e-01 | -0.1526 |
| 84871 | AGBL4 | HTA11_696_2000001011 | Human | Colorectum | AD | 3.86e-03 | 1.18e-01 | -0.1464 |
| 84871 | AGBL4 | HTA11_1391_2000001011 | Human | Colorectum | AD | 7.52e-03 | 3.20e-01 | -0.059 |
| 84871 | AGBL4 | HTA11_7696_3000711011 | Human | Colorectum | AD | 2.85e-05 | 1.17e-01 | 0.0674 |
| 84871 | AGBL4 | HTA11_6818_2000001021 | Human | Colorectum | AD | 1.34e-09 | 6.80e-01 | 0.0588 |
| 84871 | AGBL4 | HTA11_99999970781_79442 | Human | Colorectum | MSS | 4.36e-18 | 5.60e-01 | 0.294 |
| 84871 | AGBL4 | HTA11_99999965062_69753 | Human | Colorectum | MSI-H | 5.41e-05 | 1.25e+00 | 0.3487 |
| 84871 | AGBL4 | HTA11_99999965104_69814 | Human | Colorectum | MSS | 1.12e-03 | 3.70e-01 | 0.281 |
| 84871 | AGBL4 | F007 | Human | Colorectum | FAP | 2.41e-03 | 4.86e-01 | 0.1176 |
| 84871 | AGBL4 | A001-C-207 | Human | Colorectum | FAP | 1.30e-33 | 1.11e+00 | 0.1278 |
| 84871 | AGBL4 | A015-C-204 | Human | Colorectum | FAP | 1.81e-12 | 7.12e-01 | -0.0228 |
| 84871 | AGBL4 | A002-C-203 | Human | Colorectum | FAP | 4.14e-06 | 4.16e-01 | 0.2786 |
| 84871 | AGBL4 | A001-C-108 | Human | Colorectum | FAP | 7.38e-37 | 1.05e+00 | -0.0272 |
| 84871 | AGBL4 | A001-C-104 | Human | Colorectum | FAP | 2.15e-35 | 1.03e+00 | 0.0184 |
| 84871 | AGBL4 | A015-C-006 | Human | Colorectum | FAP | 2.44e-11 | 6.92e-01 | -0.0994 |
| 84871 | AGBL4 | A015-C-106 | Human | Colorectum | FAP | 4.77e-03 | 3.43e-01 | -0.0511 |
| 84871 | AGBL4 | A001-C-014 | Human | Colorectum | FAP | 1.69e-14 | 7.48e-01 | 0.0135 |
| 84871 | AGBL4 | A015-C-002 | Human | Colorectum | FAP | 7.16e-12 | 7.64e-01 | -0.0763 |
| Page: 1 2 3 |
| Tissue | Expression Dynamics | Abbreviation |
| Colorectum (GSE201348) |  | FAP: Familial adenomatous polyposis |
| CRC: Colorectal cancer | ||
| Colorectum (HTA11) | 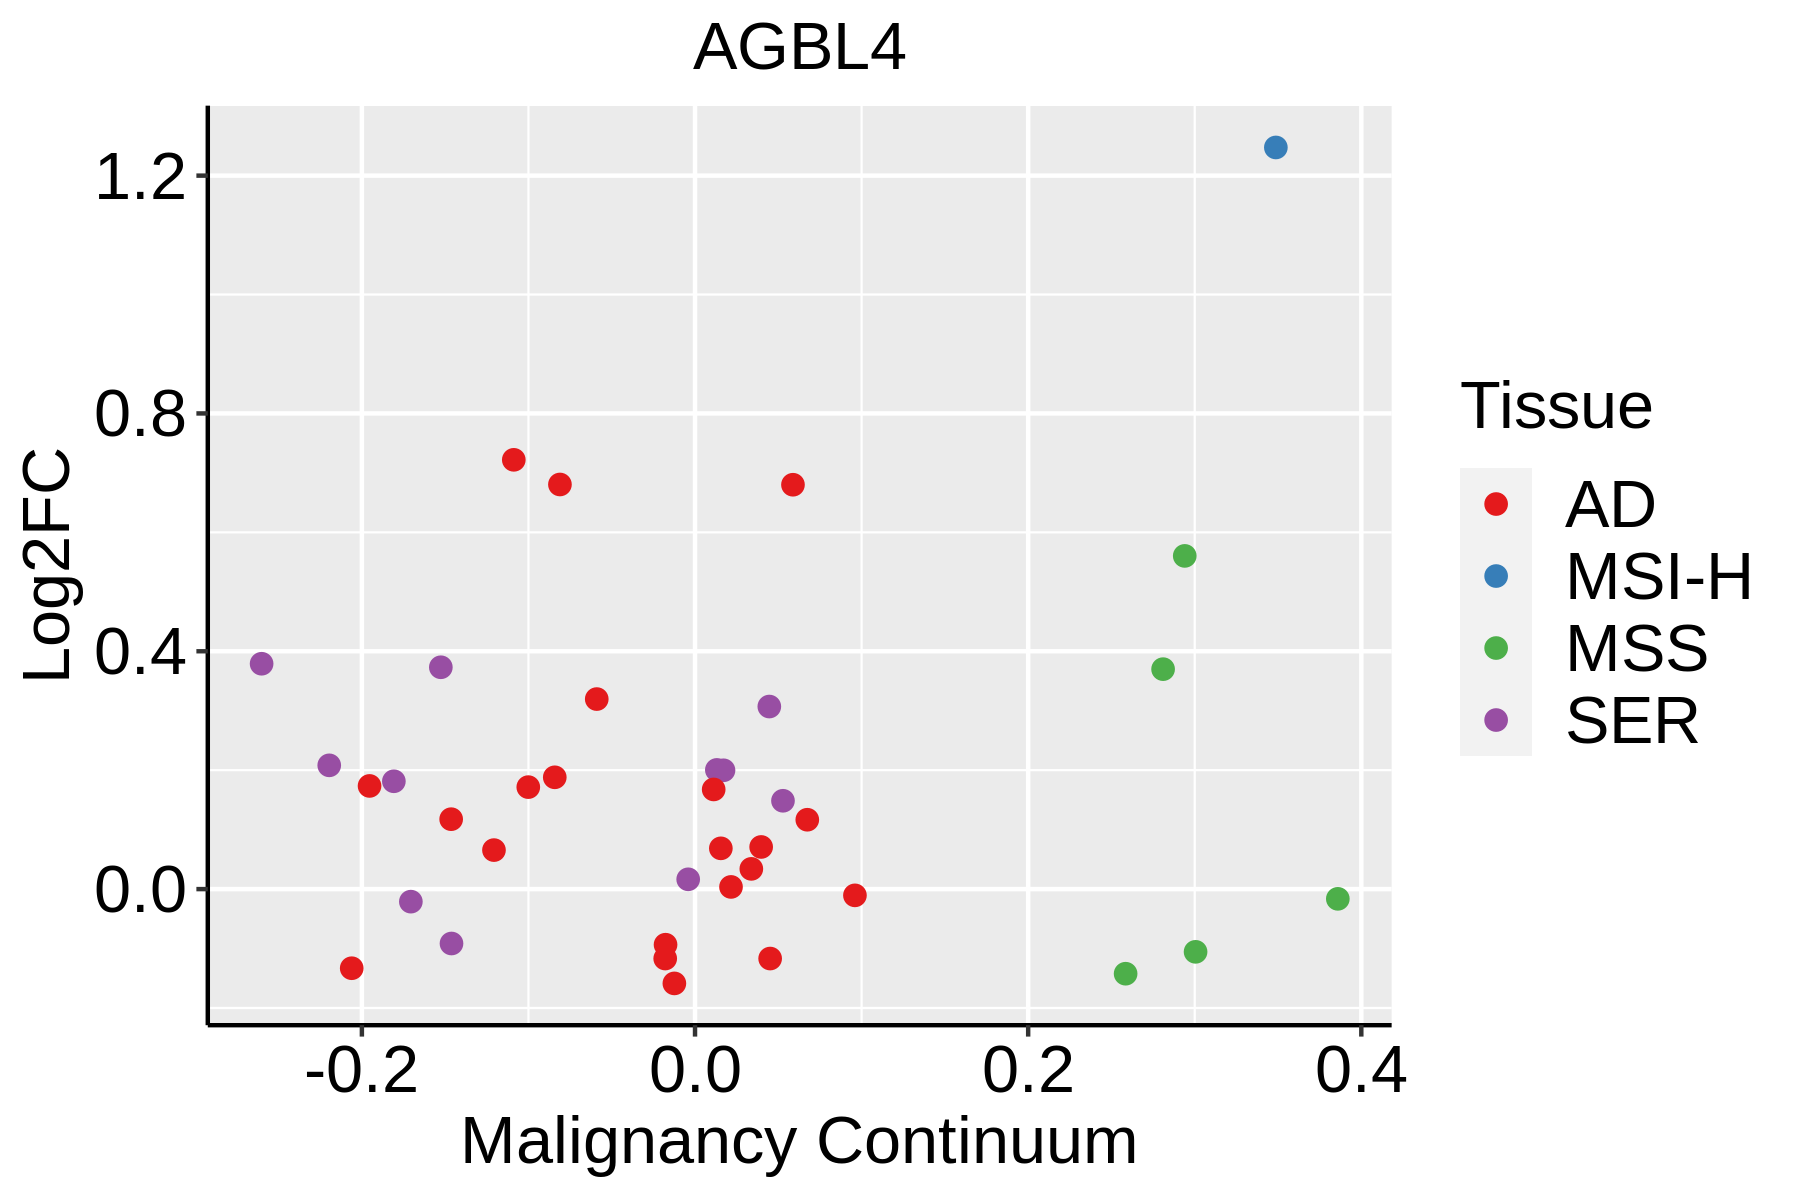 | AD: Adenomas |
| SER: Sessile serrated lesions | ||
| MSI-H: Microsatellite-high colorectal cancer | ||
| MSS: Microsatellite stable colorectal cancer | ||
| Lung |  | AAH: Atypical adenomatous hyperplasia |
| AIS: Adenocarcinoma in situ | ||
| IAC: Invasive lung adenocarcinoma | ||
| MIA: Minimally invasive adenocarcinoma |
| ∗log2FC in expression of this searched gene in stem-like cells from each diseased tissue sample relative to stem-like cells in normal samples in each tissue plotted against the malignancy continuum. Samples are colored based on if they are from different disease stage. |
Top |
Malignant transformation related pathway analysis |
| Find out the enriched GO biological processes and KEGG pathways involved in transition from healthy to precancer to cancer |
| Tissue | Disease Stage | Enriched GO biological Processes |
| Colorectum | AD |  |
| Colorectum | SER |  |
| Colorectum | MSS |  |
| Colorectum | MSI-H |  |
| Colorectum | FAP |  |
| ∗Top 15 enriched GO BP terms are showed in the bar plot of each disease state in each tissue. Each row represents a significant GO biological process which is colored according to the -log10(p.adjust). |
| Page: 1 2 3 4 5 6 7 8 9 |
| GO ID | Tissue | Disease Stage | Description | Gene Ratio | Bg Ratio | pvalue | p.adjust | Count |
| GO:0042176 | Colorectum | AD | regulation of protein catabolic process | 160/3918 | 391/18723 | 1.06e-19 | 7.34e-17 | 160 |
| GO:0009896 | Colorectum | AD | positive regulation of catabolic process | 180/3918 | 492/18723 | 4.33e-16 | 1.94e-13 | 180 |
| GO:1903362 | Colorectum | AD | regulation of cellular protein catabolic process | 109/3918 | 255/18723 | 2.14e-15 | 6.08e-13 | 109 |
| GO:0031331 | Colorectum | AD | positive regulation of cellular catabolic process | 156/3918 | 427/18723 | 4.68e-14 | 1.05e-11 | 156 |
| GO:1903050 | Colorectum | AD | regulation of proteolysis involved in cellular protein catabolic process | 92/3918 | 221/18723 | 2.04e-12 | 3.19e-10 | 92 |
| GO:0045732 | Colorectum | AD | positive regulation of protein catabolic process | 92/3918 | 231/18723 | 3.85e-11 | 4.47e-09 | 92 |
| GO:0045862 | Colorectum | AD | positive regulation of proteolysis | 129/3918 | 372/18723 | 4.04e-10 | 3.46e-08 | 129 |
| GO:2000058 | Colorectum | AD | regulation of ubiquitin-dependent protein catabolic process | 68/3918 | 164/18723 | 1.82e-09 | 1.31e-07 | 68 |
| GO:0051656 | Colorectum | AD | establishment of organelle localization | 131/3918 | 390/18723 | 3.00e-09 | 2.06e-07 | 131 |
| GO:1903364 | Colorectum | AD | positive regulation of cellular protein catabolic process | 62/3918 | 155/18723 | 4.66e-08 | 2.51e-06 | 62 |
| GO:1903052 | Colorectum | AD | positive regulation of proteolysis involved in cellular protein catabolic process | 53/3918 | 133/18723 | 4.93e-07 | 1.85e-05 | 53 |
| GO:2000060 | Colorectum | AD | positive regulation of ubiquitin-dependent protein catabolic process | 44/3918 | 107/18723 | 1.65e-06 | 5.03e-05 | 44 |
| GO:0001701 | Colorectum | AD | in utero embryonic development | 110/3918 | 367/18723 | 2.36e-05 | 4.62e-04 | 110 |
| GO:0030705 | Colorectum | AD | cytoskeleton-dependent intracellular transport | 60/3918 | 195/18723 | 7.56e-04 | 7.59e-03 | 60 |
| GO:0072384 | Colorectum | AD | organelle transport along microtubule | 28/3918 | 85/18723 | 6.55e-03 | 4.07e-02 | 28 |
| GO:00421761 | Colorectum | SER | regulation of protein catabolic process | 126/2897 | 391/18723 | 5.33e-17 | 2.52e-14 | 126 |
| GO:19033621 | Colorectum | SER | regulation of cellular protein catabolic process | 91/2897 | 255/18723 | 1.22e-15 | 5.36e-13 | 91 |
| GO:19030501 | Colorectum | SER | regulation of proteolysis involved in cellular protein catabolic process | 77/2897 | 221/18723 | 7.85e-13 | 2.00e-10 | 77 |
| GO:00457321 | Colorectum | SER | positive regulation of protein catabolic process | 77/2897 | 231/18723 | 9.91e-12 | 1.90e-09 | 77 |
| GO:00098961 | Colorectum | SER | positive regulation of catabolic process | 132/2897 | 492/18723 | 4.16e-11 | 6.72e-09 | 132 |
| Page: 1 2 3 4 5 6 7 |
| Pathway ID | Tissue | Disease Stage | Description | Gene Ratio | Bg Ratio | pvalue | p.adjust | qvalue | Count |
| Page: 1 |
Top |
Cell-cell communication analysis |
| Identification of potential cell-cell interactions between two cell types and their ligand-receptor pairs for different disease states |
| Ligand | Receptor | LRpair | Pathway | Tissue | Disease Stage |
| Page: 1 |
Top |
Single-cell gene regulatory network inference analysis |
| Find out the significant the regulons (TFs) and the target genes of each regulon across cell types for different disease states |
| TF | Cell Type | Tissue | Disease Stage | Target Gene | RSS | Regulon Activity |
| ∗The dot plots of a searched regulon are shown for all cell subpopulations in each disease state of each tissue based on the regulon specific score inferred using pySCENIC and by calculating the average expression. |
| Page: 1 |
Top |
Somatic mutation of malignant transformation related genes |
| Annotation of somatic variants for genes involved in malignant transformation |
| Hugo Symbol | Variant Class | Variant Classification | dbSNP RS | HGVSc | HGVSp | HGVSp Short | SWISSPROT | BIOTYPE | SIFT | PolyPhen | Tumor Sample Barcode | Tissue | Histology | Sex | Age | Stage | Therapy Types | Drugs | Outcome |
| AGBL4 | SNV | Missense_Mutation | novel | c.916N>A | p.Val306Met | p.V306M | Q5VU57 | protein_coding | deleterious(0.01) | possibly_damaging(0.626) | TCGA-A8-A079-01 | Breast | breast invasive carcinoma | Female | >=65 | III/IV | Chemotherapy | 5-fluorouracil | SD |
| AGBL4 | SNV | Missense_Mutation | novel | c.731N>C | p.Ile244Thr | p.I244T | Q5VU57 | protein_coding | deleterious(0.05) | probably_damaging(0.978) | TCGA-OL-A5DA-01 | Breast | breast invasive carcinoma | Female | <65 | I/II | Unknown | Unknown | SD |
| AGBL4 | SNV | Missense_Mutation | novel | c.1132N>C | p.Val378Leu | p.V378L | Q5VU57 | protein_coding | tolerated(0.42) | benign(0.079) | TCGA-PE-A5DC-01 | Breast | breast invasive carcinoma | Female | >=65 | III/IV | Unknown | Unknown | SD |
| AGBL4 | insertion | Frame_Shift_Ins | novel | c.698_699insCCTGGTTCTCTGGCCTCAGCCTCATACACTCAGCCCCACACAGCTG | p.Glu233AspfsTer28 | p.E233Dfs*28 | Q5VU57 | protein_coding | TCGA-A2-A0CQ-01 | Breast | breast invasive carcinoma | Female | <65 | I/II | Chemotherapy | adriamycin | SD | ||
| AGBL4 | insertion | Frame_Shift_Ins | novel | c.513_514insTTTAAAACATATATAATTAAGGATAGAATGAGTTTTTTAAGAAGTT | p.Thr172PhefsTer23 | p.T172Ffs*23 | Q5VU57 | protein_coding | TCGA-A2-A0CX-01 | Breast | breast invasive carcinoma | Female | <65 | I/II | Chemotherapy | adriamycin | SD | ||
| AGBL4 | SNV | Missense_Mutation | novel | c.1418A>G | p.His473Arg | p.H473R | Q5VU57 | protein_coding | tolerated_low_confidence(1) | benign(0.029) | TCGA-2W-A8YY-01 | Cervix | cervical & endocervical cancer | Female | <65 | I/II | Chemotherapy | cisplatin | CR |
| AGBL4 | SNV | Missense_Mutation | c.475G>T | p.Asp159Tyr | p.D159Y | Q5VU57 | protein_coding | deleterious(0) | probably_damaging(0.947) | TCGA-EA-A44S-01 | Cervix | cervical & endocervical cancer | Female | <65 | III/IV | Chemotherapy | carboplatin | SD | |
| AGBL4 | SNV | Missense_Mutation | rs748307842 | c.868C>T | p.Arg290Cys | p.R290C | Q5VU57 | protein_coding | deleterious(0) | probably_damaging(1) | TCGA-FU-A3HZ-01 | Cervix | cervical & endocervical cancer | Female | <65 | I/II | Chemotherapy | cisplatin | CR |
| AGBL4 | SNV | Missense_Mutation | c.1150C>T | p.Arg384Cys | p.R384C | Q5VU57 | protein_coding | deleterious(0) | probably_damaging(1) | TCGA-AA-3864-01 | Colorectum | colon adenocarcinoma | Male | >=65 | I/II | Unknown | Unknown | SD | |
| AGBL4 | SNV | Missense_Mutation | novel | c.1403N>T | p.Ser468Phe | p.S468F | Q5VU57 | protein_coding | tolerated_low_confidence(0.1) | benign(0.058) | TCGA-AA-3984-01 | Colorectum | colon adenocarcinoma | Female | <65 | I/II | Unknown | Unknown | SD |
| Page: 1 2 3 4 5 6 |
Top |
Related drugs of malignant transformation related genes |
| Identification of chemicals and drugs interact with genes involved in malignant transfromation |
| (DGIdb 4.0) |
| Entrez ID | Symbol | Category | Interaction Types | Drug Claim Name | Drug Name | PMIDs |
| 84871 | AGBL4 | PROTEASE, DRUGGABLE GENOME | ustekinumab | USTEKINUMAB | 27977334 | |
| 84871 | AGBL4 | PROTEASE, DRUGGABLE GENOME | rifampin | RIFAMPIN |
| Page: 1 |

Copyright 2023-Present -The University of Texas Health Science Center at Houston |