
|
|||||
|
 | |
| |
| |
| |
| |
| |
|
Gene: AGAP1 |
Gene summary for AGAP1 |
| Gene information | Species | Human | Gene symbol | AGAP1 | Gene ID | 116987 |
| Gene name | ArfGAP with GTPase domain, ankyrin repeat and PH domain 1 | |
| Gene Alias | AGAP-1 | |
| Cytomap | 2q37.2 | |
| Gene Type | protein-coding | GO ID | GO:0006810 | UniProtAcc | B2RZG9 |
Top |
Malignant transformation analysis |
| Identification of the aberrant gene expression in precancerous and cancerous lesions by comparing the gene expression of stem-like cells in diseased tissues with normal stem cells |
| Entrez ID | Symbol | Replicates | Species | Organ | Tissue | Adj P-value | Log2FC | Malignancy |
| 116987 | AGAP1 | CCI_1 | Human | Cervix | CC | 9.08e-05 | 7.93e-01 | 0.528 |
| 116987 | AGAP1 | CCI_3 | Human | Cervix | CC | 1.94e-20 | 1.38e+00 | 0.516 |
| 116987 | AGAP1 | CCII_1 | Human | Cervix | CC | 6.51e-07 | 4.18e-01 | 0.3249 |
| 116987 | AGAP1 | HTA11_347_2000001011 | Human | Colorectum | AD | 5.32e-35 | 1.11e+00 | -0.1954 |
| 116987 | AGAP1 | HTA11_411_2000001011 | Human | Colorectum | SER | 2.59e-13 | 8.34e-01 | -0.2602 |
| 116987 | AGAP1 | HTA11_2112_2000001011 | Human | Colorectum | SER | 2.09e-06 | 4.70e-01 | -0.2196 |
| 116987 | AGAP1 | HTA11_83_2000001011 | Human | Colorectum | SER | 8.34e-07 | 5.26e-01 | -0.1526 |
| 116987 | AGAP1 | HTA11_696_2000001011 | Human | Colorectum | AD | 1.59e-09 | 5.64e-01 | -0.1464 |
| 116987 | AGAP1 | HTA11_866_2000001011 | Human | Colorectum | AD | 2.34e-10 | 6.08e-01 | -0.1001 |
| 116987 | AGAP1 | HTA11_1391_2000001011 | Human | Colorectum | AD | 5.57e-05 | 6.17e-01 | -0.059 |
| 116987 | AGAP1 | HTA11_2992_2000001011 | Human | Colorectum | SER | 9.02e-03 | 2.84e-01 | -0.1706 |
| 116987 | AGAP1 | HTA11_546_2000001011 | Human | Colorectum | AD | 5.43e-12 | 7.41e-01 | -0.0842 |
| 116987 | AGAP1 | HTA11_4255_2000001011 | Human | Colorectum | SER | 9.91e-05 | 4.57e-01 | 0.0446 |
| 116987 | AGAP1 | HTA11_9408_2000001011 | Human | Colorectum | AD | 4.56e-04 | -6.56e-01 | 0.0451 |
| 116987 | AGAP1 | HTA11_7663_2000001011 | Human | Colorectum | SER | 3.40e-15 | 6.37e-01 | 0.0131 |
| 116987 | AGAP1 | HTA11_10623_2000001011 | Human | Colorectum | AD | 1.79e-04 | 3.79e-01 | -0.0177 |
| 116987 | AGAP1 | HTA11_6818_2000001021 | Human | Colorectum | AD | 2.91e-05 | 3.99e-01 | 0.0588 |
| 116987 | AGAP1 | HTA11_99999970781_79442 | Human | Colorectum | MSS | 5.04e-03 | -3.45e-01 | 0.294 |
| 116987 | AGAP1 | HTA11_99999965062_69753 | Human | Colorectum | MSI-H | 7.65e-24 | 1.07e+00 | 0.3487 |
| 116987 | AGAP1 | HTA11_99999974143_84620 | Human | Colorectum | MSS | 1.99e-07 | -4.60e-01 | 0.3005 |
| Page: 1 2 3 4 5 6 7 8 9 |
| Tissue | Expression Dynamics | Abbreviation |
| Cervix |  | CC: Cervix cancer |
| HSIL_HPV: HPV-infected high-grade squamous intraepithelial lesions | ||
| N_HPV: HPV-infected normal cervix | ||
| Colorectum (GSE201348) |  | FAP: Familial adenomatous polyposis |
| CRC: Colorectal cancer | ||
| Colorectum (HTA11) |  | AD: Adenomas |
| SER: Sessile serrated lesions | ||
| MSI-H: Microsatellite-high colorectal cancer | ||
| MSS: Microsatellite stable colorectal cancer | ||
| Endometrium | 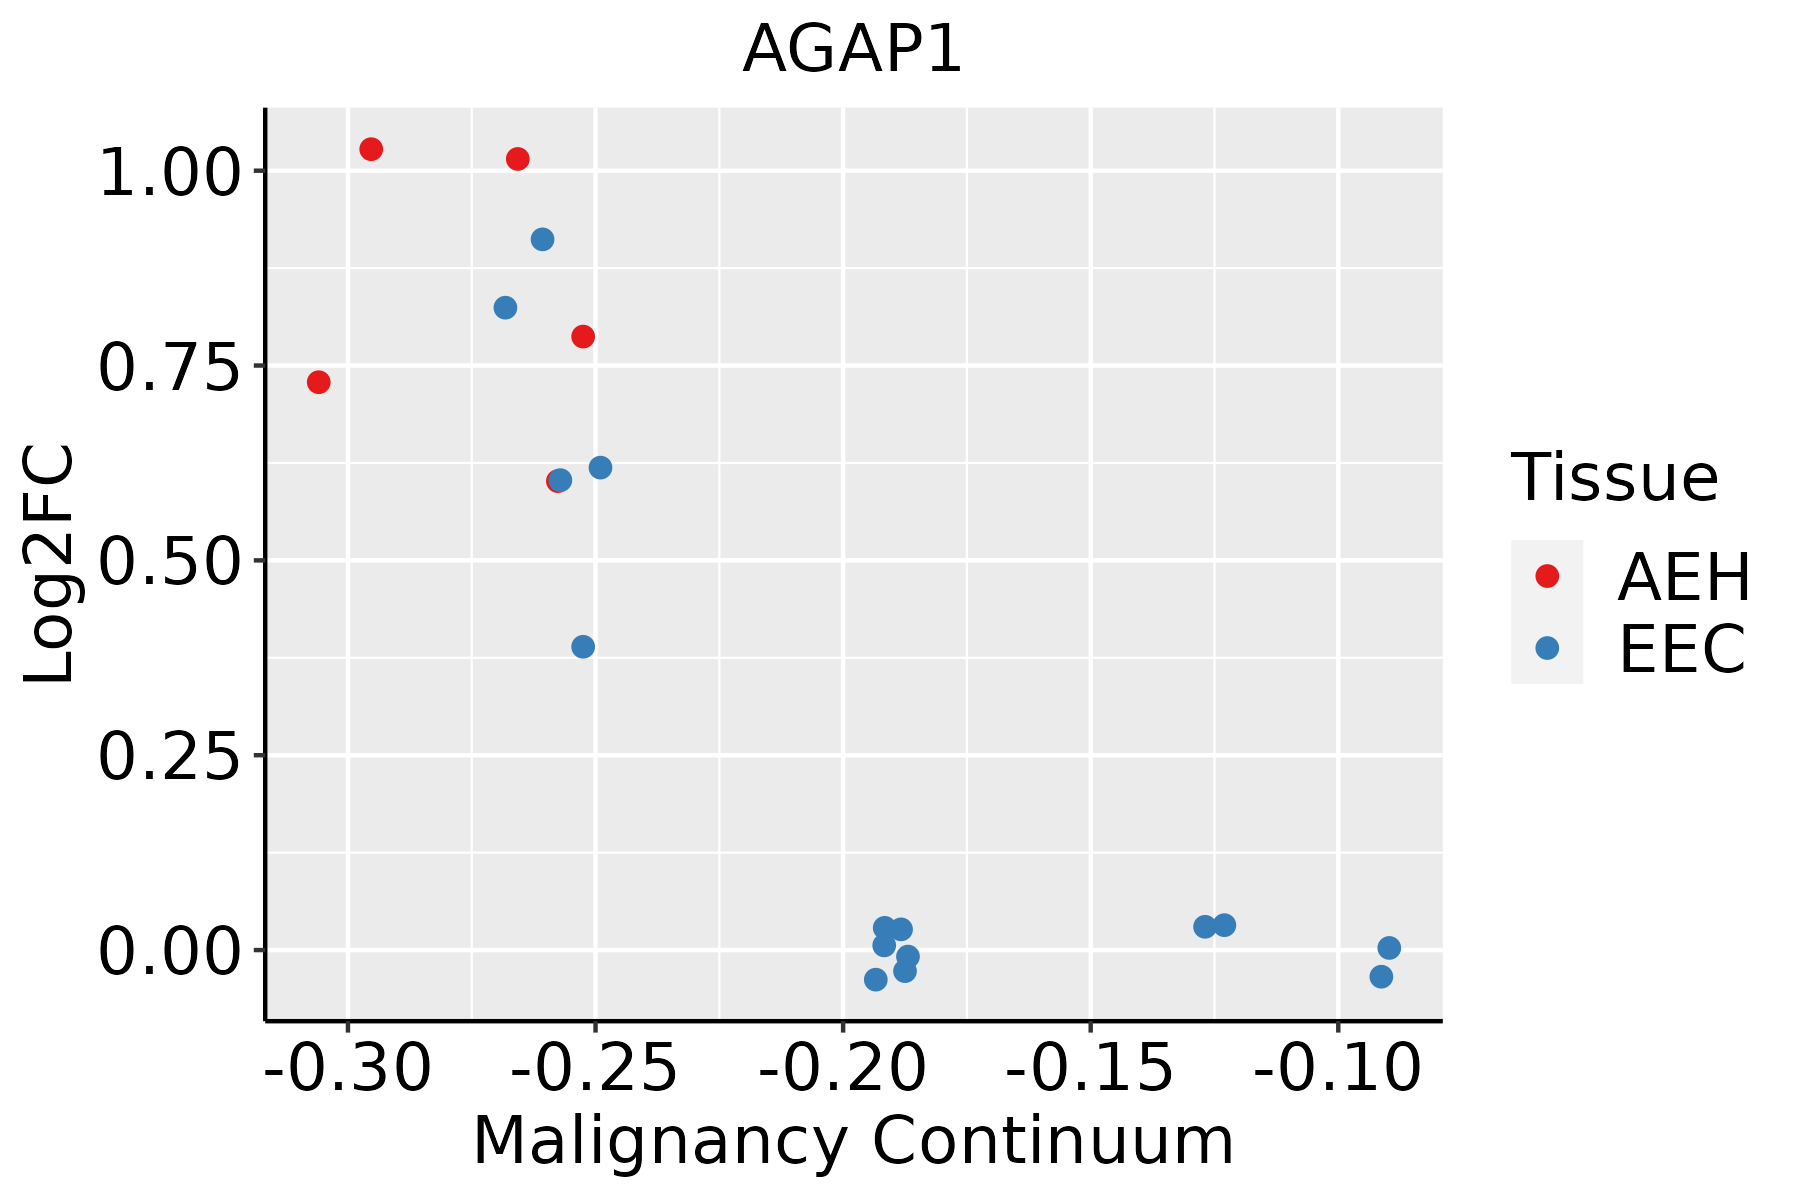 | AEH: Atypical endometrial hyperplasia |
| EEC: Endometrioid Cancer | ||
| GC | 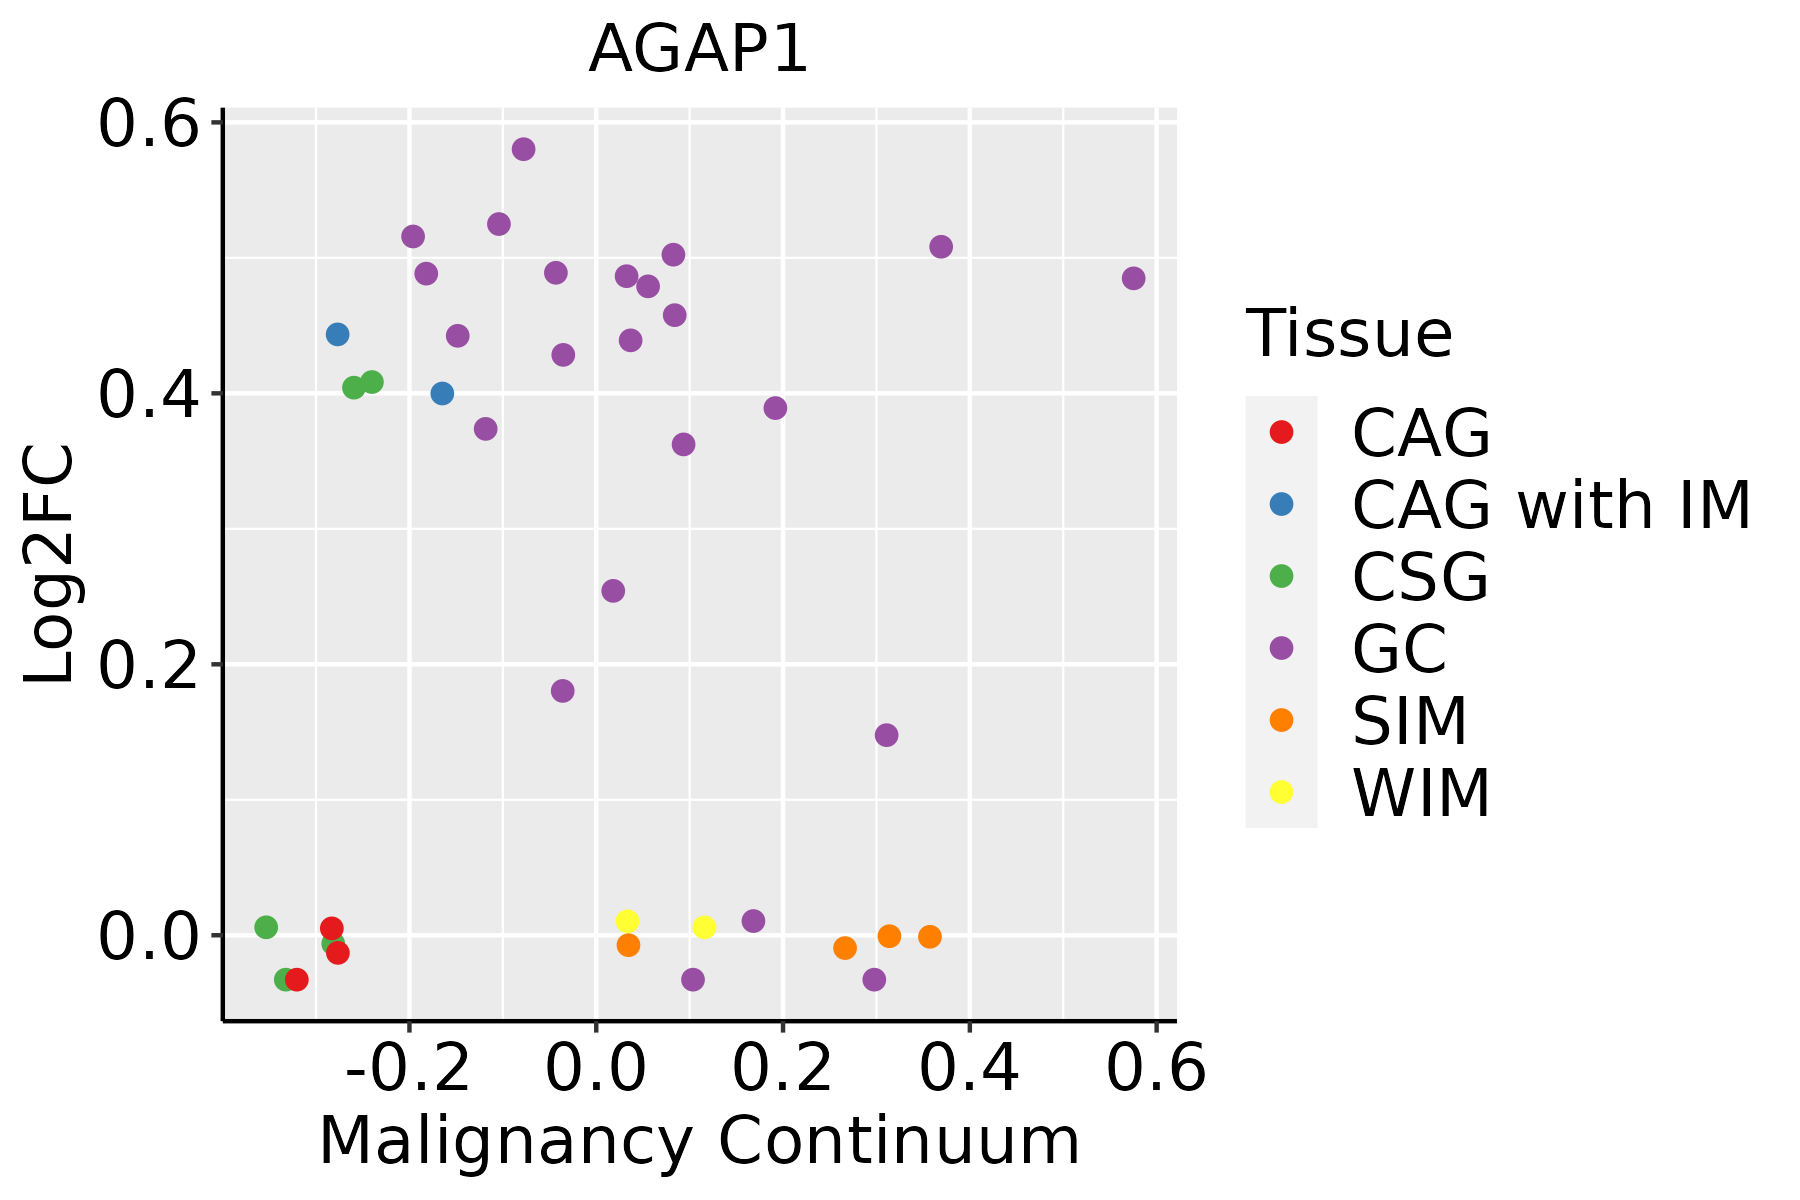 | CAG: Chronic atrophic gastritis |
| CAG with IM: Chronic atrophic gastritis with intestinal metaplasia | ||
| CSG: Chronic superficial gastritis | ||
| GC: Gastric cancer | ||
| SIM: Severe intestinal metaplasia | ||
| WIM: Wild intestinal metaplasia | ||
| Liver |  | HCC: Hepatocellular carcinoma |
| NAFLD: Non-alcoholic fatty liver disease | ||
| Lung |  | AAH: Atypical adenomatous hyperplasia |
| AIS: Adenocarcinoma in situ | ||
| IAC: Invasive lung adenocarcinoma | ||
| MIA: Minimally invasive adenocarcinoma | ||
| Oral Cavity | 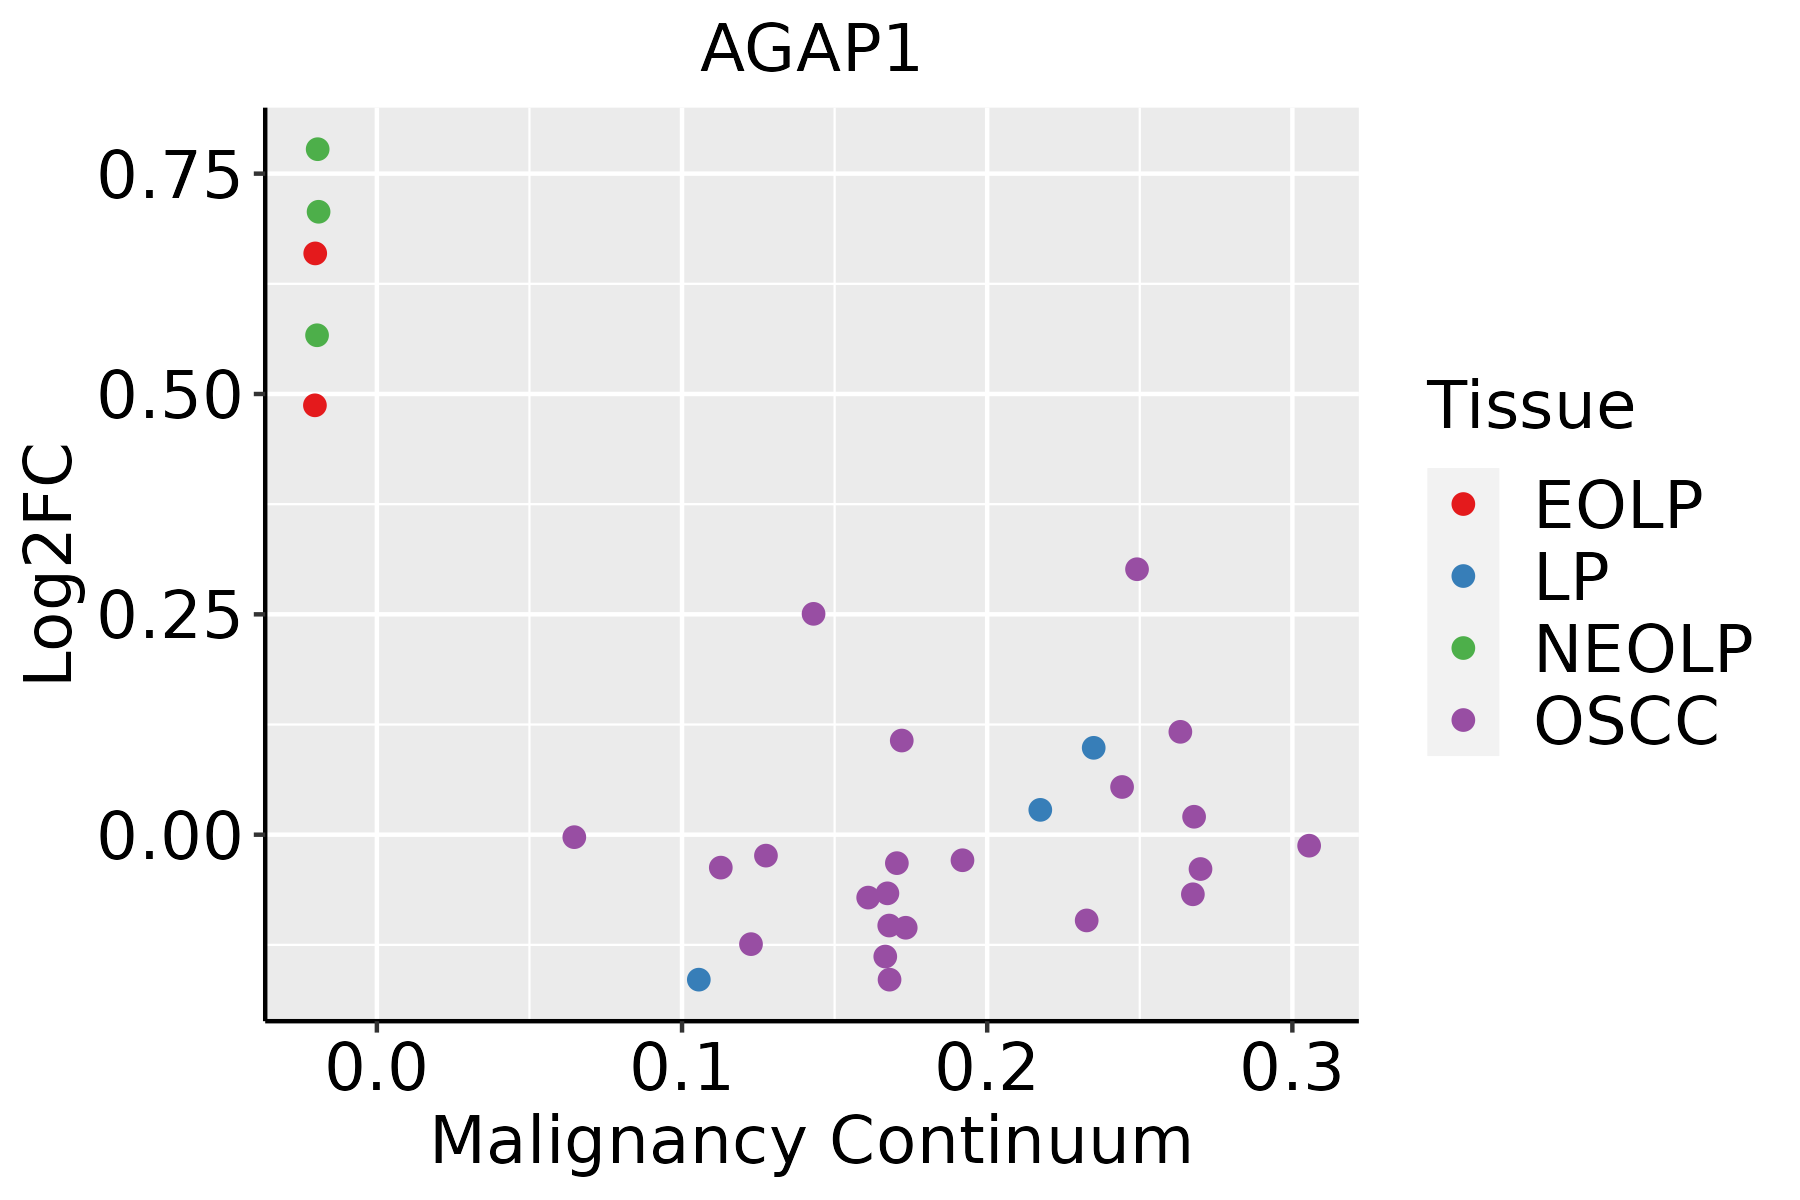 | EOLP: Erosive Oral lichen planus |
| LP: leukoplakia | ||
| NEOLP: Non-erosive oral lichen planus | ||
| OSCC: Oral squamous cell carcinoma | ||
| Prostate | 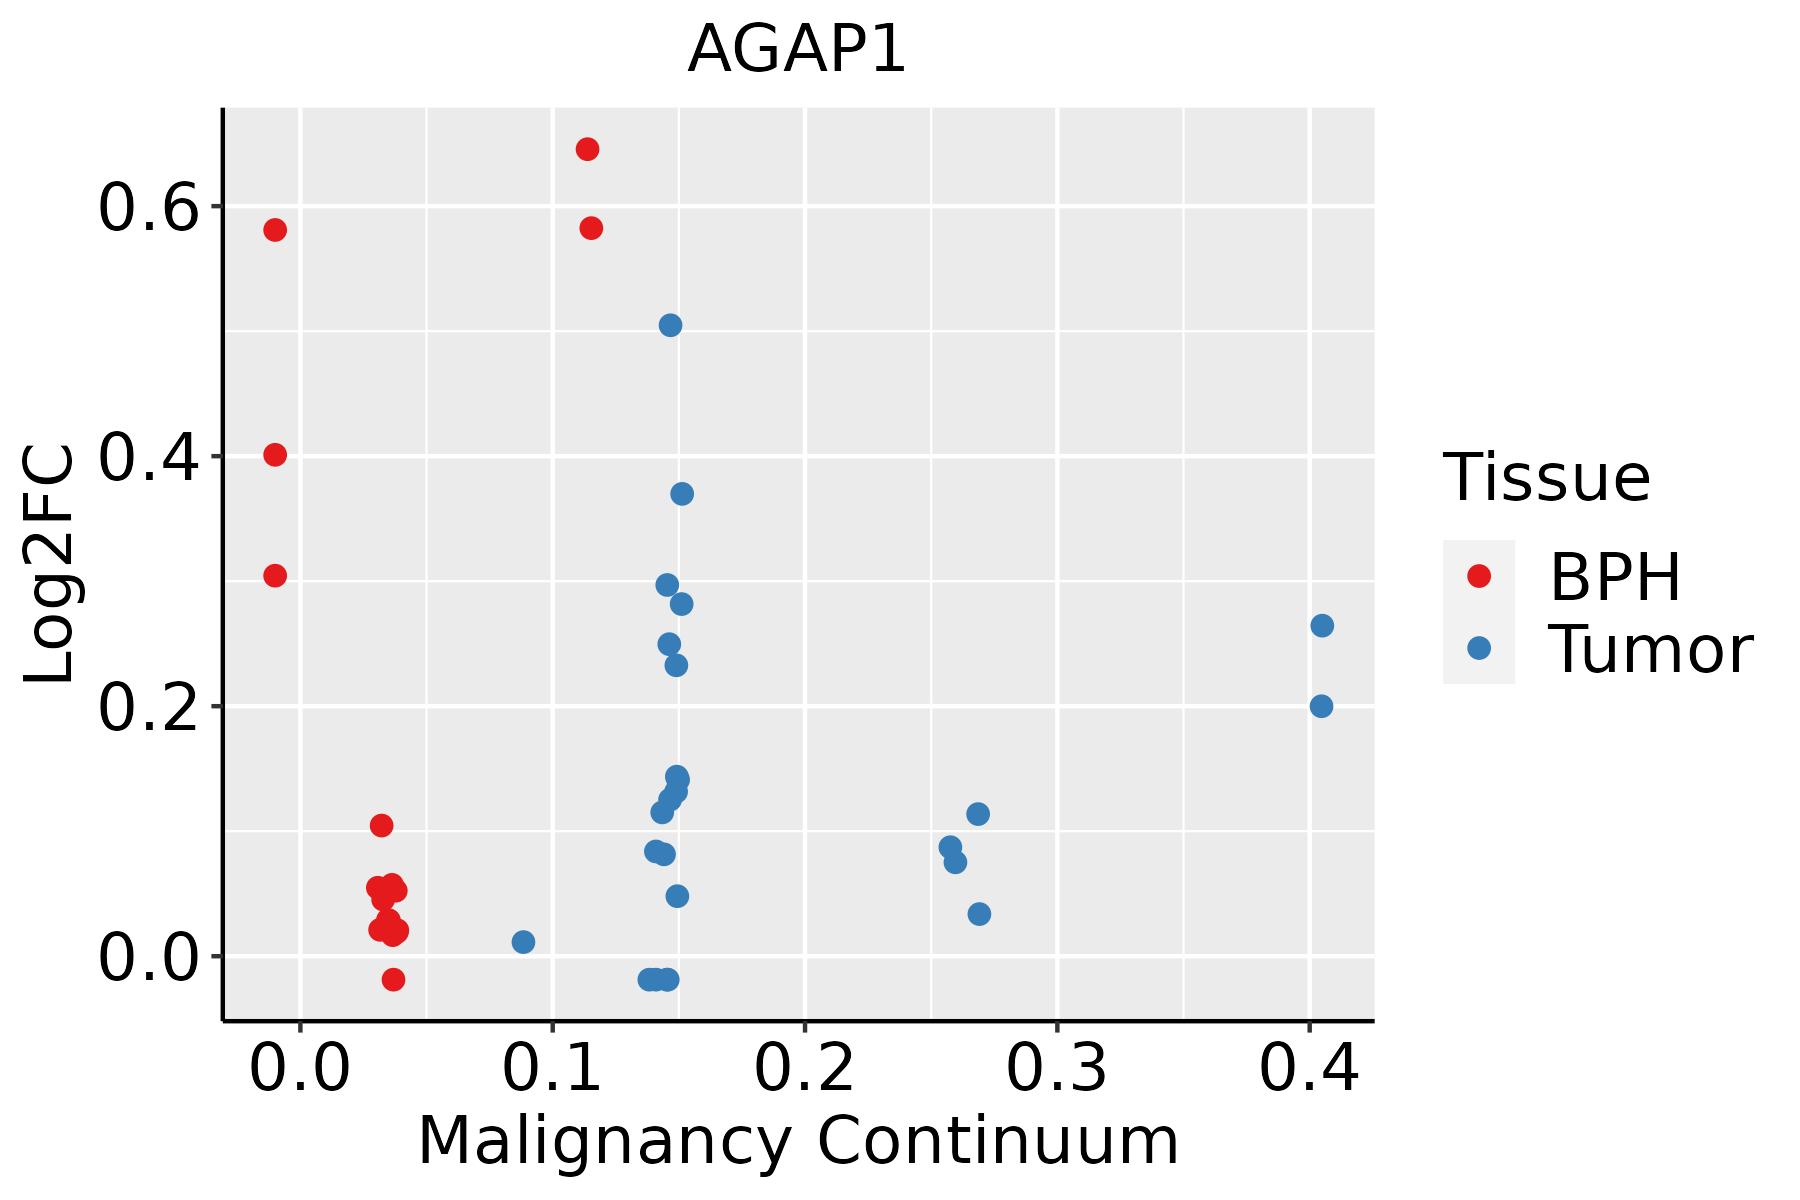 | BPH: Benign Prostatic Hyperplasia |
| Thyroid |  | ATC: Anaplastic thyroid cancer |
| HT: Hashimoto's thyroiditis | ||
| PTC: Papillary thyroid cancer |
| ∗log2FC in expression of this searched gene in stem-like cells from each diseased tissue sample relative to stem-like cells in normal samples in each tissue plotted against the malignancy continuum. Samples are colored based on if they are from different disease stage. |
Top |
Malignant transformation related pathway analysis |
| Find out the enriched GO biological processes and KEGG pathways involved in transition from healthy to precancer to cancer |
| Tissue | Disease Stage | Enriched GO biological Processes |
| Colorectum | AD |  |
| Colorectum | SER |  |
| Colorectum | MSS |  |
| Colorectum | MSI-H |  |
| Colorectum | FAP |  |
| ∗Top 15 enriched GO BP terms are showed in the bar plot of each disease state in each tissue. Each row represents a significant GO biological process which is colored according to the -log10(p.adjust). |
| Page: 1 2 3 4 5 6 7 8 9 |
| GO ID | Tissue | Disease Stage | Description | Gene Ratio | Bg Ratio | pvalue | p.adjust | Count |
| Page: 1 |
| Pathway ID | Tissue | Disease Stage | Description | Gene Ratio | Bg Ratio | pvalue | p.adjust | qvalue | Count |
| hsa0414418 | Cervix | CC | Endocytosis | 64/1267 | 251/8465 | 6.97e-06 | 6.10e-05 | 3.61e-05 | 64 |
| hsa0414419 | Cervix | CC | Endocytosis | 64/1267 | 251/8465 | 6.97e-06 | 6.10e-05 | 3.61e-05 | 64 |
| hsa04144 | Colorectum | AD | Endocytosis | 111/2092 | 251/8465 | 5.95e-12 | 1.42e-10 | 9.08e-11 | 111 |
| hsa041441 | Colorectum | AD | Endocytosis | 111/2092 | 251/8465 | 5.95e-12 | 1.42e-10 | 9.08e-11 | 111 |
| hsa041442 | Colorectum | SER | Endocytosis | 81/1580 | 251/8465 | 1.14e-07 | 2.36e-06 | 1.71e-06 | 81 |
| hsa041443 | Colorectum | SER | Endocytosis | 81/1580 | 251/8465 | 1.14e-07 | 2.36e-06 | 1.71e-06 | 81 |
| hsa041444 | Colorectum | MSS | Endocytosis | 102/1875 | 251/8465 | 1.85e-11 | 4.43e-10 | 2.71e-10 | 102 |
| hsa041445 | Colorectum | MSS | Endocytosis | 102/1875 | 251/8465 | 1.85e-11 | 4.43e-10 | 2.71e-10 | 102 |
| hsa041446 | Colorectum | FAP | Endocytosis | 78/1404 | 251/8465 | 6.20e-09 | 2.96e-07 | 1.80e-07 | 78 |
| hsa041447 | Colorectum | FAP | Endocytosis | 78/1404 | 251/8465 | 6.20e-09 | 2.96e-07 | 1.80e-07 | 78 |
| hsa0414420 | Endometrium | AEH | Endocytosis | 56/1197 | 251/8465 | 2.58e-04 | 2.15e-03 | 1.57e-03 | 56 |
| hsa04144110 | Endometrium | AEH | Endocytosis | 56/1197 | 251/8465 | 2.58e-04 | 2.15e-03 | 1.57e-03 | 56 |
| hsa0414424 | Endometrium | EEC | Endocytosis | 57/1237 | 251/8465 | 3.34e-04 | 2.82e-03 | 2.10e-03 | 57 |
| hsa0414434 | Endometrium | EEC | Endocytosis | 57/1237 | 251/8465 | 3.34e-04 | 2.82e-03 | 2.10e-03 | 57 |
| hsa0414422 | Liver | HCC | Endocytosis | 178/4020 | 251/8465 | 2.03e-14 | 5.22e-13 | 2.91e-13 | 178 |
| hsa0414432 | Liver | HCC | Endocytosis | 178/4020 | 251/8465 | 2.03e-14 | 5.22e-13 | 2.91e-13 | 178 |
| hsa0414423 | Lung | AIS | Endocytosis | 52/961 | 251/8465 | 9.74e-06 | 3.04e-04 | 1.95e-04 | 52 |
| hsa0414433 | Lung | AIS | Endocytosis | 52/961 | 251/8465 | 9.74e-06 | 3.04e-04 | 1.95e-04 | 52 |
| hsa0414427 | Oral cavity | OSCC | Endocytosis | 174/3704 | 251/8465 | 9.42e-17 | 4.51e-15 | 2.29e-15 | 174 |
| hsa04144112 | Oral cavity | OSCC | Endocytosis | 174/3704 | 251/8465 | 9.42e-17 | 4.51e-15 | 2.29e-15 | 174 |
| Page: 1 2 |
Top |
Cell-cell communication analysis |
| Identification of potential cell-cell interactions between two cell types and their ligand-receptor pairs for different disease states |
| Ligand | Receptor | LRpair | Pathway | Tissue | Disease Stage |
| Page: 1 |
Top |
Single-cell gene regulatory network inference analysis |
| Find out the significant the regulons (TFs) and the target genes of each regulon across cell types for different disease states |
| TF | Cell Type | Tissue | Disease Stage | Target Gene | RSS | Regulon Activity |
| ∗The dot plots of a searched regulon are shown for all cell subpopulations in each disease state of each tissue based on the regulon specific score inferred using pySCENIC and by calculating the average expression. |
| Page: 1 |
Top |
Somatic mutation of malignant transformation related genes |
| Annotation of somatic variants for genes involved in malignant transformation |
| Hugo Symbol | Variant Class | Variant Classification | dbSNP RS | HGVSc | HGVSp | HGVSp Short | SWISSPROT | BIOTYPE | SIFT | PolyPhen | Tumor Sample Barcode | Tissue | Histology | Sex | Age | Stage | Therapy Types | Drugs | Outcome |
| AGAP1 | SNV | Missense_Mutation | c.386N>G | p.Pro129Arg | p.P129R | Q9UPQ3 | protein_coding | deleterious(0) | probably_damaging(1) | TCGA-A8-A08C-01 | Breast | breast invasive carcinoma | Female | >=65 | I/II | Chemotherapy | 5-fluorouracil | CR | |
| AGAP1 | SNV | Missense_Mutation | rs143617959 | c.2128N>T | p.Arg710Trp | p.R710W | Q9UPQ3 | protein_coding | deleterious(0.04) | benign(0.011) | TCGA-AN-A046-01 | Breast | breast invasive carcinoma | Female | >=65 | I/II | Unknown | Unknown | SD |
| AGAP1 | SNV | Missense_Mutation | c.1581N>T | p.Lys527Asn | p.K527N | Q9UPQ3 | protein_coding | deleterious(0) | possibly_damaging(0.901) | TCGA-BH-A0WA-01 | Breast | breast invasive carcinoma | Female | >=65 | I/II | Unknown | Unknown | SD | |
| AGAP1 | SNV | Missense_Mutation | rs781108655 | c.1027N>A | p.Gly343Ser | p.G343S | Q9UPQ3 | protein_coding | deleterious(0.04) | benign(0.143) | TCGA-C8-A12Z-01 | Breast | breast invasive carcinoma | Female | <65 | I/II | Chemotherapy | 5-fluorouracil | CR |
| AGAP1 | SNV | Missense_Mutation | c.1421N>T | p.Ser474Leu | p.S474L | Q9UPQ3 | protein_coding | tolerated(0.2) | probably_damaging(0.991) | TCGA-C8-A26Y-01 | Breast | breast invasive carcinoma | Female | >=65 | I/II | Unknown | Unknown | SD | |
| AGAP1 | SNV | Missense_Mutation | rs779782500 | c.415N>A | p.Ala139Thr | p.A139T | Q9UPQ3 | protein_coding | deleterious(0) | probably_damaging(0.994) | TCGA-D8-A1XK-01 | Breast | breast invasive carcinoma | Female | <65 | I/II | Chemotherapy | doxorubicine+cyclophosphamide | SD |
| AGAP1 | SNV | Missense_Mutation | novel | c.1911G>C | p.Leu637Phe | p.L637F | Q9UPQ3 | protein_coding | deleterious(0) | probably_damaging(0.998) | TCGA-D8-A27V-01 | Breast | breast invasive carcinoma | Female | <65 | I/II | Hormone Therapy | tamoxiphen | SD |
| AGAP1 | SNV | Missense_Mutation | novel | c.1090N>C | p.Glu364Gln | p.E364Q | Q9UPQ3 | protein_coding | deleterious(0) | probably_damaging(0.91) | TCGA-OL-A5S0-01 | Breast | breast invasive carcinoma | Female | >=65 | I/II | Chemotherapy | taxol | CR |
| AGAP1 | SNV | Missense_Mutation | c.1241C>T | p.Thr414Met | p.T414M | Q9UPQ3 | protein_coding | deleterious(0.05) | probably_damaging(0.999) | TCGA-2W-A8YY-01 | Cervix | cervical & endocervical cancer | Female | <65 | I/II | Chemotherapy | cisplatin | CR | |
| AGAP1 | SNV | Missense_Mutation | novel | c.1214N>A | p.Val405Asp | p.V405D | Q9UPQ3 | protein_coding | deleterious(0) | probably_damaging(0.998) | TCGA-4J-AA1J-01 | Cervix | cervical & endocervical cancer | Female | <65 | I/II | Unknown | Unknown | SD |
| Page: 1 2 3 4 5 6 7 8 9 10 11 12 |
Top |
Related drugs of malignant transformation related genes |
| Identification of chemicals and drugs interact with genes involved in malignant transfromation |
| (DGIdb 4.0) |
| Entrez ID | Symbol | Category | Interaction Types | Drug Claim Name | Drug Name | PMIDs |
| Page: 1 |

Copyright 2023-Present -The University of Texas Health Science Center at Houston |