
|
|||||
|
 | |
| |
| |
| |
| |
| |
|
Gene: AGA |
Gene summary for AGA |
| Gene information | Species | Human | Gene symbol | AGA | Gene ID | 175 |
| Gene name | aspartylglucosaminidase | |
| Gene Alias | AGU | |
| Cytomap | 4q34.3 | |
| Gene Type | protein-coding | GO ID | GO:0006464 | UniProtAcc | P20933 |
Top |
Malignant transformation analysis |
| Identification of the aberrant gene expression in precancerous and cancerous lesions by comparing the gene expression of stem-like cells in diseased tissues with normal stem cells |
| Entrez ID | Symbol | Replicates | Species | Organ | Tissue | Adj P-value | Log2FC | Malignancy |
| 175 | AGA | LZE4T | Human | Esophagus | ESCC | 2.69e-08 | 2.18e-01 | 0.0811 |
| 175 | AGA | LZE5T | Human | Esophagus | ESCC | 3.81e-03 | 2.28e-01 | 0.0514 |
| 175 | AGA | LZE8T | Human | Esophagus | ESCC | 1.52e-06 | 2.33e-01 | 0.067 |
| 175 | AGA | LZE20T | Human | Esophagus | ESCC | 3.16e-02 | 2.08e-01 | 0.0662 |
| 175 | AGA | LZE22T | Human | Esophagus | ESCC | 2.53e-03 | 2.83e-01 | 0.068 |
| 175 | AGA | LZE24T | Human | Esophagus | ESCC | 6.79e-07 | 2.71e-01 | 0.0596 |
| 175 | AGA | P1T-E | Human | Esophagus | ESCC | 7.41e-04 | 3.62e-01 | 0.0875 |
| 175 | AGA | P2T-E | Human | Esophagus | ESCC | 8.41e-46 | 7.70e-01 | 0.1177 |
| 175 | AGA | P4T-E | Human | Esophagus | ESCC | 9.13e-05 | 2.27e-01 | 0.1323 |
| 175 | AGA | P5T-E | Human | Esophagus | ESCC | 1.02e-06 | 1.63e-01 | 0.1327 |
| 175 | AGA | P8T-E | Human | Esophagus | ESCC | 6.35e-16 | 2.63e-01 | 0.0889 |
| 175 | AGA | P9T-E | Human | Esophagus | ESCC | 1.59e-05 | 1.94e-01 | 0.1131 |
| 175 | AGA | P10T-E | Human | Esophagus | ESCC | 4.95e-04 | 5.76e-02 | 0.116 |
| 175 | AGA | P11T-E | Human | Esophagus | ESCC | 9.92e-09 | 5.44e-01 | 0.1426 |
| 175 | AGA | P12T-E | Human | Esophagus | ESCC | 2.44e-47 | 8.46e-01 | 0.1122 |
| 175 | AGA | P15T-E | Human | Esophagus | ESCC | 3.73e-07 | 1.67e-01 | 0.1149 |
| 175 | AGA | P16T-E | Human | Esophagus | ESCC | 4.90e-22 | 5.10e-01 | 0.1153 |
| 175 | AGA | P17T-E | Human | Esophagus | ESCC | 2.64e-05 | 2.77e-01 | 0.1278 |
| 175 | AGA | P20T-E | Human | Esophagus | ESCC | 2.88e-11 | 2.94e-01 | 0.1124 |
| 175 | AGA | P21T-E | Human | Esophagus | ESCC | 1.23e-28 | 5.46e-01 | 0.1617 |
| Page: 1 2 3 4 5 |
| Tissue | Expression Dynamics | Abbreviation |
| Esophagus |  | ESCC: Esophageal squamous cell carcinoma |
| HGIN: High-grade intraepithelial neoplasias | ||
| LGIN: Low-grade intraepithelial neoplasias | ||
| Liver |  | HCC: Hepatocellular carcinoma |
| NAFLD: Non-alcoholic fatty liver disease | ||
| Oral Cavity |  | EOLP: Erosive Oral lichen planus |
| LP: leukoplakia | ||
| NEOLP: Non-erosive oral lichen planus | ||
| OSCC: Oral squamous cell carcinoma | ||
| Thyroid | 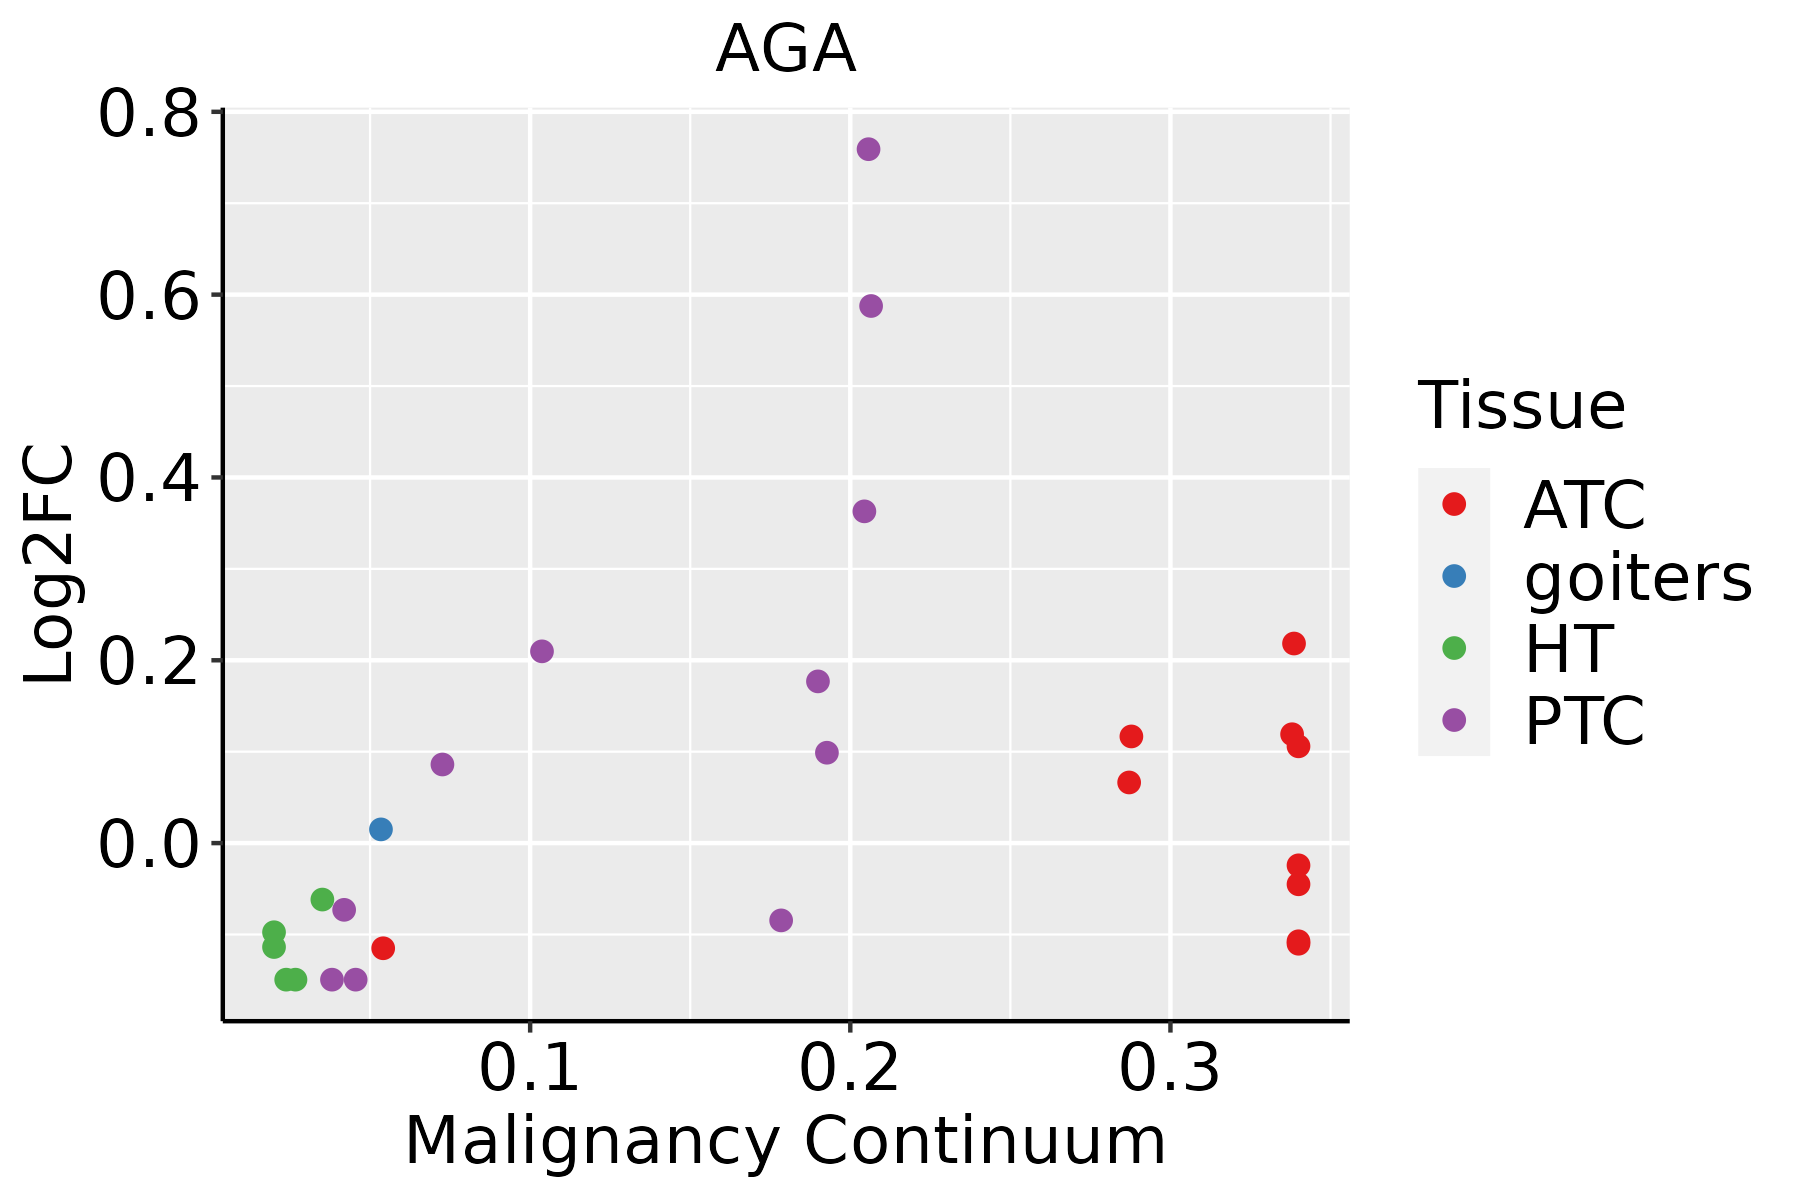 | ATC: Anaplastic thyroid cancer |
| HT: Hashimoto's thyroiditis | ||
| PTC: Papillary thyroid cancer |
| ∗log2FC in expression of this searched gene in stem-like cells from each diseased tissue sample relative to stem-like cells in normal samples in each tissue plotted against the malignancy continuum. Samples are colored based on if they are from different disease stage. |
Top |
Malignant transformation related pathway analysis |
| Find out the enriched GO biological processes and KEGG pathways involved in transition from healthy to precancer to cancer |
| Tissue | Disease Stage | Enriched GO biological Processes |
| Colorectum | AD |  |
| Colorectum | SER |  |
| Colorectum | MSS |  |
| Colorectum | MSI-H |  |
| Colorectum | FAP |  |
| ∗Top 15 enriched GO BP terms are showed in the bar plot of each disease state in each tissue. Each row represents a significant GO biological process which is colored according to the -log10(p.adjust). |
| Page: 1 2 3 4 5 6 7 8 9 |
| GO ID | Tissue | Disease Stage | Description | Gene Ratio | Bg Ratio | pvalue | p.adjust | Count |
| GO:0016032 | Colorectum | AD | viral process | 168/3918 | 415/18723 | 4.67e-20 | 3.66e-17 | 168 |
| GO:0010498 | Colorectum | AD | proteasomal protein catabolic process | 174/3918 | 490/18723 | 3.18e-14 | 7.66e-12 | 174 |
| GO:0009895 | Colorectum | AD | negative regulation of catabolic process | 124/3918 | 320/18723 | 1.66e-13 | 3.35e-11 | 124 |
| GO:0031330 | Colorectum | AD | negative regulation of cellular catabolic process | 104/3918 | 262/18723 | 2.66e-12 | 3.96e-10 | 104 |
| GO:0043161 | Colorectum | AD | proteasome-mediated ubiquitin-dependent protein catabolic process | 141/3918 | 412/18723 | 1.77e-10 | 1.68e-08 | 141 |
| GO:0010506 | Colorectum | AD | regulation of autophagy | 111/3918 | 317/18723 | 3.57e-09 | 2.35e-07 | 111 |
| GO:0006979 | Colorectum | AD | response to oxidative stress | 145/3918 | 446/18723 | 5.16e-09 | 3.23e-07 | 145 |
| GO:0044403 | Colorectum | AD | biological process involved in symbiotic interaction | 99/3918 | 290/18723 | 1.02e-07 | 4.93e-06 | 99 |
| GO:0051701 | Colorectum | AD | biological process involved in interaction with host | 73/3918 | 203/18723 | 5.08e-07 | 1.88e-05 | 73 |
| GO:0062197 | Colorectum | AD | cellular response to chemical stress | 109/3918 | 337/18723 | 5.33e-07 | 1.95e-05 | 109 |
| GO:0000302 | Colorectum | AD | response to reactive oxygen species | 78/3918 | 222/18723 | 6.17e-07 | 2.21e-05 | 78 |
| GO:0034599 | Colorectum | AD | cellular response to oxidative stress | 94/3918 | 288/18723 | 2.03e-06 | 6.02e-05 | 94 |
| GO:0031667 | Colorectum | AD | response to nutrient levels | 138/3918 | 474/18723 | 1.22e-05 | 2.68e-04 | 138 |
| GO:0042594 | Colorectum | AD | response to starvation | 63/3918 | 197/18723 | 1.77e-04 | 2.38e-03 | 63 |
| GO:0071496 | Colorectum | AD | cellular response to external stimulus | 94/3918 | 320/18723 | 1.98e-04 | 2.64e-03 | 94 |
| GO:0009267 | Colorectum | AD | cellular response to starvation | 51/3918 | 156/18723 | 3.90e-04 | 4.44e-03 | 51 |
| GO:0034614 | Colorectum | AD | cellular response to reactive oxygen species | 50/3918 | 155/18723 | 6.25e-04 | 6.49e-03 | 50 |
| GO:0010507 | Colorectum | AD | negative regulation of autophagy | 31/3918 | 85/18723 | 6.91e-04 | 7.05e-03 | 31 |
| GO:0031668 | Colorectum | AD | cellular response to extracellular stimulus | 71/3918 | 246/18723 | 1.86e-03 | 1.52e-02 | 71 |
| GO:0031669 | Colorectum | AD | cellular response to nutrient levels | 63/3918 | 215/18723 | 2.19e-03 | 1.73e-02 | 63 |
| Page: 1 2 3 4 5 6 7 8 9 10 11 12 13 14 15 16 17 |
| Pathway ID | Tissue | Disease Stage | Description | Gene Ratio | Bg Ratio | pvalue | p.adjust | qvalue | Count |
| hsa0414222 | Esophagus | ESCC | Lysosome | 102/4205 | 132/8465 | 5.11e-11 | 7.13e-10 | 3.65e-10 | 102 |
| hsa0414232 | Esophagus | ESCC | Lysosome | 102/4205 | 132/8465 | 5.11e-11 | 7.13e-10 | 3.65e-10 | 102 |
| hsa041424 | Liver | Cirrhotic | Lysosome | 68/2530 | 132/8465 | 1.34e-07 | 1.97e-06 | 1.21e-06 | 68 |
| hsa0414211 | Liver | Cirrhotic | Lysosome | 68/2530 | 132/8465 | 1.34e-07 | 1.97e-06 | 1.21e-06 | 68 |
| hsa041422 | Liver | HCC | Lysosome | 100/4020 | 132/8465 | 2.32e-11 | 4.31e-10 | 2.40e-10 | 100 |
| hsa041423 | Liver | HCC | Lysosome | 100/4020 | 132/8465 | 2.32e-11 | 4.31e-10 | 2.40e-10 | 100 |
| hsa041425 | Oral cavity | OSCC | Lysosome | 87/3704 | 132/8465 | 1.97e-07 | 1.35e-06 | 6.86e-07 | 87 |
| hsa0414212 | Oral cavity | OSCC | Lysosome | 87/3704 | 132/8465 | 1.97e-07 | 1.35e-06 | 6.86e-07 | 87 |
| Page: 1 |
Top |
Cell-cell communication analysis |
| Identification of potential cell-cell interactions between two cell types and their ligand-receptor pairs for different disease states |
| Ligand | Receptor | LRpair | Pathway | Tissue | Disease Stage |
| Page: 1 |
Top |
Single-cell gene regulatory network inference analysis |
| Find out the significant the regulons (TFs) and the target genes of each regulon across cell types for different disease states |
| TF | Cell Type | Tissue | Disease Stage | Target Gene | RSS | Regulon Activity |
| ∗The dot plots of a searched regulon are shown for all cell subpopulations in each disease state of each tissue based on the regulon specific score inferred using pySCENIC and by calculating the average expression. |
| Page: 1 |
Top |
Somatic mutation of malignant transformation related genes |
| Annotation of somatic variants for genes involved in malignant transformation |
| Hugo Symbol | Variant Class | Variant Classification | dbSNP RS | HGVSc | HGVSp | HGVSp Short | SWISSPROT | BIOTYPE | SIFT | PolyPhen | Tumor Sample Barcode | Tissue | Histology | Sex | Age | Stage | Therapy Types | Drugs | Outcome |
| AGA | SNV | Missense_Mutation | rs763615962 | c.1000N>A | p.Glu334Lys | p.E334K | P20933 | protein_coding | tolerated(0.92) | benign(0.011) | TCGA-JX-A3Q0-01 | Cervix | cervical & endocervical cancer | Female | <65 | III/IV | Unknown | Unknown | SD |
| AGA | SNV | Missense_Mutation | c.710N>G | p.Asp237Gly | p.D237G | P20933 | protein_coding | deleterious(0) | probably_damaging(1) | TCGA-A6-6780-01 | Colorectum | colon adenocarcinoma | Male | >=65 | I/II | Unknown | Unknown | SD | |
| AGA | SNV | Missense_Mutation | rs572348048 | c.700N>T | p.Arg234Cys | p.R234C | P20933 | protein_coding | deleterious(0) | probably_damaging(1) | TCGA-AA-A01R-01 | Colorectum | colon adenocarcinoma | Male | <65 | III/IV | Chemotherapy | 5-fluorouracil | PD |
| AGA | SNV | Missense_Mutation | novel | c.496N>T | p.Asn166Tyr | p.N166Y | P20933 | protein_coding | deleterious(0) | probably_damaging(1) | TCGA-AA-A02W-01 | Colorectum | colon adenocarcinoma | Female | >=65 | I/II | Unknown | Unknown | PD |
| AGA | SNV | Missense_Mutation | c.516N>G | p.Ile172Met | p.I172M | P20933 | protein_coding | tolerated(0.18) | benign(0.027) | TCGA-CK-4951-01 | Colorectum | colon adenocarcinoma | Female | >=65 | I/II | Unknown | Unknown | PD | |
| AGA | SNV | Missense_Mutation | c.416N>C | p.Met139Thr | p.M139T | P20933 | protein_coding | deleterious(0.02) | probably_damaging(0.948) | TCGA-D5-6927-01 | Colorectum | colon adenocarcinoma | Male | <65 | I/II | Unknown | Unknown | SD | |
| AGA | SNV | Missense_Mutation | novel | c.454N>A | p.Gln152Lys | p.Q152K | P20933 | protein_coding | tolerated(0.62) | benign(0) | TCGA-AG-A002-01 | Colorectum | rectum adenocarcinoma | Male | <65 | I/II | Unknown | Unknown | SD |
| AGA | SNV | Missense_Mutation | rs572348048 | c.700C>T | p.Arg234Cys | p.R234C | P20933 | protein_coding | deleterious(0) | probably_damaging(1) | TCGA-A5-A0G2-01 | Endometrium | uterine corpus endometrioid carcinoma | Female | <65 | III/IV | Unknown | Unknown | SD |
| AGA | SNV | Missense_Mutation | c.578N>A | p.Pro193His | p.P193H | P20933 | protein_coding | tolerated(0.21) | benign(0.009) | TCGA-A5-A0GH-01 | Endometrium | uterine corpus endometrioid carcinoma | Female | <65 | I/II | Unknown | Unknown | SD | |
| AGA | SNV | Missense_Mutation | novel | c.128N>T | p.Ala43Val | p.A43V | P20933 | protein_coding | deleterious(0) | probably_damaging(0.947) | TCGA-AJ-A3EL-01 | Endometrium | uterine corpus endometrioid carcinoma | Female | <65 | I/II | Unknown | Unknown | SD |
| Page: 1 2 3 4 |
Top |
Related drugs of malignant transformation related genes |
| Identification of chemicals and drugs interact with genes involved in malignant transfromation |
| (DGIdb 4.0) |
| Entrez ID | Symbol | Category | Interaction Types | Drug Claim Name | Drug Name | PMIDs |
| Page: 1 |

Copyright 2023-Present -The University of Texas Health Science Center at Houston |