| Tissue | Expression Dynamics | Abbreviation |
| Colorectum (GSE201348) |  | FAP: Familial adenomatous polyposis |
| CRC: Colorectal cancer |
| Colorectum (HTA11) | 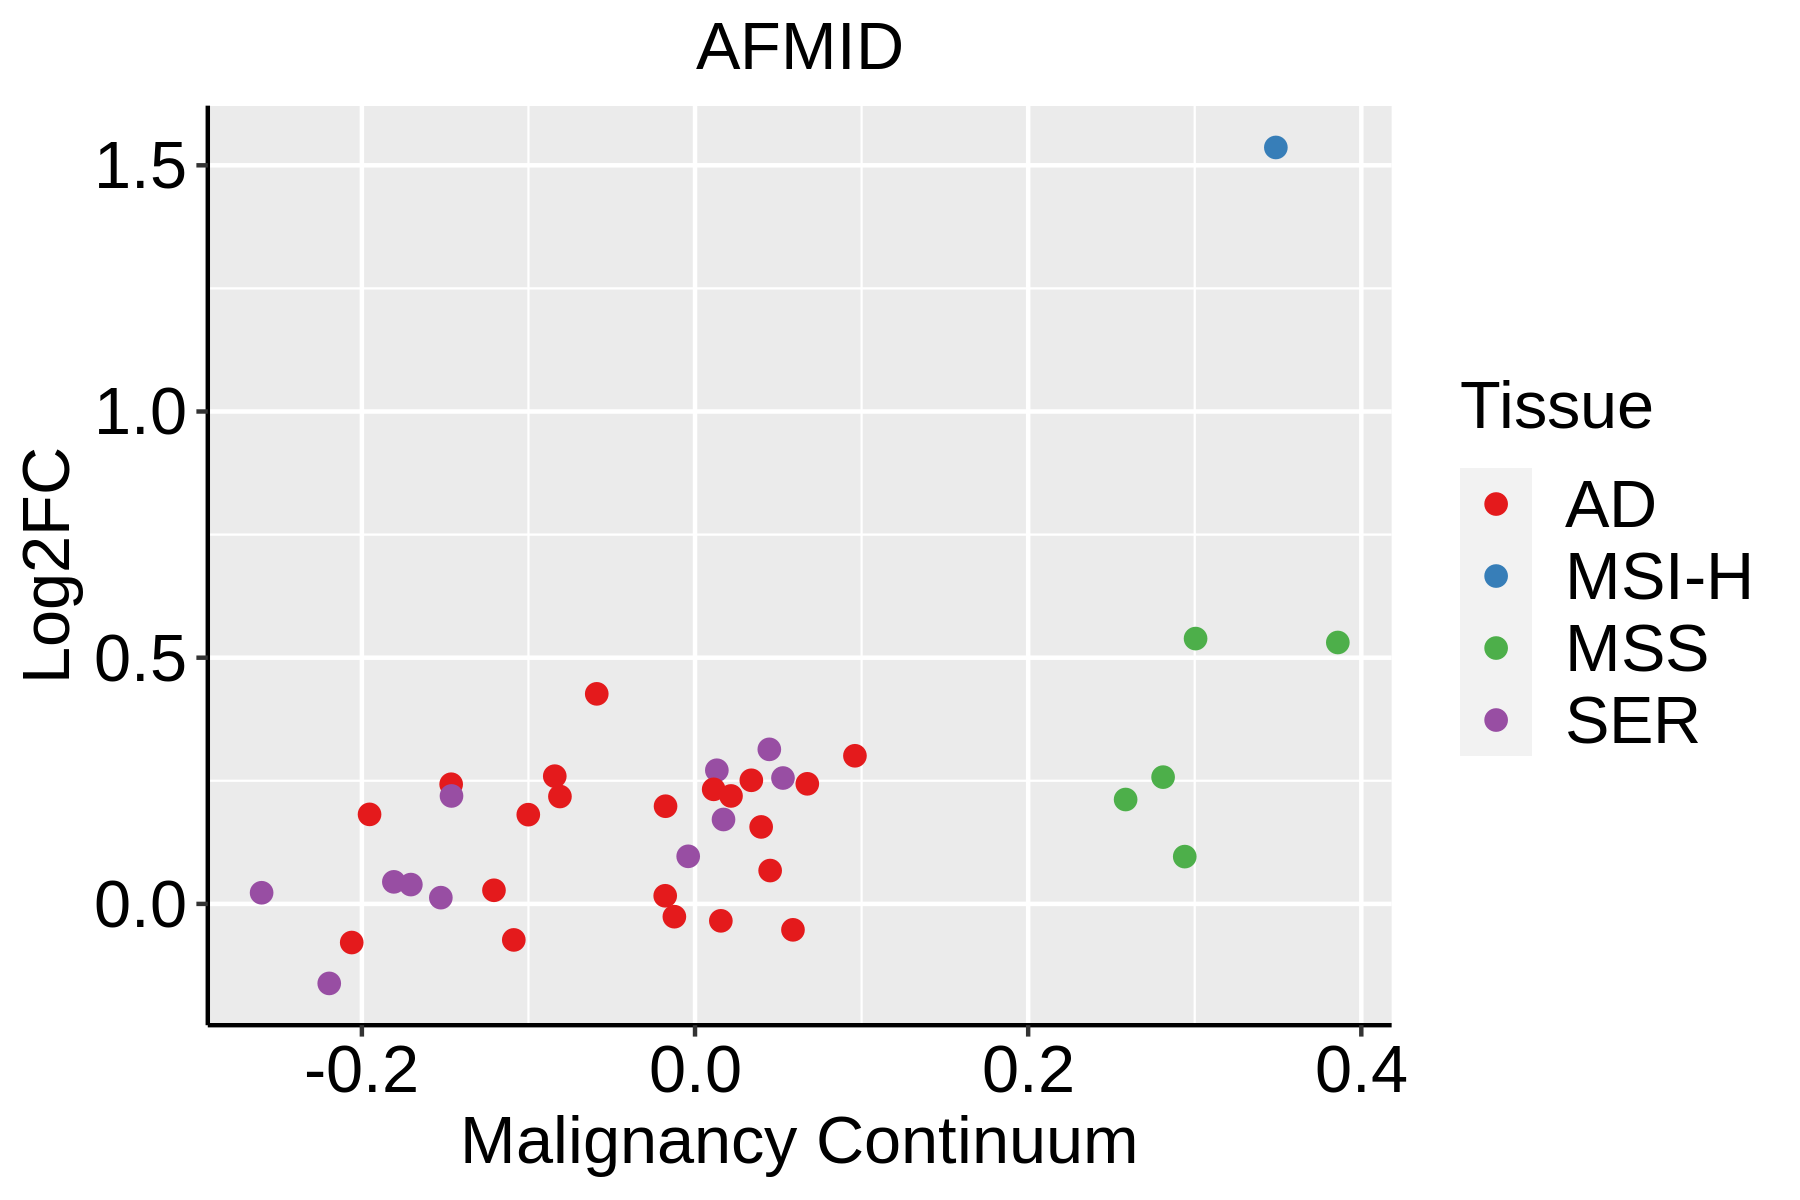 | AD: Adenomas |
| SER: Sessile serrated lesions |
| MSI-H: Microsatellite-high colorectal cancer |
| MSS: Microsatellite stable colorectal cancer |
| Endometrium |  | AEH: Atypical endometrial hyperplasia |
| EEC: Endometrioid Cancer |
| Esophagus | 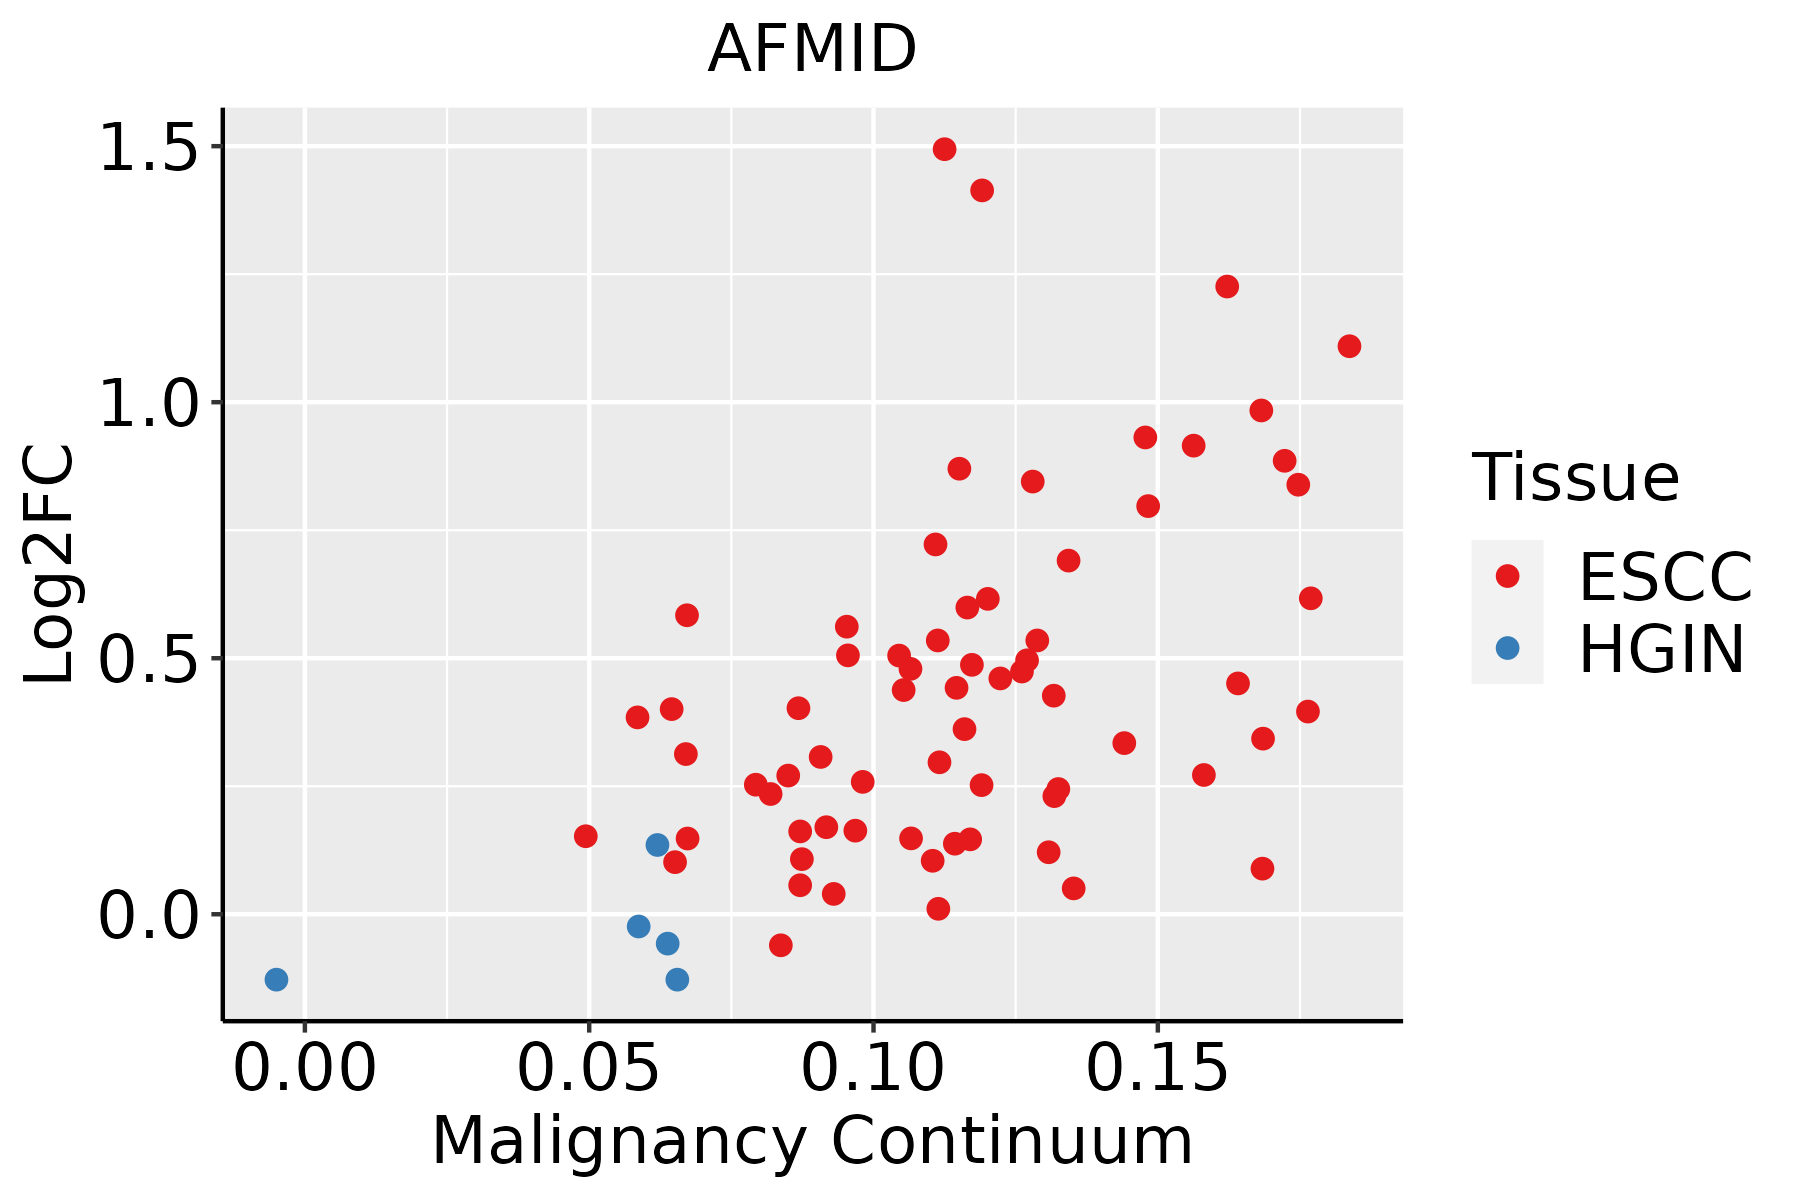 | ESCC: Esophageal squamous cell carcinoma |
| HGIN: High-grade intraepithelial neoplasias |
| LGIN: Low-grade intraepithelial neoplasias |
| GC |  | CAG: Chronic atrophic gastritis |
| CAG with IM: Chronic atrophic gastritis with intestinal metaplasia |
| CSG: Chronic superficial gastritis |
| GC: Gastric cancer |
| SIM: Severe intestinal metaplasia |
| WIM: Wild intestinal metaplasia |
| Liver | 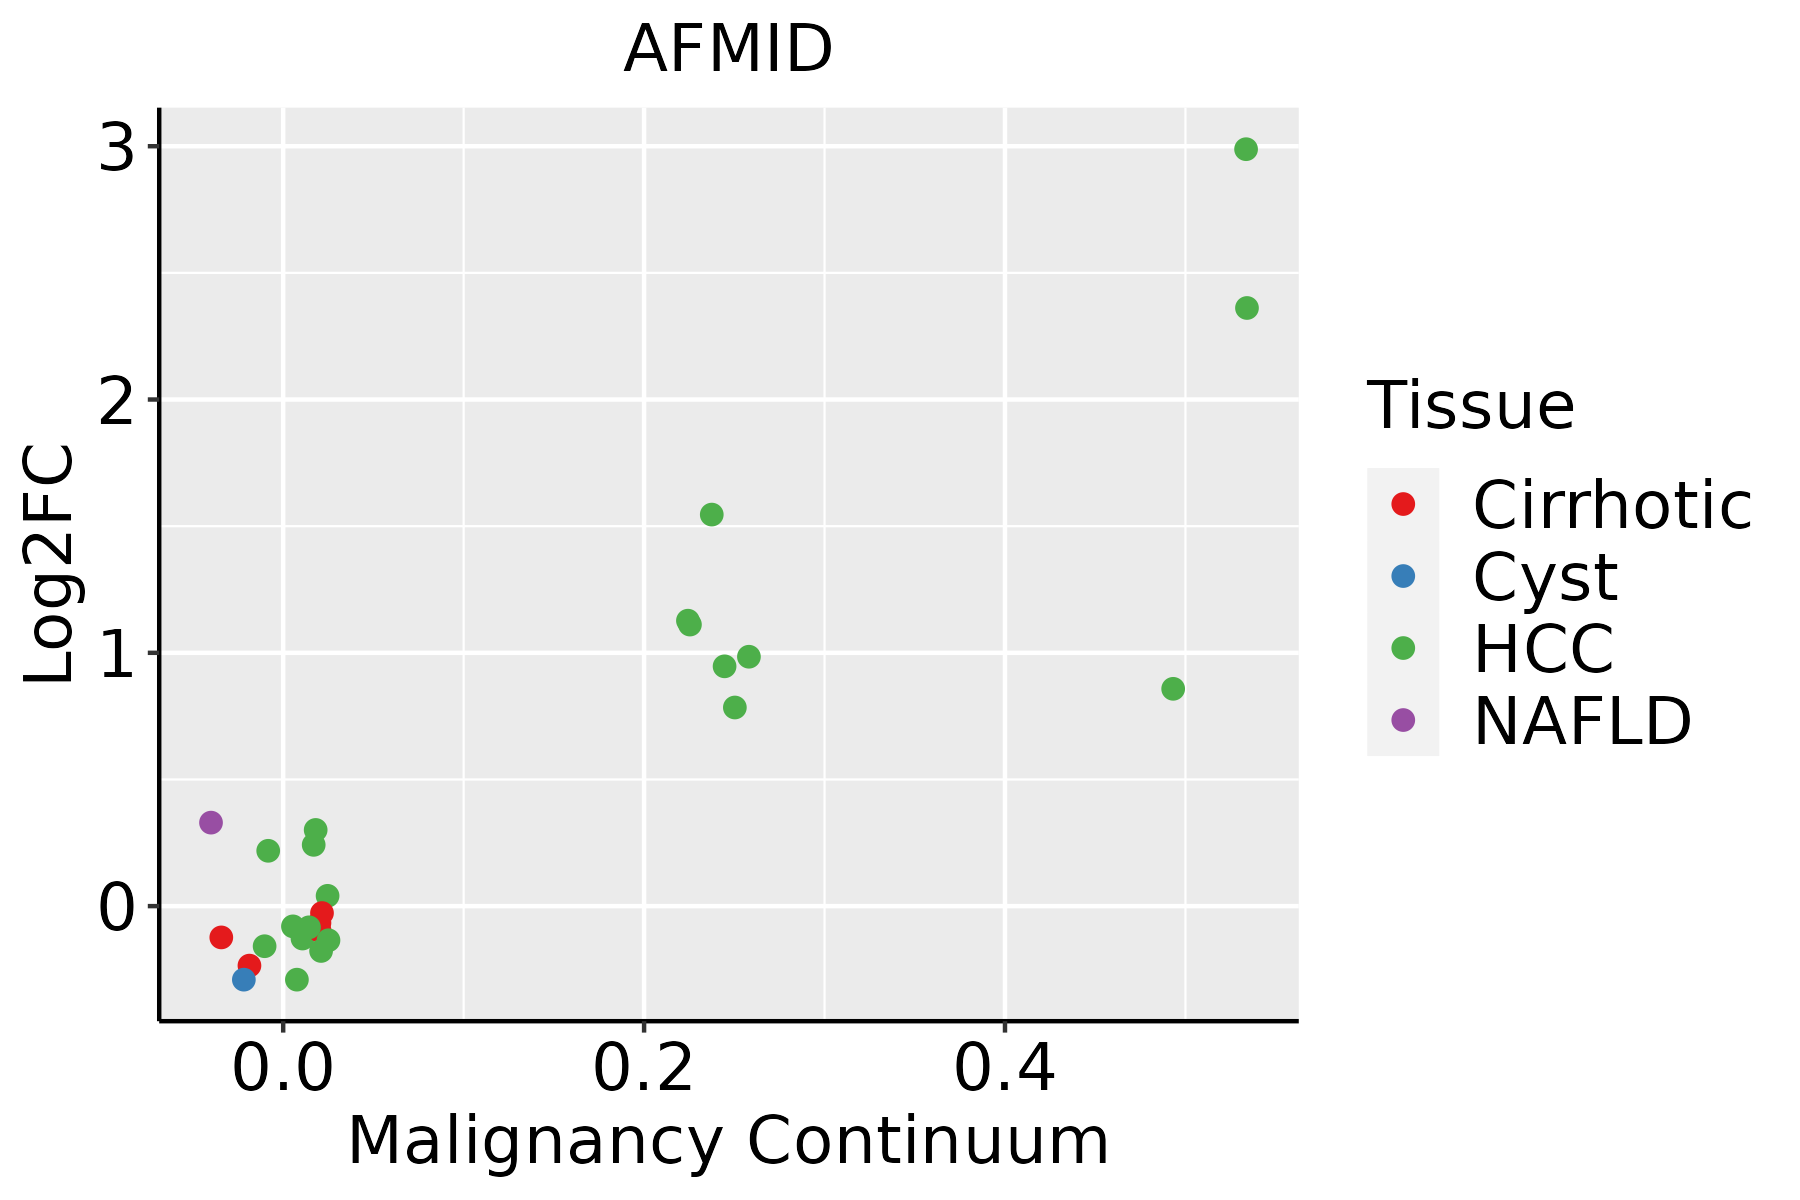 | HCC: Hepatocellular carcinoma |
| NAFLD: Non-alcoholic fatty liver disease |
| GO ID | Tissue | Disease Stage | Description | Gene Ratio | Bg Ratio | pvalue | p.adjust | Count |
| GO:0009117 | Colorectum | AD | nucleotide metabolic process | 168/3918 | 489/18723 | 2.20e-12 | 3.36e-10 | 168 |
| GO:0006753 | Colorectum | AD | nucleoside phosphate metabolic process | 169/3918 | 497/18723 | 4.99e-12 | 6.98e-10 | 169 |
| GO:0044270 | Colorectum | AD | cellular nitrogen compound catabolic process | 147/3918 | 451/18723 | 3.35e-09 | 2.23e-07 | 147 |
| GO:0046700 | Colorectum | AD | heterocycle catabolic process | 145/3918 | 445/18723 | 4.37e-09 | 2.84e-07 | 145 |
| GO:0019439 | Colorectum | AD | aromatic compound catabolic process | 146/3918 | 467/18723 | 7.48e-08 | 3.84e-06 | 146 |
| GO:1901361 | Colorectum | AD | organic cyclic compound catabolic process | 153/3918 | 495/18723 | 8.23e-08 | 4.18e-06 | 153 |
| GO:0044282 | Colorectum | AD | small molecule catabolic process | 118/3918 | 376/18723 | 1.05e-06 | 3.55e-05 | 118 |
| GO:1901293 | Colorectum | AD | nucleoside phosphate biosynthetic process | 80/3918 | 256/18723 | 6.31e-05 | 1.05e-03 | 80 |
| GO:0009165 | Colorectum | AD | nucleotide biosynthetic process | 79/3918 | 254/18723 | 8.33e-05 | 1.30e-03 | 79 |
| GO:0016054 | Colorectum | AD | organic acid catabolic process | 73/3918 | 240/18723 | 3.20e-04 | 3.81e-03 | 73 |
| GO:0046395 | Colorectum | AD | carboxylic acid catabolic process | 70/3918 | 236/18723 | 9.06e-04 | 8.71e-03 | 70 |
| GO:0006520 | Colorectum | AD | cellular amino acid metabolic process | 81/3918 | 284/18723 | 1.37e-03 | 1.19e-02 | 81 |
| GO:00442702 | Colorectum | MSS | cellular nitrogen compound catabolic process | 141/3467 | 451/18723 | 2.95e-11 | 3.83e-09 | 141 |
| GO:00467002 | Colorectum | MSS | heterocycle catabolic process | 139/3467 | 445/18723 | 4.37e-11 | 5.05e-09 | 139 |
| GO:19013612 | Colorectum | MSS | organic cyclic compound catabolic process | 148/3467 | 495/18723 | 3.47e-10 | 3.18e-08 | 148 |
| GO:00194392 | Colorectum | MSS | aromatic compound catabolic process | 140/3467 | 467/18723 | 8.56e-10 | 6.85e-08 | 140 |
| GO:00091172 | Colorectum | MSS | nucleotide metabolic process | 144/3467 | 489/18723 | 1.87e-09 | 1.35e-07 | 144 |
| GO:00067532 | Colorectum | MSS | nucleoside phosphate metabolic process | 145/3467 | 497/18723 | 3.25e-09 | 2.23e-07 | 145 |
| GO:19012932 | Colorectum | MSS | nucleoside phosphate biosynthetic process | 71/3467 | 256/18723 | 1.80e-04 | 2.56e-03 | 71 |
| GO:00091652 | Colorectum | MSS | nucleotide biosynthetic process | 70/3467 | 254/18723 | 2.44e-04 | 3.34e-03 | 70 |
| Pathway ID | Tissue | Disease Stage | Description | Gene Ratio | Bg Ratio | pvalue | p.adjust | qvalue | Count |
| hsa00380 | Colorectum | FAP | Tryptophan metabolism | 13/1404 | 42/8465 | 1.54e-02 | 4.99e-02 | 3.03e-02 | 13 |
| hsa003801 | Colorectum | FAP | Tryptophan metabolism | 13/1404 | 42/8465 | 1.54e-02 | 4.99e-02 | 3.03e-02 | 13 |
| hsa012405 | Esophagus | ESCC | Biosynthesis of cofactors | 97/4205 | 153/8465 | 3.88e-04 | 1.35e-03 | 6.94e-04 | 97 |
| hsa006306 | Esophagus | ESCC | Glyoxylate and dicarboxylate metabolism | 21/4205 | 30/8465 | 1.95e-02 | 4.35e-02 | 2.23e-02 | 21 |
| hsa0124012 | Esophagus | ESCC | Biosynthesis of cofactors | 97/4205 | 153/8465 | 3.88e-04 | 1.35e-03 | 6.94e-04 | 97 |
| hsa0063013 | Esophagus | ESCC | Glyoxylate and dicarboxylate metabolism | 21/4205 | 30/8465 | 1.95e-02 | 4.35e-02 | 2.23e-02 | 21 |
| hsa006304 | Liver | Cirrhotic | Glyoxylate and dicarboxylate metabolism | 20/2530 | 30/8465 | 3.36e-05 | 2.54e-04 | 1.57e-04 | 20 |
| hsa01240 | Liver | Cirrhotic | Biosynthesis of cofactors | 66/2530 | 153/8465 | 3.11e-04 | 1.99e-03 | 1.23e-03 | 66 |
| hsa003802 | Liver | Cirrhotic | Tryptophan metabolism | 22/2530 | 42/8465 | 1.85e-03 | 8.37e-03 | 5.16e-03 | 22 |
| hsa0063011 | Liver | Cirrhotic | Glyoxylate and dicarboxylate metabolism | 20/2530 | 30/8465 | 3.36e-05 | 2.54e-04 | 1.57e-04 | 20 |
| hsa012401 | Liver | Cirrhotic | Biosynthesis of cofactors | 66/2530 | 153/8465 | 3.11e-04 | 1.99e-03 | 1.23e-03 | 66 |
| hsa0038011 | Liver | Cirrhotic | Tryptophan metabolism | 22/2530 | 42/8465 | 1.85e-03 | 8.37e-03 | 5.16e-03 | 22 |
| hsa012402 | Liver | HCC | Biosynthesis of cofactors | 103/4020 | 153/8465 | 4.67e-07 | 5.05e-06 | 2.81e-06 | 103 |
| hsa0063021 | Liver | HCC | Glyoxylate and dicarboxylate metabolism | 24/4020 | 30/8465 | 2.66e-04 | 1.24e-03 | 6.88e-04 | 24 |
| hsa012403 | Liver | HCC | Biosynthesis of cofactors | 103/4020 | 153/8465 | 4.67e-07 | 5.05e-06 | 2.81e-06 | 103 |
| hsa0063031 | Liver | HCC | Glyoxylate and dicarboxylate metabolism | 24/4020 | 30/8465 | 2.66e-04 | 1.24e-03 | 6.88e-04 | 24 |
| Hugo Symbol | Variant Class | Variant Classification | dbSNP RS | HGVSc | HGVSp | HGVSp Short | SWISSPROT | BIOTYPE | SIFT | PolyPhen | Tumor Sample Barcode | Tissue | Histology | Sex | Age | Stage | Therapy Types | Drugs | Outcome |
| AFMID | SNV | Missense_Mutation | rs374429075 | c.748N>A | p.Glu250Lys | p.E250K | Q63HM1 | protein_coding | deleterious(0) | probably_damaging(0.998) | TCGA-D8-A1JJ-01 | Breast | breast invasive carcinoma | Female | <65 | I/II | Chemotherapy | doxorubicine | SD |
| AFMID | insertion | Frame_Shift_Ins | novel | c.358_359insGCTCACA | p.Ala120GlyfsTer81 | p.A120Gfs*81 | Q63HM1 | protein_coding | | | TCGA-A8-A093-01 | Breast | breast invasive carcinoma | Female | <65 | I/II | Hormone Therapy | tamoxiphen | SD |
| AFMID | insertion | In_Frame_Ins | novel | c.360_361insTATAATCCCACACATTGGGAGGCTGAGGCAGGA | p.Ala120_Val121insTyrAsnProThrHisTrpGluAlaGluAlaGly | p.A120_V121insYNPTHWEAEAG | Q63HM1 | protein_coding | | | TCGA-A8-A093-01 | Breast | breast invasive carcinoma | Female | <65 | I/II | Hormone Therapy | tamoxiphen | SD |
| AFMID | SNV | Missense_Mutation | rs143224831 | c.304N>A | p.Gly102Arg | p.G102R | Q63HM1 | protein_coding | deleterious(0.04) | probably_damaging(0.989) | TCGA-2W-A8YY-01 | Cervix | cervical & endocervical cancer | Female | <65 | I/II | Chemotherapy | cisplatin | CR |
| AFMID | SNV | Missense_Mutation | rs575961186 | c.916N>G | p.Ile306Val | p.I306V | Q63HM1 | protein_coding | tolerated(0.1) | benign(0.03) | TCGA-EA-A411-01 | Cervix | cervical & endocervical cancer | Female | <65 | I/II | Unknown | Unknown | SD |
| AFMID | SNV | Missense_Mutation | | c.743N>T | p.Ser248Phe | p.S248F | Q63HM1 | protein_coding | deleterious(0) | probably_damaging(0.998) | TCGA-VS-A9UU-01 | Cervix | cervical & endocervical cancer | Female | <65 | I/II | Chemotherapy | cisplatin | CR |
| AFMID | SNV | Missense_Mutation | novel | c.745N>A | p.Pro249Thr | p.P249T | Q63HM1 | protein_coding | tolerated(0.05) | probably_damaging(0.952) | TCGA-A6-5666-01 | Colorectum | colon adenocarcinoma | Male | >=65 | I/II | Unknown | Unknown | PD |
| AFMID | SNV | Missense_Mutation | | c.371N>C | p.Val124Ala | p.V124A | Q63HM1 | protein_coding | deleterious(0.03) | benign(0.164) | TCGA-AA-3672-01 | Colorectum | colon adenocarcinoma | Female | >=65 | III/IV | Unknown | Unknown | SD |
| AFMID | SNV | Missense_Mutation | | c.72N>T | p.Glu24Asp | p.E24D | Q63HM1 | protein_coding | tolerated(0.09) | benign(0.015) | TCGA-CA-6717-01 | Colorectum | colon adenocarcinoma | Male | <65 | I/II | Chemotherapy | oxaliplatin | CR |
| AFMID | SNV | Missense_Mutation | novel | c.650N>C | p.Asp217Ala | p.D217A | Q63HM1 | protein_coding | tolerated(1) | benign(0.272) | TCGA-CK-6746-01 | Colorectum | colon adenocarcinoma | Female | >=65 | I/II | Unknown | Unknown | SD |


