
|
|||||
|
 | |
| |
| |
| |
| |
| |
|
Gene: AFG3L2 |
Gene summary for AFG3L2 |
| Gene information | Species | Human | Gene symbol | AFG3L2 | Gene ID | 10939 |
| Gene name | AFG3 like matrix AAA peptidase subunit 2 | |
| Gene Alias | OPA12 | |
| Cytomap | 18p11.21 | |
| Gene Type | protein-coding | GO ID | GO:0000902 | UniProtAcc | Q8TA92 |
Top |
Malignant transformation analysis |
| Identification of the aberrant gene expression in precancerous and cancerous lesions by comparing the gene expression of stem-like cells in diseased tissues with normal stem cells |
| Entrez ID | Symbol | Replicates | Species | Organ | Tissue | Adj P-value | Log2FC | Malignancy |
| 10939 | AFG3L2 | HTA11_1938_2000001011 | Human | Colorectum | AD | 1.34e-14 | 1.11e+00 | -0.0811 |
| 10939 | AFG3L2 | HTA11_347_2000001011 | Human | Colorectum | AD | 2.45e-14 | 5.92e-01 | -0.1954 |
| 10939 | AFG3L2 | HTA11_83_2000001011 | Human | Colorectum | SER | 9.40e-07 | 6.97e-01 | -0.1526 |
| 10939 | AFG3L2 | HTA11_1391_2000001011 | Human | Colorectum | AD | 1.23e-06 | 5.39e-01 | -0.059 |
| 10939 | AFG3L2 | HTA11_99999970781_79442 | Human | Colorectum | MSS | 1.82e-32 | 1.18e+00 | 0.294 |
| 10939 | AFG3L2 | HTA11_99999965062_69753 | Human | Colorectum | MSI-H | 3.43e-02 | 8.71e-01 | 0.3487 |
| 10939 | AFG3L2 | A015-C-203 | Human | Colorectum | FAP | 1.17e-19 | -2.75e-01 | -0.1294 |
| 10939 | AFG3L2 | A015-C-204 | Human | Colorectum | FAP | 8.02e-03 | -1.84e-01 | -0.0228 |
| 10939 | AFG3L2 | A002-C-201 | Human | Colorectum | FAP | 3.46e-08 | -1.92e-01 | 0.0324 |
| 10939 | AFG3L2 | A001-C-119 | Human | Colorectum | FAP | 1.22e-04 | -3.07e-01 | -0.1557 |
| 10939 | AFG3L2 | A001-C-108 | Human | Colorectum | FAP | 3.44e-13 | -1.43e-01 | -0.0272 |
| 10939 | AFG3L2 | A002-C-205 | Human | Colorectum | FAP | 1.22e-13 | -2.75e-01 | -0.1236 |
| 10939 | AFG3L2 | A015-C-006 | Human | Colorectum | FAP | 3.99e-09 | -1.20e-01 | -0.0994 |
| 10939 | AFG3L2 | A015-C-106 | Human | Colorectum | FAP | 6.36e-05 | -1.02e-01 | -0.0511 |
| 10939 | AFG3L2 | A002-C-114 | Human | Colorectum | FAP | 8.03e-10 | -2.01e-01 | -0.1561 |
| 10939 | AFG3L2 | A015-C-104 | Human | Colorectum | FAP | 9.66e-20 | -1.20e-01 | -0.1899 |
| 10939 | AFG3L2 | A001-C-014 | Human | Colorectum | FAP | 3.83e-10 | -2.19e-01 | 0.0135 |
| 10939 | AFG3L2 | A002-C-016 | Human | Colorectum | FAP | 1.72e-12 | -2.29e-01 | 0.0521 |
| 10939 | AFG3L2 | A015-C-002 | Human | Colorectum | FAP | 1.21e-07 | -2.77e-01 | -0.0763 |
| 10939 | AFG3L2 | A001-C-203 | Human | Colorectum | FAP | 4.94e-05 | -8.53e-02 | -0.0481 |
| Page: 1 2 3 4 5 6 7 8 |
| Tissue | Expression Dynamics | Abbreviation |
| Colorectum (GSE201348) | 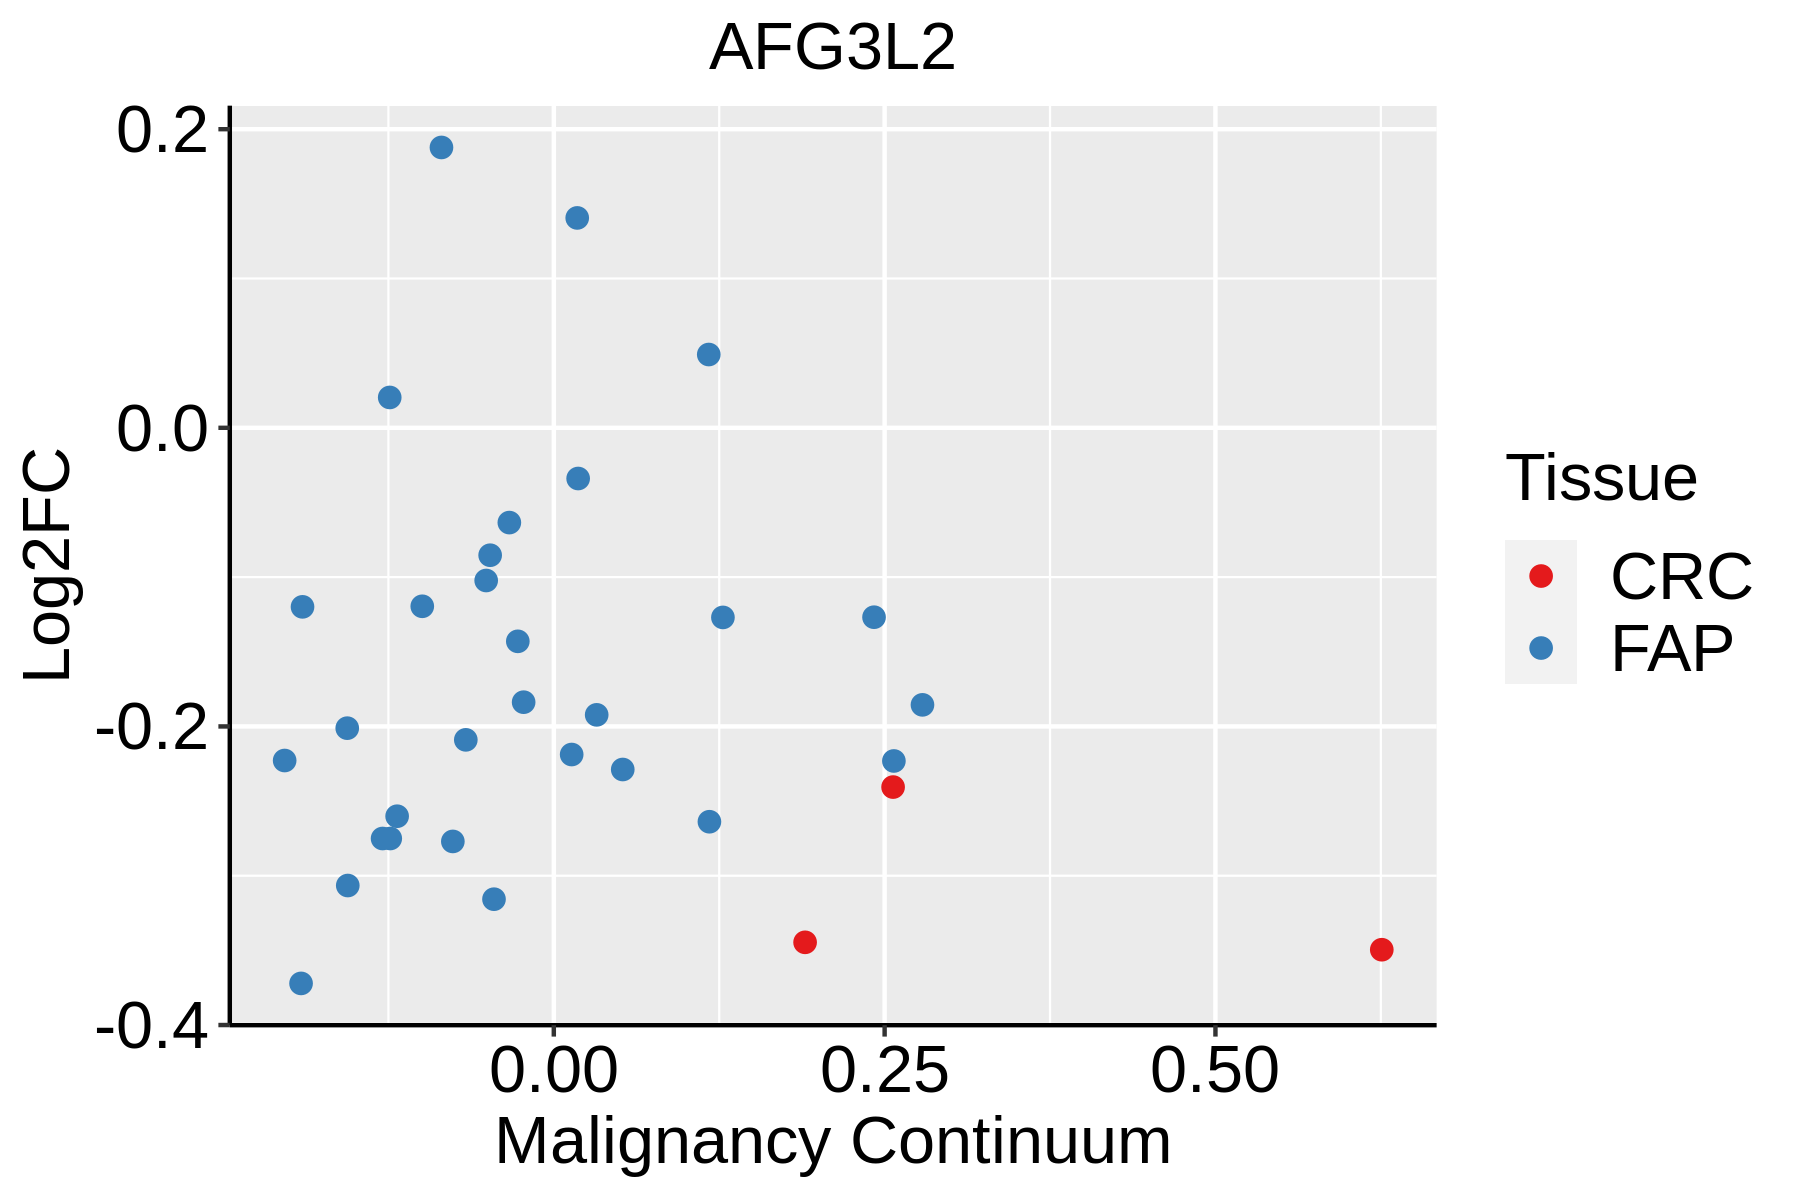 | FAP: Familial adenomatous polyposis |
| CRC: Colorectal cancer | ||
| Colorectum (HTA11) |  | AD: Adenomas |
| SER: Sessile serrated lesions | ||
| MSI-H: Microsatellite-high colorectal cancer | ||
| MSS: Microsatellite stable colorectal cancer | ||
| Esophagus | 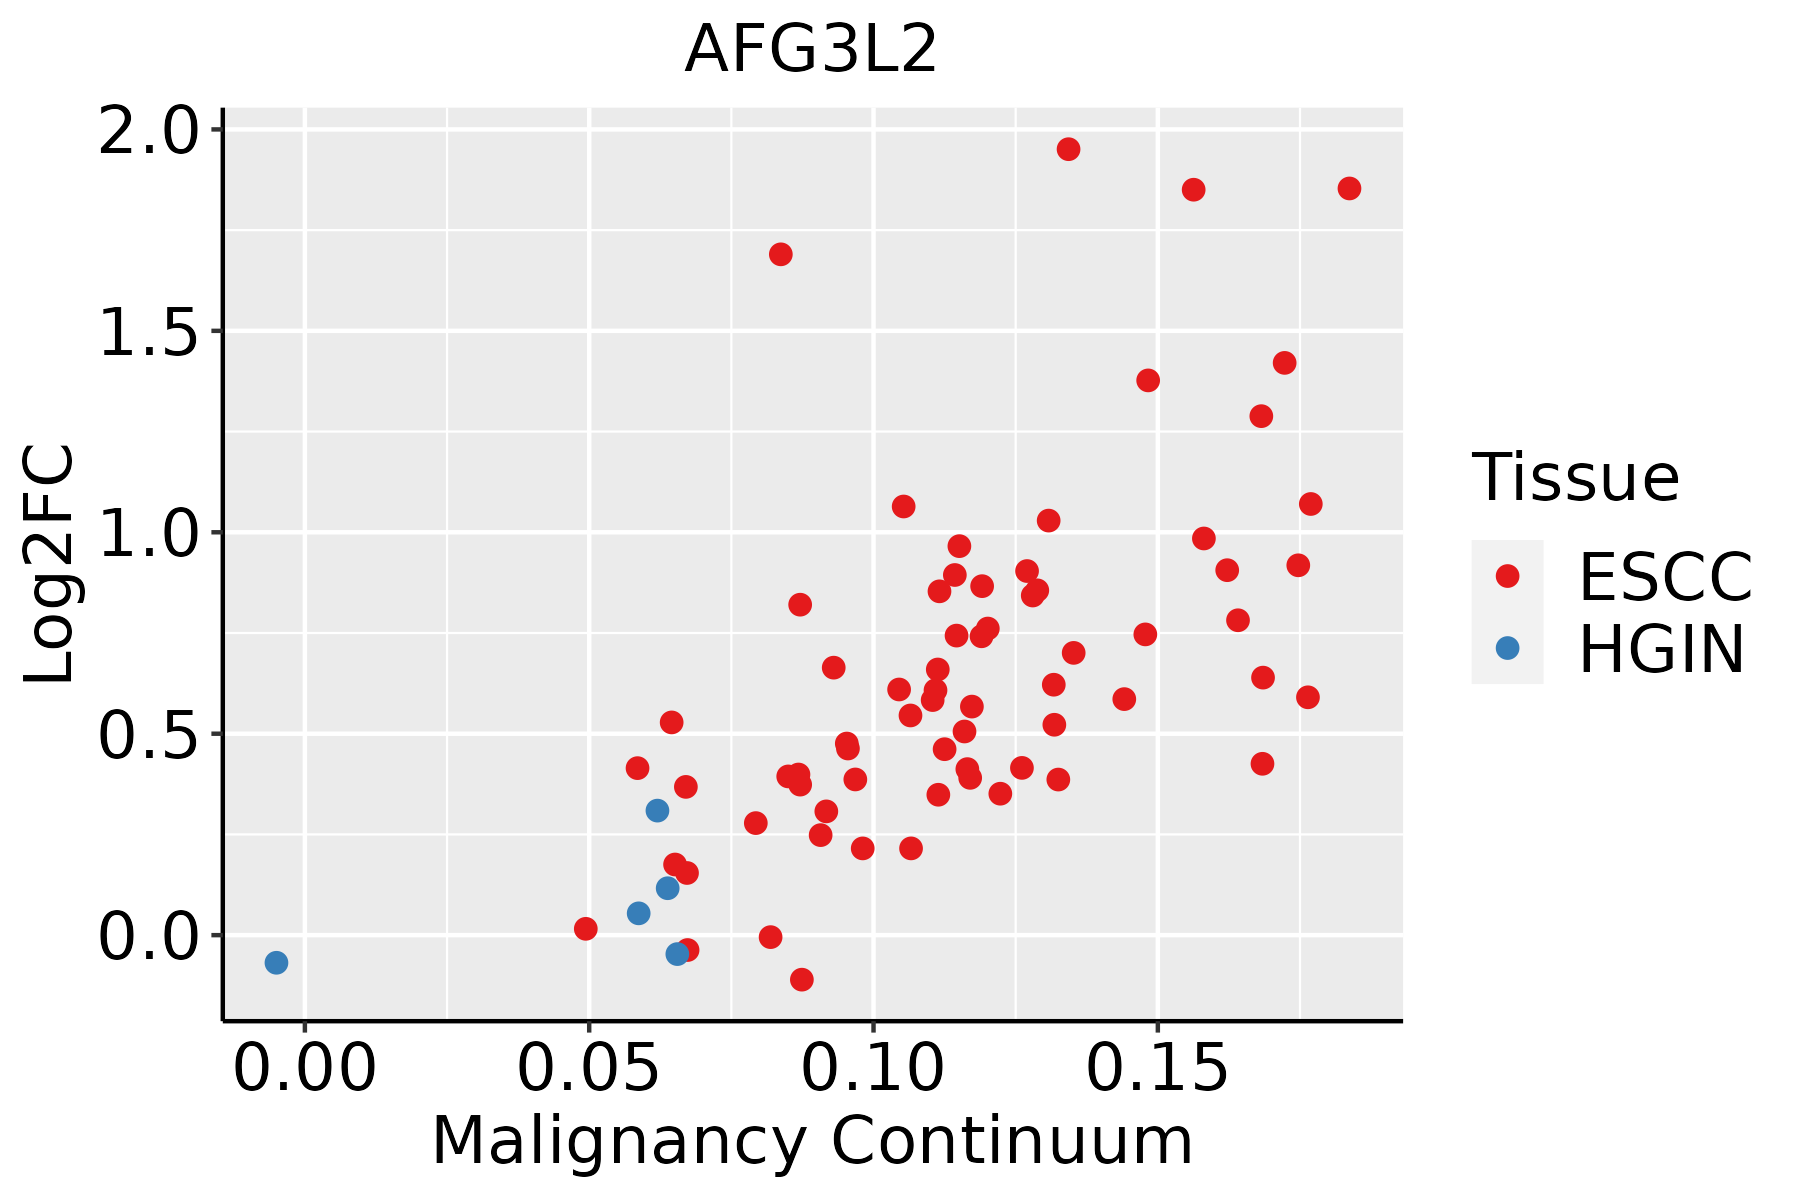 | ESCC: Esophageal squamous cell carcinoma |
| HGIN: High-grade intraepithelial neoplasias | ||
| LGIN: Low-grade intraepithelial neoplasias | ||
| Liver | 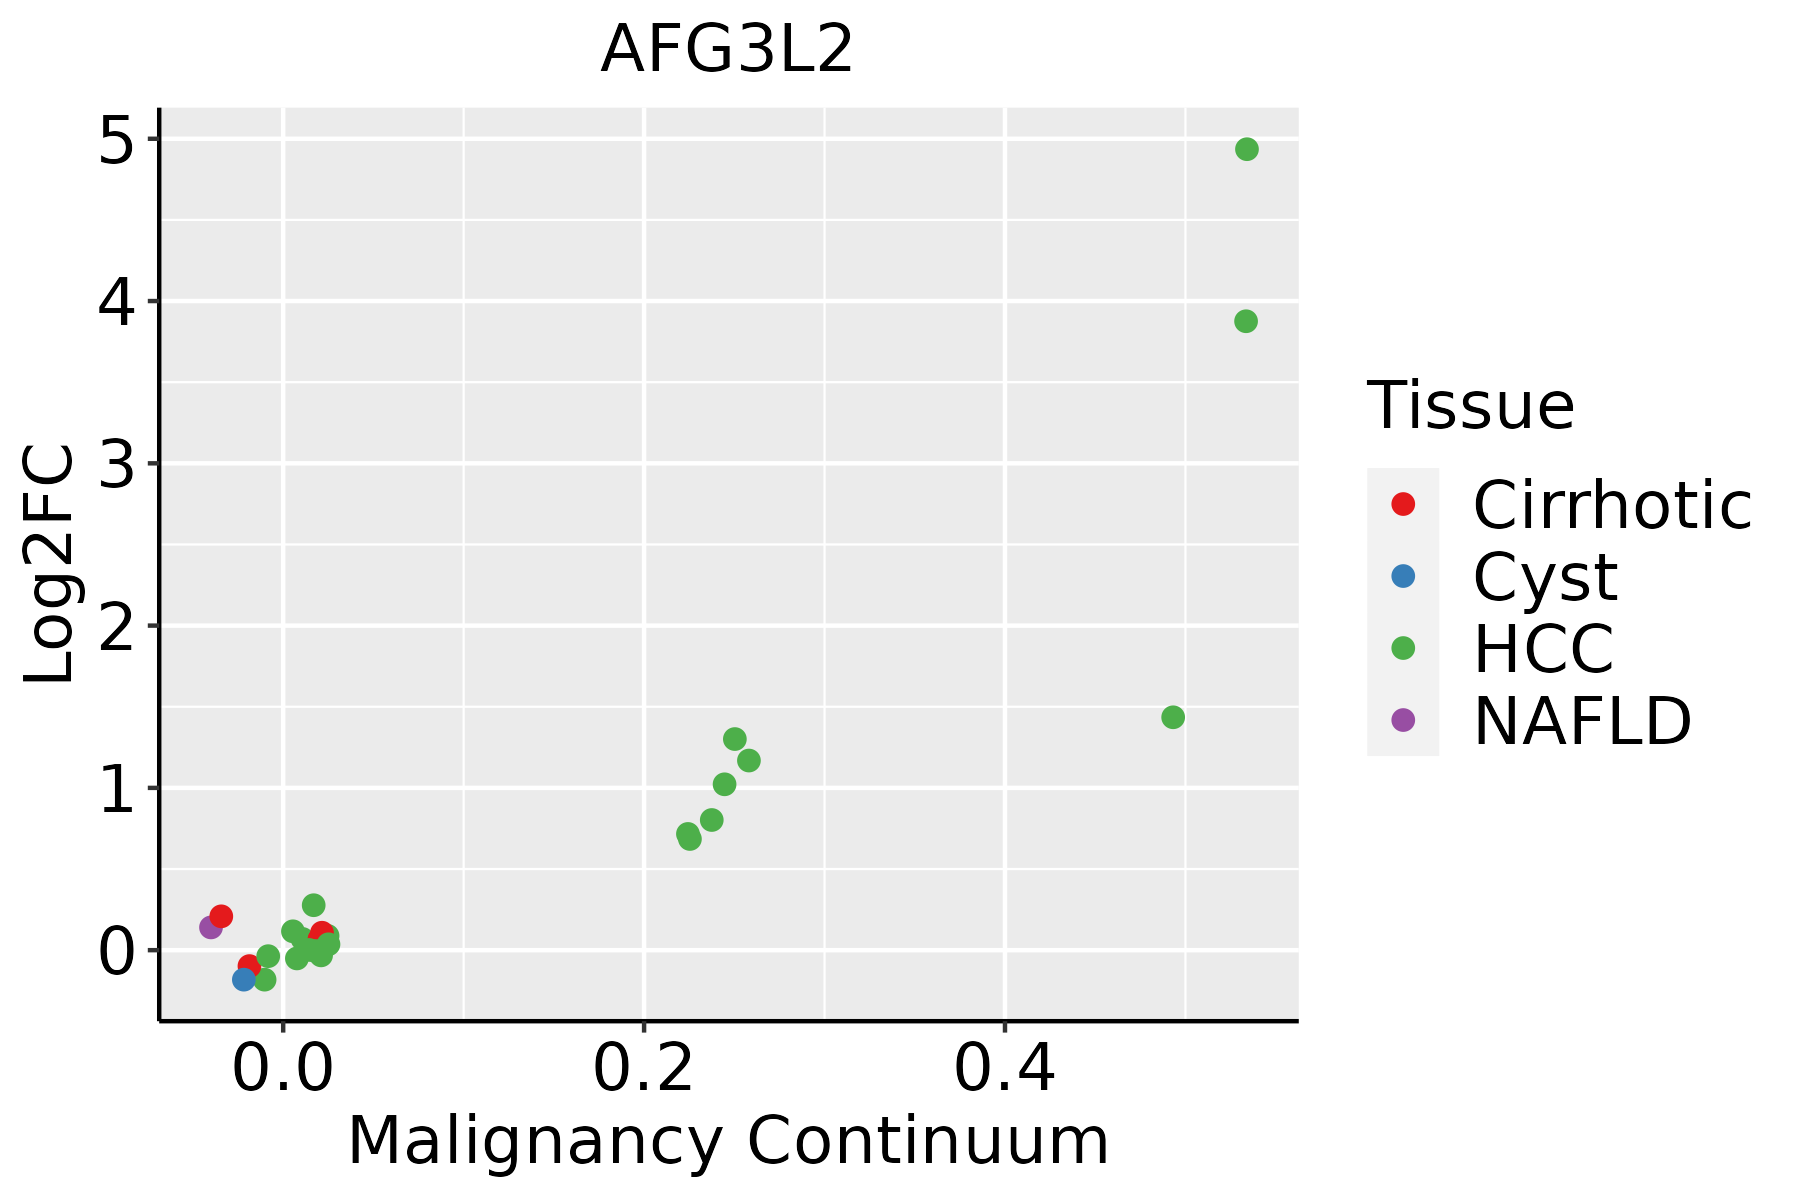 | HCC: Hepatocellular carcinoma |
| NAFLD: Non-alcoholic fatty liver disease | ||
| Oral Cavity |  | EOLP: Erosive Oral lichen planus |
| LP: leukoplakia | ||
| NEOLP: Non-erosive oral lichen planus | ||
| OSCC: Oral squamous cell carcinoma | ||
| Skin |  | AK: Actinic keratosis |
| cSCC: Cutaneous squamous cell carcinoma | ||
| SCCIS:squamous cell carcinoma in situ | ||
| Thyroid | 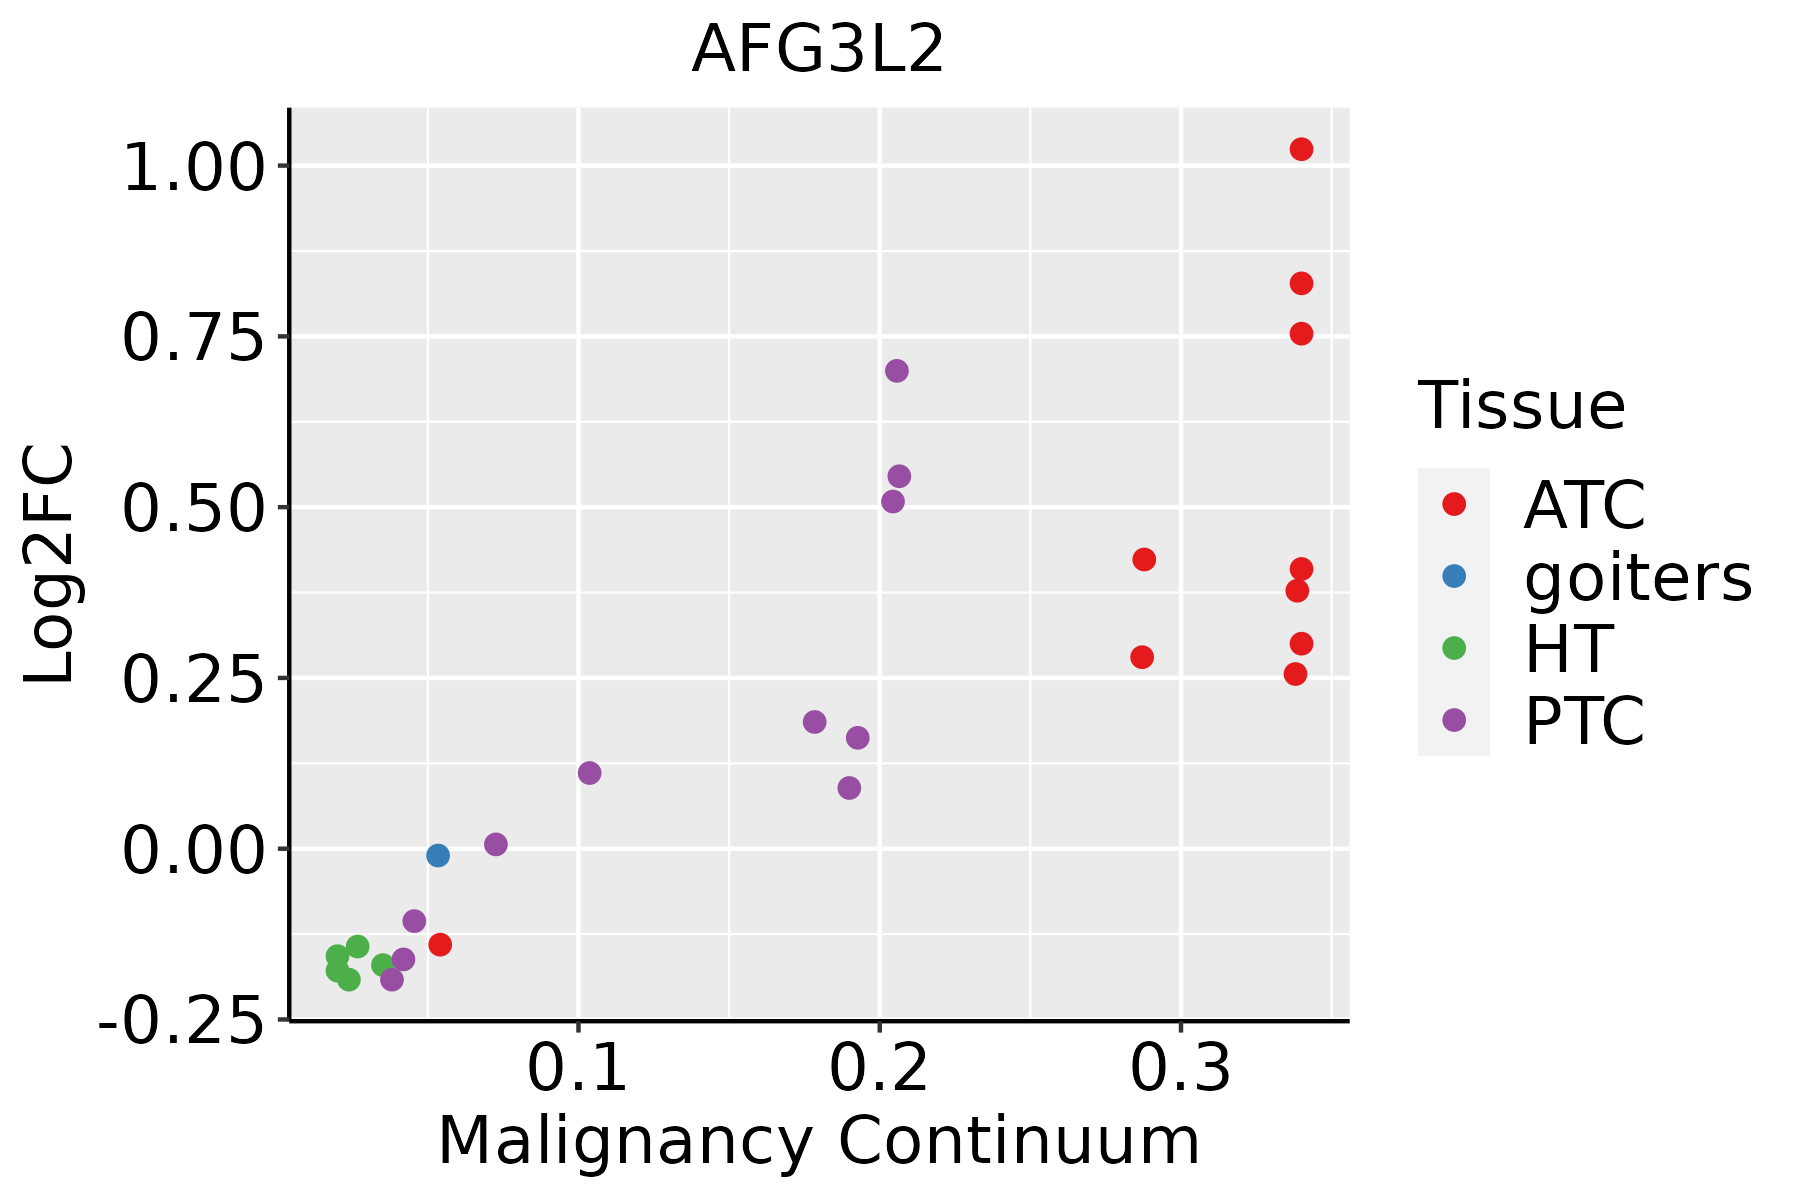 | ATC: Anaplastic thyroid cancer |
| HT: Hashimoto's thyroiditis | ||
| PTC: Papillary thyroid cancer |
| ∗log2FC in expression of this searched gene in stem-like cells from each diseased tissue sample relative to stem-like cells in normal samples in each tissue plotted against the malignancy continuum. Samples are colored based on if they are from different disease stage. |
Top |
Malignant transformation related pathway analysis |
| Find out the enriched GO biological processes and KEGG pathways involved in transition from healthy to precancer to cancer |
| Tissue | Disease Stage | Enriched GO biological Processes |
| Colorectum | AD |  |
| Colorectum | SER |  |
| Colorectum | MSS |  |
| Colorectum | MSI-H |  |
| Colorectum | FAP |  |
| ∗Top 15 enriched GO BP terms are showed in the bar plot of each disease state in each tissue. Each row represents a significant GO biological process which is colored according to the -log10(p.adjust). |
| Page: 1 2 3 4 5 6 7 8 9 |
| GO ID | Tissue | Disease Stage | Description | Gene Ratio | Bg Ratio | pvalue | p.adjust | Count |
| GO:0006839 | Colorectum | AD | mitochondrial transport | 102/3918 | 254/18723 | 1.87e-12 | 3.08e-10 | 102 |
| GO:1990542 | Colorectum | AD | mitochondrial transmembrane transport | 47/3918 | 102/18723 | 1.09e-08 | 6.52e-07 | 47 |
| GO:0007006 | Colorectum | AD | mitochondrial membrane organization | 48/3918 | 116/18723 | 4.53e-07 | 1.72e-05 | 48 |
| GO:0007409 | Colorectum | AD | axonogenesis | 122/3918 | 418/18723 | 3.36e-05 | 6.15e-04 | 122 |
| GO:0061564 | Colorectum | AD | axon development | 132/3918 | 467/18723 | 8.40e-05 | 1.31e-03 | 132 |
| GO:0007007 | Colorectum | AD | inner mitochondrial membrane organization | 18/3918 | 38/18723 | 2.45e-04 | 3.09e-03 | 18 |
| GO:0051604 | Colorectum | AD | protein maturation | 85/3918 | 294/18723 | 6.73e-04 | 6.91e-03 | 85 |
| GO:0051560 | Colorectum | AD | mitochondrial calcium ion homeostasis | 13/3918 | 26/18723 | 9.41e-04 | 8.92e-03 | 13 |
| GO:0048638 | Colorectum | AD | regulation of developmental growth | 92/3918 | 330/18723 | 1.48e-03 | 1.25e-02 | 92 |
| GO:0036444 | Colorectum | AD | calcium import into the mitochondrion | 8/3918 | 14/18723 | 3.23e-03 | 2.38e-02 | 8 |
| GO:0006851 | Colorectum | AD | mitochondrial calcium ion transmembrane transport | 10/3918 | 20/18723 | 3.67e-03 | 2.60e-02 | 10 |
| GO:0033619 | Colorectum | AD | membrane protein proteolysis | 21/3918 | 57/18723 | 4.16e-03 | 2.88e-02 | 21 |
| GO:0050808 | Colorectum | AD | synapse organization | 112/3918 | 426/18723 | 4.25e-03 | 2.92e-02 | 112 |
| GO:0016485 | Colorectum | AD | protein processing | 63/3918 | 225/18723 | 6.77e-03 | 4.19e-02 | 63 |
| GO:0048284 | Colorectum | AD | organelle fusion | 42/3918 | 141/18723 | 8.04e-03 | 4.73e-02 | 42 |
| GO:00068391 | Colorectum | SER | mitochondrial transport | 87/2897 | 254/18723 | 7.91e-14 | 3.03e-11 | 87 |
| GO:19905421 | Colorectum | SER | mitochondrial transmembrane transport | 42/2897 | 102/18723 | 3.65e-10 | 4.77e-08 | 42 |
| GO:00070061 | Colorectum | SER | mitochondrial membrane organization | 38/2897 | 116/18723 | 2.66e-06 | 1.10e-04 | 38 |
| GO:00516041 | Colorectum | SER | protein maturation | 73/2897 | 294/18723 | 1.82e-05 | 5.38e-04 | 73 |
| GO:00164851 | Colorectum | SER | protein processing | 55/2897 | 225/18723 | 2.84e-04 | 4.67e-03 | 55 |
| Page: 1 2 3 4 5 6 7 8 9 10 |
| Pathway ID | Tissue | Disease Stage | Description | Gene Ratio | Bg Ratio | pvalue | p.adjust | qvalue | Count |
| hsa05017 | Colorectum | AD | Spinocerebellar ataxia | 60/2092 | 143/8465 | 3.78e-06 | 4.35e-05 | 2.78e-05 | 60 |
| hsa050171 | Colorectum | AD | Spinocerebellar ataxia | 60/2092 | 143/8465 | 3.78e-06 | 4.35e-05 | 2.78e-05 | 60 |
| hsa050172 | Colorectum | SER | Spinocerebellar ataxia | 46/1580 | 143/8465 | 6.78e-05 | 7.51e-04 | 5.45e-04 | 46 |
| hsa050173 | Colorectum | SER | Spinocerebellar ataxia | 46/1580 | 143/8465 | 6.78e-05 | 7.51e-04 | 5.45e-04 | 46 |
| hsa050178 | Colorectum | FAP | Spinocerebellar ataxia | 37/1404 | 143/8465 | 2.94e-03 | 1.29e-02 | 7.86e-03 | 37 |
| hsa050179 | Colorectum | FAP | Spinocerebellar ataxia | 37/1404 | 143/8465 | 2.94e-03 | 1.29e-02 | 7.86e-03 | 37 |
| hsa0501727 | Esophagus | HGIN | Spinocerebellar ataxia | 43/1383 | 143/8465 | 2.68e-05 | 3.64e-04 | 2.89e-04 | 43 |
| hsa05017112 | Esophagus | HGIN | Spinocerebellar ataxia | 43/1383 | 143/8465 | 2.68e-05 | 3.64e-04 | 2.89e-04 | 43 |
| hsa0501710 | Liver | Cirrhotic | Spinocerebellar ataxia | 66/2530 | 143/8465 | 2.58e-05 | 2.15e-04 | 1.32e-04 | 66 |
| hsa0501711 | Liver | Cirrhotic | Spinocerebellar ataxia | 66/2530 | 143/8465 | 2.58e-05 | 2.15e-04 | 1.32e-04 | 66 |
| hsa0501721 | Liver | HCC | Spinocerebellar ataxia | 92/4020 | 143/8465 | 3.20e-05 | 1.88e-04 | 1.04e-04 | 92 |
| hsa0501731 | Liver | HCC | Spinocerebellar ataxia | 92/4020 | 143/8465 | 3.20e-05 | 1.88e-04 | 1.04e-04 | 92 |
| hsa0501725 | Oral cavity | OSCC | Spinocerebellar ataxia | 86/3704 | 143/8465 | 5.21e-05 | 2.08e-04 | 1.06e-04 | 86 |
| hsa05017111 | Oral cavity | OSCC | Spinocerebellar ataxia | 86/3704 | 143/8465 | 5.21e-05 | 2.08e-04 | 1.06e-04 | 86 |
| Page: 1 |
Top |
Cell-cell communication analysis |
| Identification of potential cell-cell interactions between two cell types and their ligand-receptor pairs for different disease states |
| Ligand | Receptor | LRpair | Pathway | Tissue | Disease Stage |
| Page: 1 |
Top |
Single-cell gene regulatory network inference analysis |
| Find out the significant the regulons (TFs) and the target genes of each regulon across cell types for different disease states |
| TF | Cell Type | Tissue | Disease Stage | Target Gene | RSS | Regulon Activity |
| ∗The dot plots of a searched regulon are shown for all cell subpopulations in each disease state of each tissue based on the regulon specific score inferred using pySCENIC and by calculating the average expression. |
| Page: 1 |
Top |
Somatic mutation of malignant transformation related genes |
| Annotation of somatic variants for genes involved in malignant transformation |
| Hugo Symbol | Variant Class | Variant Classification | dbSNP RS | HGVSc | HGVSp | HGVSp Short | SWISSPROT | BIOTYPE | SIFT | PolyPhen | Tumor Sample Barcode | Tissue | Histology | Sex | Age | Stage | Therapy Types | Drugs | Outcome |
| AFG3L2 | SNV | Missense_Mutation | c.2093N>G | p.Asp698Gly | p.D698G | Q9Y4W6 | protein_coding | deleterious(0) | probably_damaging(0.997) | TCGA-BH-A0B4-01 | Breast | breast invasive carcinoma | Male | >=65 | III/IV | Hormone Therapy | tamoxiphen | SD | |
| AFG3L2 | SNV | Missense_Mutation | novel | c.2323N>A | p.Gly775Ser | p.G775S | Q9Y4W6 | protein_coding | deleterious(0.02) | possibly_damaging(0.847) | TCGA-BH-A0HL-01 | Breast | breast invasive carcinoma | Female | <65 | I/II | Chemotherapy | cyclophosphamide | SD |
| AFG3L2 | SNV | Missense_Mutation | novel | c.1242N>C | p.Arg414Ser | p.R414S | Q9Y4W6 | protein_coding | deleterious(0) | probably_damaging(0.925) | TCGA-C5-A8XH-01 | Cervix | cervical & endocervical cancer | Female | <65 | I/II | Unknown | Unknown | SD |
| AFG3L2 | SNV | Missense_Mutation | novel | c.1282G>C | p.Glu428Gln | p.E428Q | Q9Y4W6 | protein_coding | deleterious(0) | probably_damaging(0.951) | TCGA-JW-A5VL-01 | Cervix | cervical & endocervical cancer | Female | <65 | I/II | Unknown | Unknown | SD |
| AFG3L2 | SNV | Missense_Mutation | c.2132N>T | p.Arg711Ile | p.R711I | Q9Y4W6 | protein_coding | deleterious(0.01) | possibly_damaging(0.678) | TCGA-AA-A00N-01 | Colorectum | colon adenocarcinoma | Male | >=65 | I/II | Unknown | Unknown | PD | |
| AFG3L2 | SNV | Missense_Mutation | c.243A>C | p.Lys81Asn | p.K81N | Q9Y4W6 | protein_coding | deleterious(0.01) | benign(0.287) | TCGA-CA-6718-01 | Colorectum | colon adenocarcinoma | Male | <65 | I/II | Unknown | Unknown | PD | |
| AFG3L2 | SNV | Missense_Mutation | c.1796N>A | p.Arg599His | p.R599H | Q9Y4W6 | protein_coding | deleterious(0.01) | probably_damaging(1) | TCGA-CM-4746-01 | Colorectum | colon adenocarcinoma | Male | <65 | I/II | Unknown | Unknown | SD | |
| AFG3L2 | SNV | Missense_Mutation | rs863223889 | c.1012N>A | p.Ala338Thr | p.A338T | Q9Y4W6 | protein_coding | deleterious(0) | probably_damaging(0.999) | TCGA-WS-AB45-01 | Colorectum | colon adenocarcinoma | Female | <65 | I/II | Unknown | Unknown | SD |
| AFG3L2 | SNV | Missense_Mutation | novel | c.2214N>T | p.Lys738Asn | p.K738N | Q9Y4W6 | protein_coding | deleterious(0) | probably_damaging(0.969) | TCGA-F5-6814-01 | Colorectum | rectum adenocarcinoma | Male | <65 | I/II | Unknown | Unknown | SD |
| AFG3L2 | SNV | Missense_Mutation | novel | c.1364N>A | p.Arg455Gln | p.R455Q | Q9Y4W6 | protein_coding | deleterious(0) | probably_damaging(1) | TCGA-F5-6814-01 | Colorectum | rectum adenocarcinoma | Male | <65 | I/II | Unknown | Unknown | SD |
| Page: 1 2 3 4 5 6 7 |
Top |
Related drugs of malignant transformation related genes |
| Identification of chemicals and drugs interact with genes involved in malignant transfromation |
| (DGIdb 4.0) |
| Entrez ID | Symbol | Category | Interaction Types | Drug Claim Name | Drug Name | PMIDs |
| Page: 1 |

Copyright 2023-Present -The University of Texas Health Science Center at Houston |