
|
|||||
|
 | |
| |
| |
| |
| |
| |
|
Gene: AFF3 |
Gene summary for AFF3 |
| Gene information | Species | Human | Gene symbol | AFF3 | Gene ID | 3899 |
| Gene name | AF4/FMR2 family member 3 | |
| Gene Alias | KINS | |
| Cytomap | 2q11.2 | |
| Gene Type | protein-coding | GO ID | GO:0006139 | UniProtAcc | P51826 |
Top |
Malignant transformation analysis |
| Identification of the aberrant gene expression in precancerous and cancerous lesions by comparing the gene expression of stem-like cells in diseased tissues with normal stem cells |
| Entrez ID | Symbol | Replicates | Species | Organ | Tissue | Adj P-value | Log2FC | Malignancy |
| 3899 | AFF3 | GSM4909282 | Human | Breast | IDC | 3.57e-02 | -1.81e-01 | -0.0288 |
| 3899 | AFF3 | GSM4909285 | Human | Breast | IDC | 2.34e-02 | -1.82e-01 | 0.21 |
| 3899 | AFF3 | GSM4909286 | Human | Breast | IDC | 3.51e-04 | -1.87e-01 | 0.1081 |
| 3899 | AFF3 | GSM4909293 | Human | Breast | IDC | 9.24e-07 | 1.17e-01 | 0.1581 |
| 3899 | AFF3 | GSM4909298 | Human | Breast | IDC | 3.00e-05 | 6.14e-02 | 0.1551 |
| 3899 | AFF3 | GSM4909303 | Human | Breast | IDC | 9.87e-10 | 6.11e-01 | 0.0438 |
| 3899 | AFF3 | GSM4909304 | Human | Breast | IDC | 5.81e-20 | 4.73e-01 | 0.1636 |
| 3899 | AFF3 | GSM4909306 | Human | Breast | IDC | 1.50e-07 | 2.93e-01 | 0.1564 |
| 3899 | AFF3 | GSM4909308 | Human | Breast | IDC | 1.73e-14 | 3.00e-01 | 0.158 |
| 3899 | AFF3 | GSM4909311 | Human | Breast | IDC | 2.38e-03 | -1.15e-01 | 0.1534 |
| 3899 | AFF3 | GSM4909315 | Human | Breast | IDC | 3.51e-04 | -1.84e-01 | 0.21 |
| 3899 | AFF3 | GSM4909319 | Human | Breast | IDC | 3.20e-05 | -1.16e-01 | 0.1563 |
| 3899 | AFF3 | brca1 | Human | Breast | Precancer | 4.74e-03 | -1.84e-01 | -0.0338 |
| 3899 | AFF3 | M5 | Human | Breast | IDC | 9.17e-14 | 9.44e-01 | 0.1598 |
| 3899 | AFF3 | P3 | Human | Breast | IDC | 4.27e-11 | 7.57e-01 | 0.1542 |
| 3899 | AFF3 | AEH-subject3 | Human | Endometrium | AEH | 1.61e-14 | 4.93e-01 | -0.2576 |
| 3899 | AFF3 | AEH-subject4 | Human | Endometrium | AEH | 3.03e-15 | 5.97e-01 | -0.2657 |
| 3899 | AFF3 | AEH-subject5 | Human | Endometrium | AEH | 1.83e-28 | 8.64e-01 | -0.2953 |
| 3899 | AFF3 | EEC-subject1 | Human | Endometrium | EEC | 2.31e-04 | 2.31e-01 | -0.2682 |
| 3899 | AFF3 | EEC-subject3 | Human | Endometrium | EEC | 2.65e-02 | -2.24e-03 | -0.2525 |
| Page: 1 2 3 |
| Tissue | Expression Dynamics | Abbreviation |
| Breast | 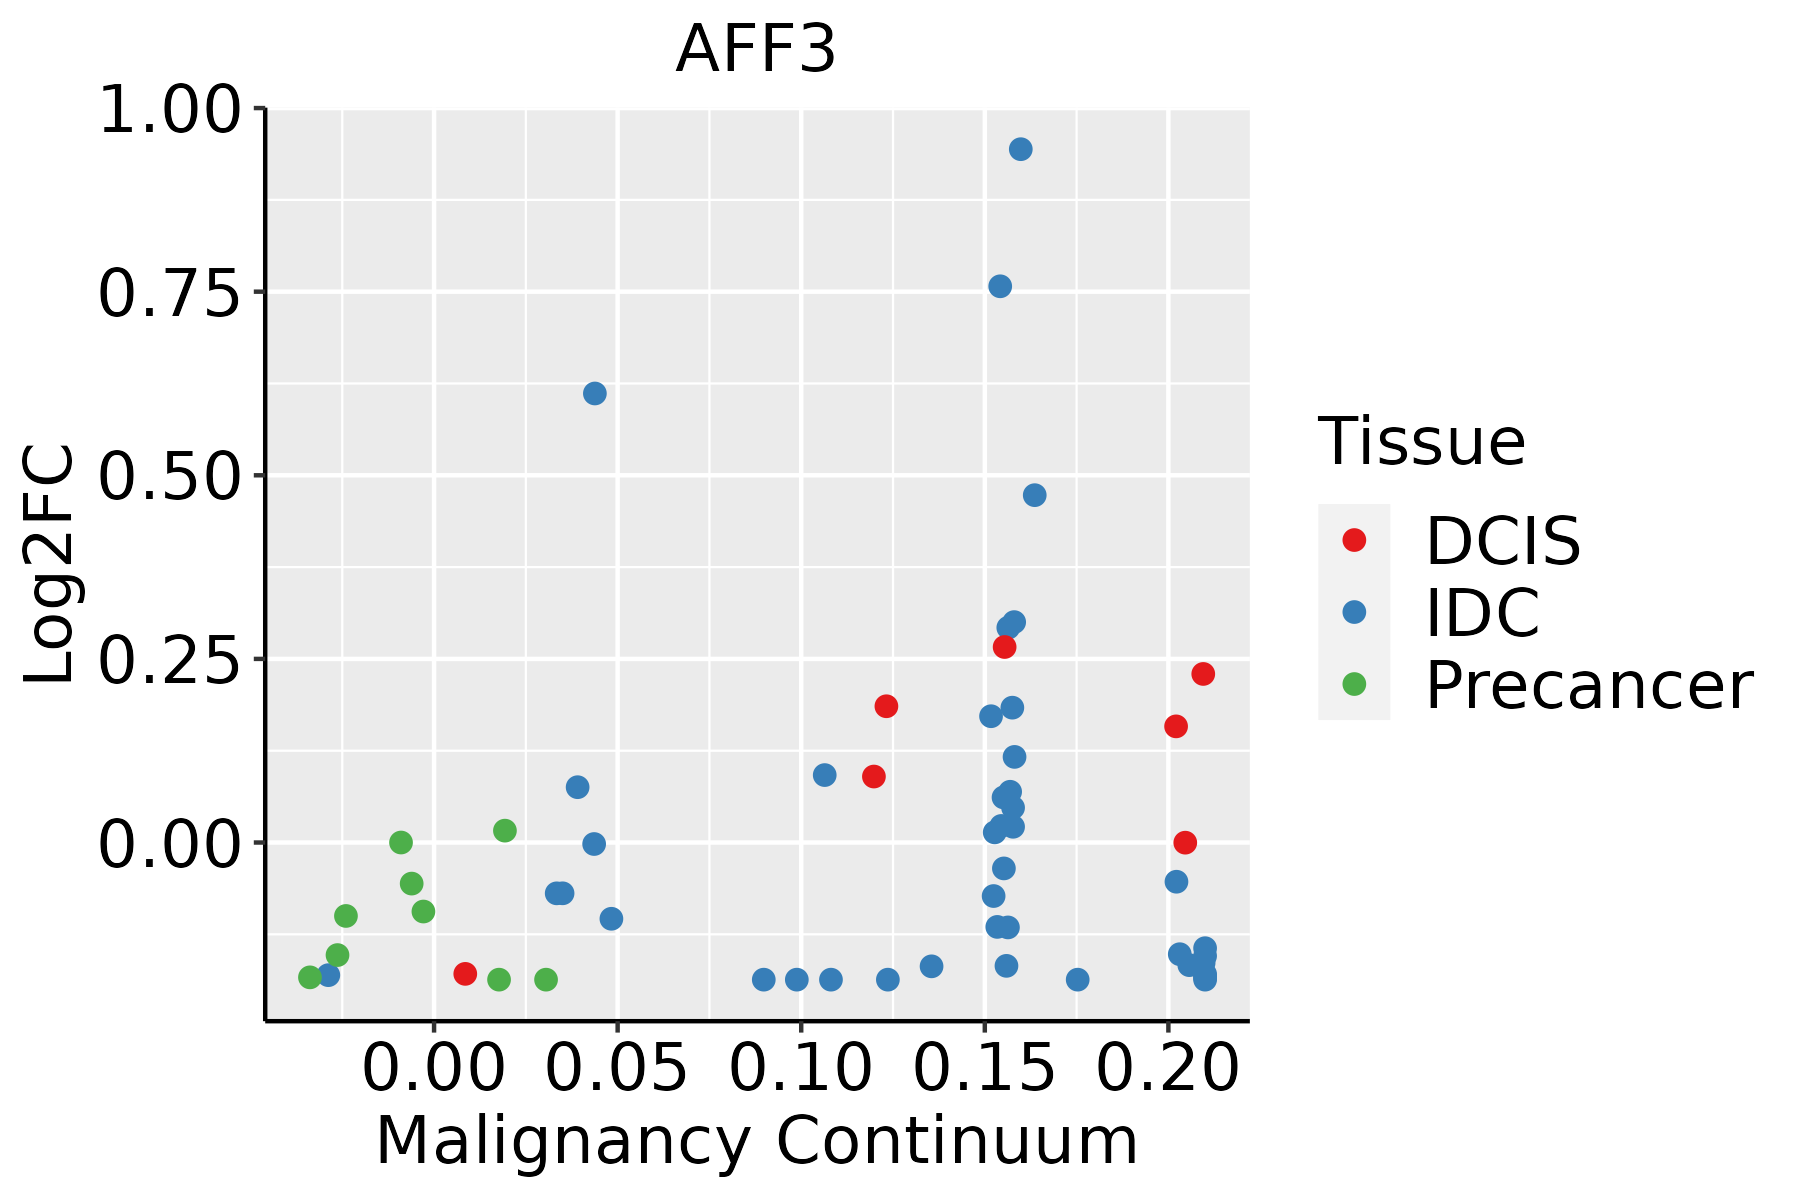 | IDC: Invasive ductal carcinoma |
| DCIS: Ductal carcinoma in situ | ||
| Precancer(BRCA1-mut): Precancerous lesion from BRCA1 mutation carriers | ||
| Endometrium | 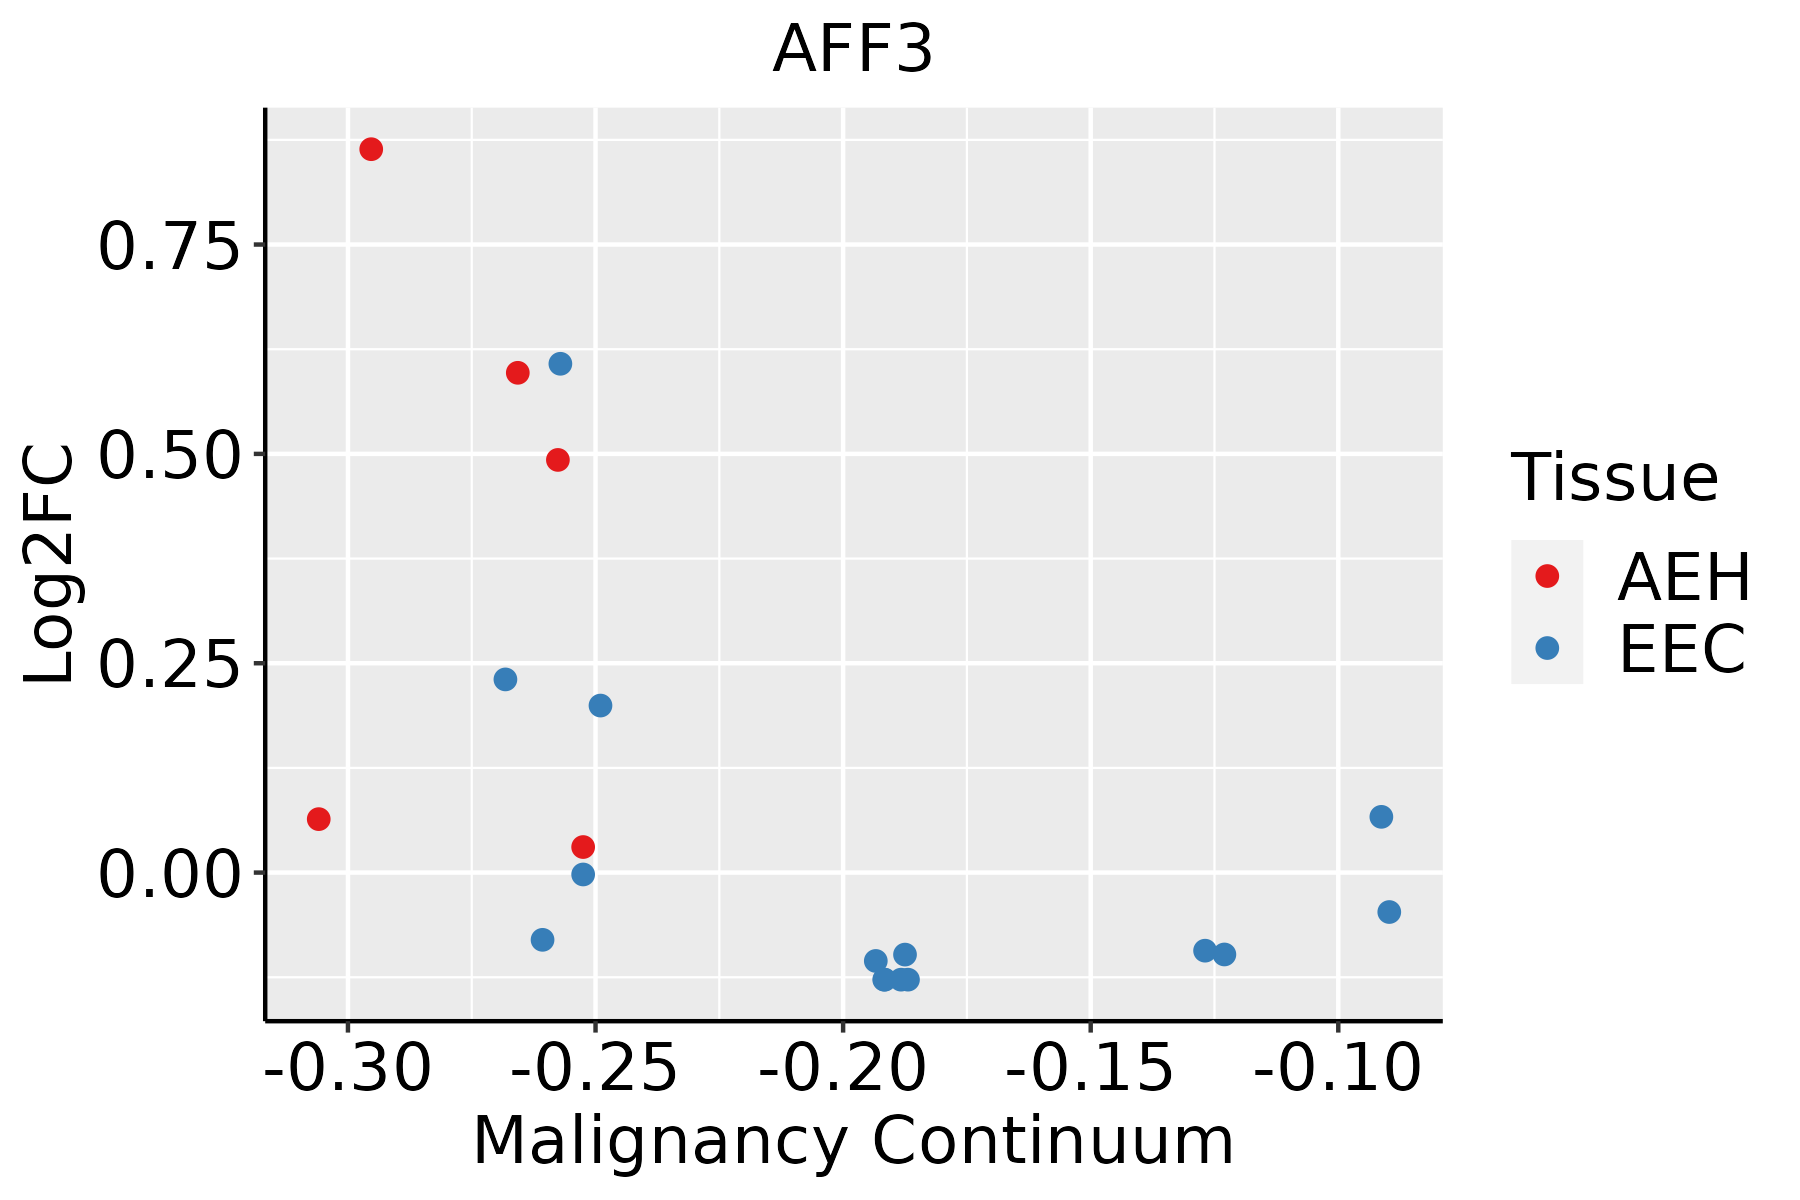 | AEH: Atypical endometrial hyperplasia |
| EEC: Endometrioid Cancer | ||
| Liver |  | HCC: Hepatocellular carcinoma |
| NAFLD: Non-alcoholic fatty liver disease | ||
| Lung | 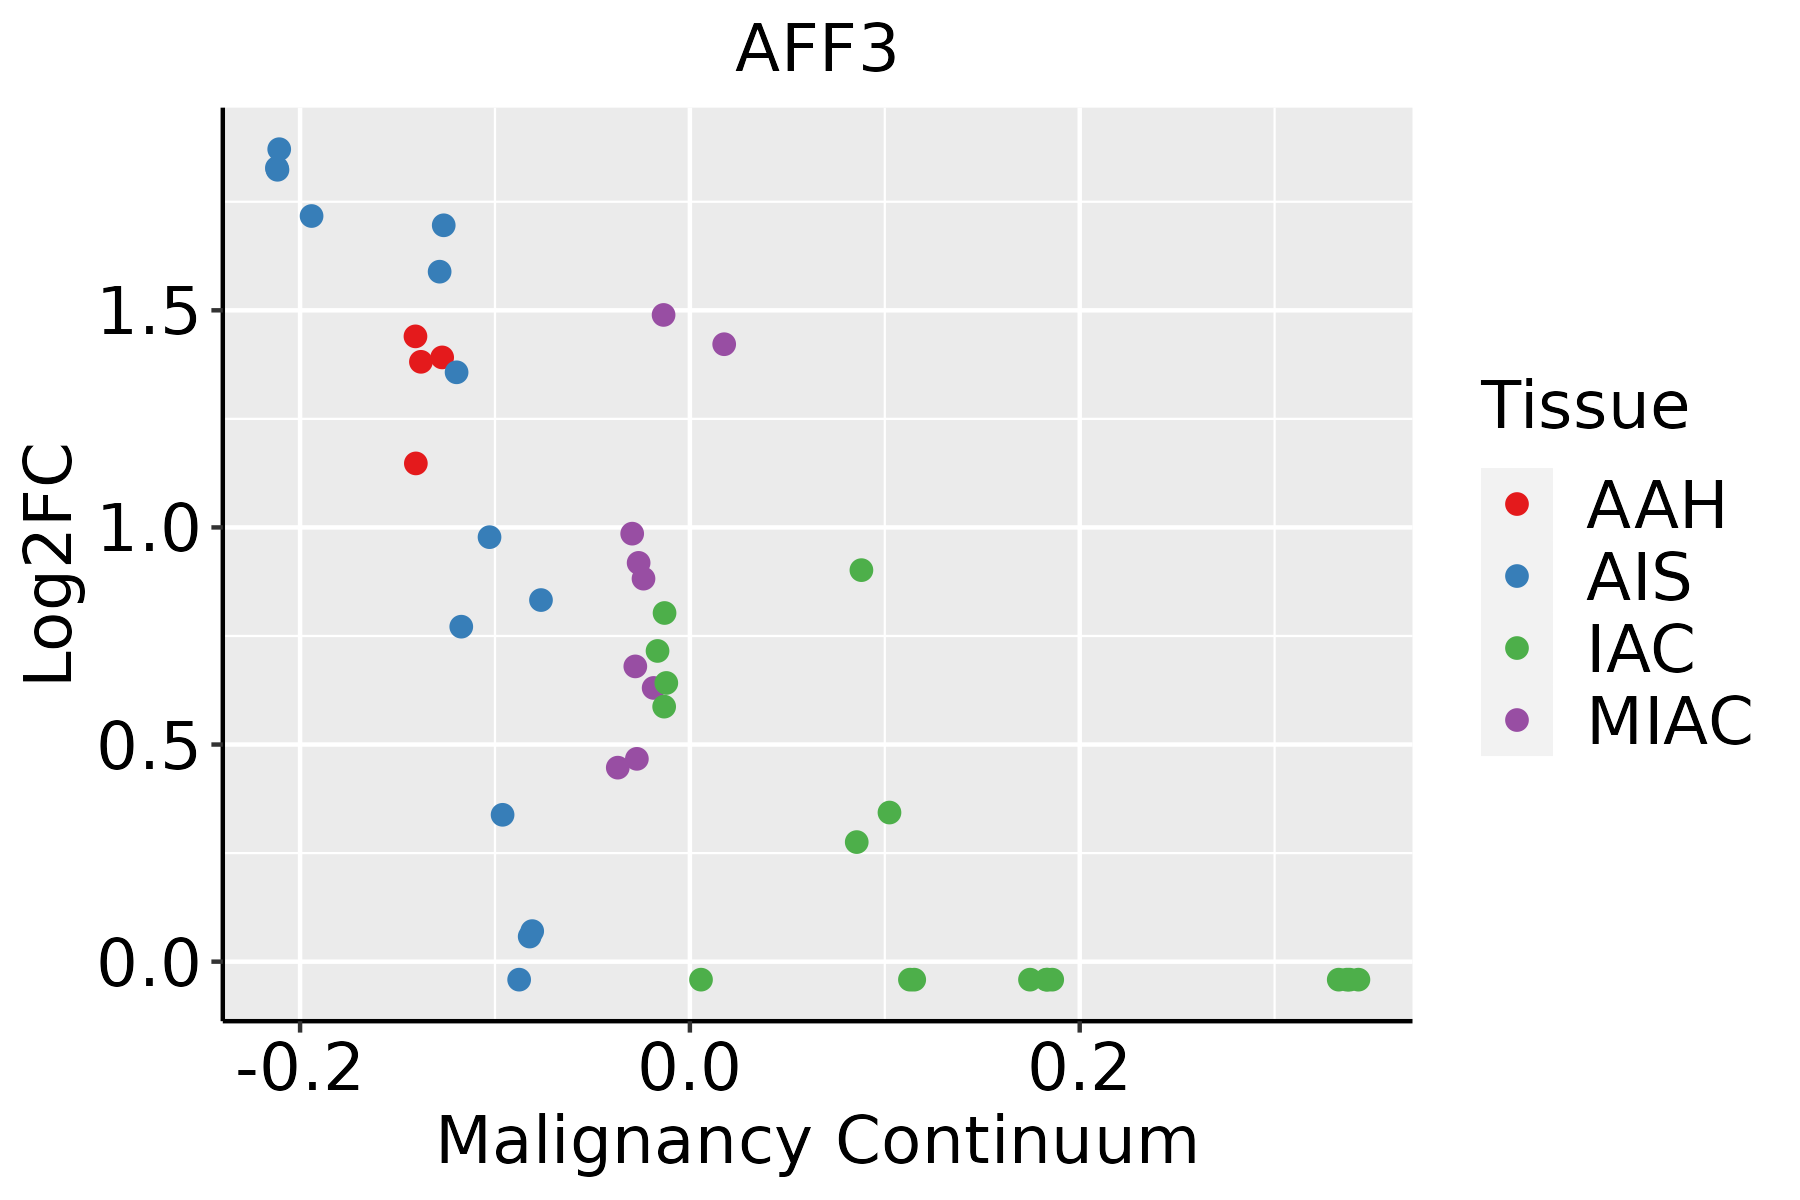 | AAH: Atypical adenomatous hyperplasia |
| AIS: Adenocarcinoma in situ | ||
| IAC: Invasive lung adenocarcinoma | ||
| MIA: Minimally invasive adenocarcinoma | ||
| Prostate | 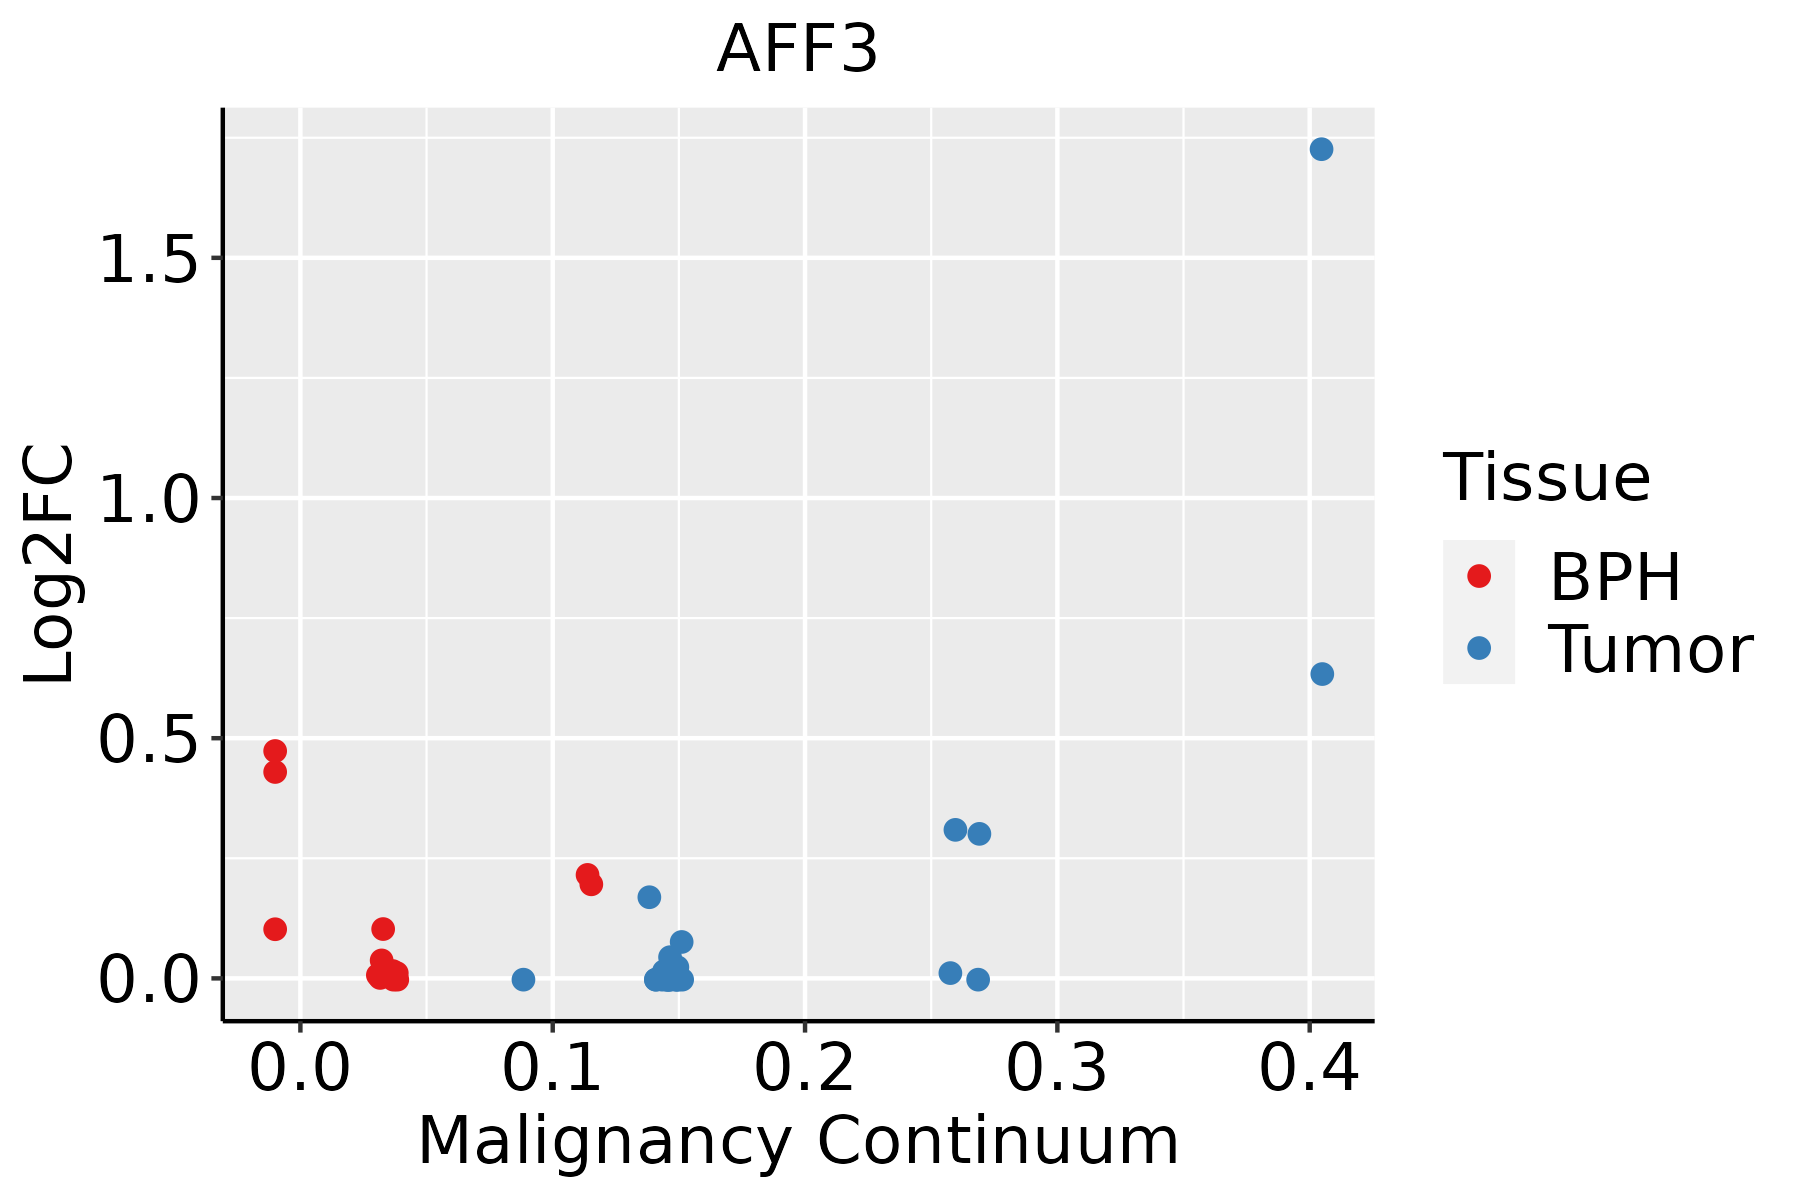 | BPH: Benign Prostatic Hyperplasia |
| Thyroid |  | ATC: Anaplastic thyroid cancer |
| HT: Hashimoto's thyroiditis | ||
| PTC: Papillary thyroid cancer |
| ∗log2FC in expression of this searched gene in stem-like cells from each diseased tissue sample relative to stem-like cells in normal samples in each tissue plotted against the malignancy continuum. Samples are colored based on if they are from different disease stage. |
Top |
Malignant transformation related pathway analysis |
| Find out the enriched GO biological processes and KEGG pathways involved in transition from healthy to precancer to cancer |
| Tissue | Disease Stage | Enriched GO biological Processes |
| Colorectum | AD |  |
| Colorectum | SER |  |
| Colorectum | MSS |  |
| Colorectum | MSI-H |  |
| Colorectum | FAP |  |
| ∗Top 15 enriched GO BP terms are showed in the bar plot of each disease state in each tissue. Each row represents a significant GO biological process which is colored according to the -log10(p.adjust). |
| Page: 1 2 3 4 5 6 7 8 9 |
| GO ID | Tissue | Disease Stage | Description | Gene Ratio | Bg Ratio | pvalue | p.adjust | Count |
| GO:00346128 | Breast | Precancer | response to tumor necrosis factor | 29/1080 | 253/18723 | 3.32e-04 | 4.70e-03 | 29 |
| GO:003461213 | Breast | IDC | response to tumor necrosis factor | 36/1434 | 253/18723 | 2.29e-04 | 3.64e-03 | 36 |
| GO:00351073 | Endometrium | AEH | appendage morphogenesis | 29/2100 | 138/18723 | 6.06e-04 | 5.94e-03 | 29 |
| GO:00351083 | Endometrium | AEH | limb morphogenesis | 29/2100 | 138/18723 | 6.06e-04 | 5.94e-03 | 29 |
| GO:00487366 | Endometrium | AEH | appendage development | 33/2100 | 172/18723 | 1.41e-03 | 1.18e-02 | 33 |
| GO:00601736 | Endometrium | AEH | limb development | 33/2100 | 172/18723 | 1.41e-03 | 1.18e-02 | 33 |
| GO:003461210 | Endometrium | AEH | response to tumor necrosis factor | 44/2100 | 253/18723 | 2.08e-03 | 1.61e-02 | 44 |
| GO:0030326 | Endometrium | AEH | embryonic limb morphogenesis | 23/2100 | 116/18723 | 4.58e-03 | 2.95e-02 | 23 |
| GO:0035113 | Endometrium | AEH | embryonic appendage morphogenesis | 23/2100 | 116/18723 | 4.58e-03 | 2.95e-02 | 23 |
| GO:003461215 | Endometrium | EEC | response to tumor necrosis factor | 48/2168 | 253/18723 | 3.77e-04 | 4.03e-03 | 48 |
| GO:003510711 | Endometrium | EEC | appendage morphogenesis | 29/2168 | 138/18723 | 1.01e-03 | 8.89e-03 | 29 |
| GO:003510811 | Endometrium | EEC | limb morphogenesis | 29/2168 | 138/18723 | 1.01e-03 | 8.89e-03 | 29 |
| GO:004873611 | Endometrium | EEC | appendage development | 33/2168 | 172/18723 | 2.38e-03 | 1.75e-02 | 33 |
| GO:006017311 | Endometrium | EEC | limb development | 33/2168 | 172/18723 | 2.38e-03 | 1.75e-02 | 33 |
| GO:00303261 | Endometrium | EEC | embryonic limb morphogenesis | 23/2168 | 116/18723 | 6.73e-03 | 3.93e-02 | 23 |
| GO:00351131 | Endometrium | EEC | embryonic appendage morphogenesis | 23/2168 | 116/18723 | 6.73e-03 | 3.93e-02 | 23 |
| GO:003461211 | Liver | HCC | response to tumor necrosis factor | 132/7958 | 253/18723 | 1.14e-03 | 6.48e-03 | 132 |
| GO:00346127 | Lung | IAC | response to tumor necrosis factor | 46/2061 | 253/18723 | 4.28e-04 | 6.37e-03 | 46 |
| GO:003461212 | Lung | AIS | response to tumor necrosis factor | 39/1849 | 253/18723 | 3.40e-03 | 3.23e-02 | 39 |
| GO:003461216 | Prostate | BPH | response to tumor necrosis factor | 68/3107 | 253/18723 | 2.22e-05 | 2.67e-04 | 68 |
| Page: 1 2 |
| Pathway ID | Tissue | Disease Stage | Description | Gene Ratio | Bg Ratio | pvalue | p.adjust | qvalue | Count |
| Page: 1 |
Top |
Cell-cell communication analysis |
| Identification of potential cell-cell interactions between two cell types and their ligand-receptor pairs for different disease states |
| Ligand | Receptor | LRpair | Pathway | Tissue | Disease Stage |
| Page: 1 |
Top |
Single-cell gene regulatory network inference analysis |
| Find out the significant the regulons (TFs) and the target genes of each regulon across cell types for different disease states |
| TF | Cell Type | Tissue | Disease Stage | Target Gene | RSS | Regulon Activity |
| ∗The dot plots of a searched regulon are shown for all cell subpopulations in each disease state of each tissue based on the regulon specific score inferred using pySCENIC and by calculating the average expression. |
| Page: 1 |
Top |
Somatic mutation of malignant transformation related genes |
| Annotation of somatic variants for genes involved in malignant transformation |
| Hugo Symbol | Variant Class | Variant Classification | dbSNP RS | HGVSc | HGVSp | HGVSp Short | SWISSPROT | BIOTYPE | SIFT | PolyPhen | Tumor Sample Barcode | Tissue | Histology | Sex | Age | Stage | Therapy Types | Drugs | Outcome |
| AFF3 | SNV | Missense_Mutation | c.2344N>G | p.Leu782Val | p.L782V | P51826 | protein_coding | deleterious(0) | possibly_damaging(0.815) | TCGA-A2-A0EY-01 | Breast | breast invasive carcinoma | Female | <65 | I/II | Chemotherapy | adriamycin | SD | |
| AFF3 | SNV | Missense_Mutation | rs780730596 | c.278N>A | p.Arg93Gln | p.R93Q | P51826 | protein_coding | deleterious(0) | probably_damaging(1) | TCGA-A8-A07P-01 | Breast | breast invasive carcinoma | Female | >=65 | I/II | Chemotherapy | 5-fluorouracil | SD |
| AFF3 | SNV | Missense_Mutation | novel | c.2367N>T | p.Arg789Ser | p.R789S | P51826 | protein_coding | deleterious(0.01) | benign(0.287) | TCGA-AC-A62Y-01 | Breast | breast invasive carcinoma | Female | >=65 | I/II | Unknown | Unknown | SD |
| AFF3 | SNV | Missense_Mutation | c.1516N>A | p.Pro506Thr | p.P506T | P51826 | protein_coding | tolerated(0.6) | benign(0.139) | TCGA-AN-A0FL-01 | Breast | breast invasive carcinoma | Female | <65 | I/II | Unknown | Unknown | SD | |
| AFF3 | SNV | Missense_Mutation | c.2428G>C | p.Glu810Gln | p.E810Q | P51826 | protein_coding | deleterious(0.04) | possibly_damaging(0.812) | TCGA-AN-A0XW-01 | Breast | breast invasive carcinoma | Female | <65 | III/IV | Unknown | Unknown | SD | |
| AFF3 | SNV | Missense_Mutation | c.3506N>T | p.Pro1169Leu | p.P1169L | P51826 | protein_coding | deleterious(0) | benign(0.082) | TCGA-AO-A1KP-01 | Breast | breast invasive carcinoma | Female | >=65 | I/II | Chemotherapy | fluorouracil | SD | |
| AFF3 | SNV | Missense_Mutation | c.787N>G | p.Met263Val | p.M263V | P51826 | protein_coding | deleterious(0) | probably_damaging(0.915) | TCGA-BH-A0GY-01 | Breast | breast invasive carcinoma | Female | >=65 | I/II | Chemotherapy | cyotxan | SD | |
| AFF3 | SNV | Missense_Mutation | c.234N>A | p.Phe78Leu | p.F78L | P51826 | protein_coding | deleterious(0) | probably_damaging(0.999) | TCGA-BH-A0HP-01 | Breast | breast invasive carcinoma | Female | >=65 | III/IV | Chemotherapy | doxorubicin | SD | |
| AFF3 | SNV | Missense_Mutation | c.920N>G | p.Ser307Cys | p.S307C | P51826 | protein_coding | deleterious(0.03) | possibly_damaging(0.754) | TCGA-C8-A26Y-01 | Breast | breast invasive carcinoma | Female | >=65 | I/II | Unknown | Unknown | SD | |
| AFF3 | SNV | Missense_Mutation | c.3625N>A | p.Glu1209Lys | p.E1209K | P51826 | protein_coding | deleterious(0) | probably_damaging(0.936) | TCGA-D8-A1JA-01 | Breast | breast invasive carcinoma | Female | <65 | III/IV | Chemotherapy | adriamycin | PD |
| Page: 1 2 3 4 5 6 7 8 9 10 11 12 13 14 15 16 17 18 19 20 |
Top |
Related drugs of malignant transformation related genes |
| Identification of chemicals and drugs interact with genes involved in malignant transfromation |
| (DGIdb 4.0) |
| Entrez ID | Symbol | Category | Interaction Types | Drug Claim Name | Drug Name | PMIDs |
| Page: 1 |

Copyright 2023-Present -The University of Texas Health Science Center at Houston |