
|
|||||
|
 | |
| |
| |
| |
| |
| |
|
Gene: AFF1 |
Gene summary for AFF1 |
| Gene information | Species | Human | Gene symbol | AFF1 | Gene ID | 4299 |
| Gene name | AF4/FMR2 family member 1 | |
| Gene Alias | AF4 | |
| Cytomap | 4q21.3-q22.1 | |
| Gene Type | protein-coding | GO ID | GO:0008150 | UniProtAcc | P51825 |
Top |
Malignant transformation analysis |
| Identification of the aberrant gene expression in precancerous and cancerous lesions by comparing the gene expression of stem-like cells in diseased tissues with normal stem cells |
| Entrez ID | Symbol | Replicates | Species | Organ | Tissue | Adj P-value | Log2FC | Malignancy |
| 4299 | AFF1 | CCI_1 | Human | Cervix | CC | 2.87e-15 | 1.32e+00 | 0.528 |
| 4299 | AFF1 | CCI_2 | Human | Cervix | CC | 6.67e-14 | 1.38e+00 | 0.5249 |
| 4299 | AFF1 | CCI_3 | Human | Cervix | CC | 1.26e-22 | 1.29e+00 | 0.516 |
| 4299 | AFF1 | HTA11_3410_2000001011 | Human | Colorectum | AD | 5.14e-10 | -3.61e-01 | 0.0155 |
| 4299 | AFF1 | HTA11_2951_2000001011 | Human | Colorectum | AD | 3.61e-04 | -7.08e-01 | 0.0216 |
| 4299 | AFF1 | HTA11_347_2000001011 | Human | Colorectum | AD | 1.09e-16 | 7.58e-01 | -0.1954 |
| 4299 | AFF1 | HTA11_411_2000001011 | Human | Colorectum | SER | 5.19e-04 | 7.66e-01 | -0.2602 |
| 4299 | AFF1 | HTA11_866_3004761011 | Human | Colorectum | AD | 1.47e-02 | -3.63e-01 | 0.096 |
| 4299 | AFF1 | HTA11_9408_2000001011 | Human | Colorectum | AD | 1.80e-02 | -3.56e-01 | 0.0451 |
| 4299 | AFF1 | HTA11_99999973899_84307 | Human | Colorectum | MSS | 6.59e-08 | -6.27e-01 | 0.2585 |
| 4299 | AFF1 | HTA11_99999974143_84620 | Human | Colorectum | MSS | 4.52e-32 | -7.54e-01 | 0.3005 |
| 4299 | AFF1 | F007 | Human | Colorectum | FAP | 5.72e-06 | -4.52e-01 | 0.1176 |
| 4299 | AFF1 | A001-C-207 | Human | Colorectum | FAP | 2.80e-04 | -2.64e-01 | 0.1278 |
| 4299 | AFF1 | A015-C-203 | Human | Colorectum | FAP | 7.16e-40 | -5.78e-01 | -0.1294 |
| 4299 | AFF1 | A015-C-204 | Human | Colorectum | FAP | 1.98e-09 | -4.46e-01 | -0.0228 |
| 4299 | AFF1 | A014-C-040 | Human | Colorectum | FAP | 1.92e-06 | -4.29e-01 | -0.1184 |
| 4299 | AFF1 | A002-C-201 | Human | Colorectum | FAP | 4.83e-20 | -5.03e-01 | 0.0324 |
| 4299 | AFF1 | A002-C-203 | Human | Colorectum | FAP | 1.35e-04 | -1.22e-01 | 0.2786 |
| 4299 | AFF1 | A001-C-119 | Human | Colorectum | FAP | 1.69e-10 | -4.36e-01 | -0.1557 |
| 4299 | AFF1 | A001-C-108 | Human | Colorectum | FAP | 9.50e-19 | -3.43e-01 | -0.0272 |
| Page: 1 2 3 4 5 6 7 8 9 |
| Tissue | Expression Dynamics | Abbreviation |
| Cervix |  | CC: Cervix cancer |
| HSIL_HPV: HPV-infected high-grade squamous intraepithelial lesions | ||
| N_HPV: HPV-infected normal cervix | ||
| Colorectum (GSE201348) |  | FAP: Familial adenomatous polyposis |
| CRC: Colorectal cancer | ||
| Colorectum (HTA11) |  | AD: Adenomas |
| SER: Sessile serrated lesions | ||
| MSI-H: Microsatellite-high colorectal cancer | ||
| MSS: Microsatellite stable colorectal cancer | ||
| Endometrium |  | AEH: Atypical endometrial hyperplasia |
| EEC: Endometrioid Cancer | ||
| Esophagus | 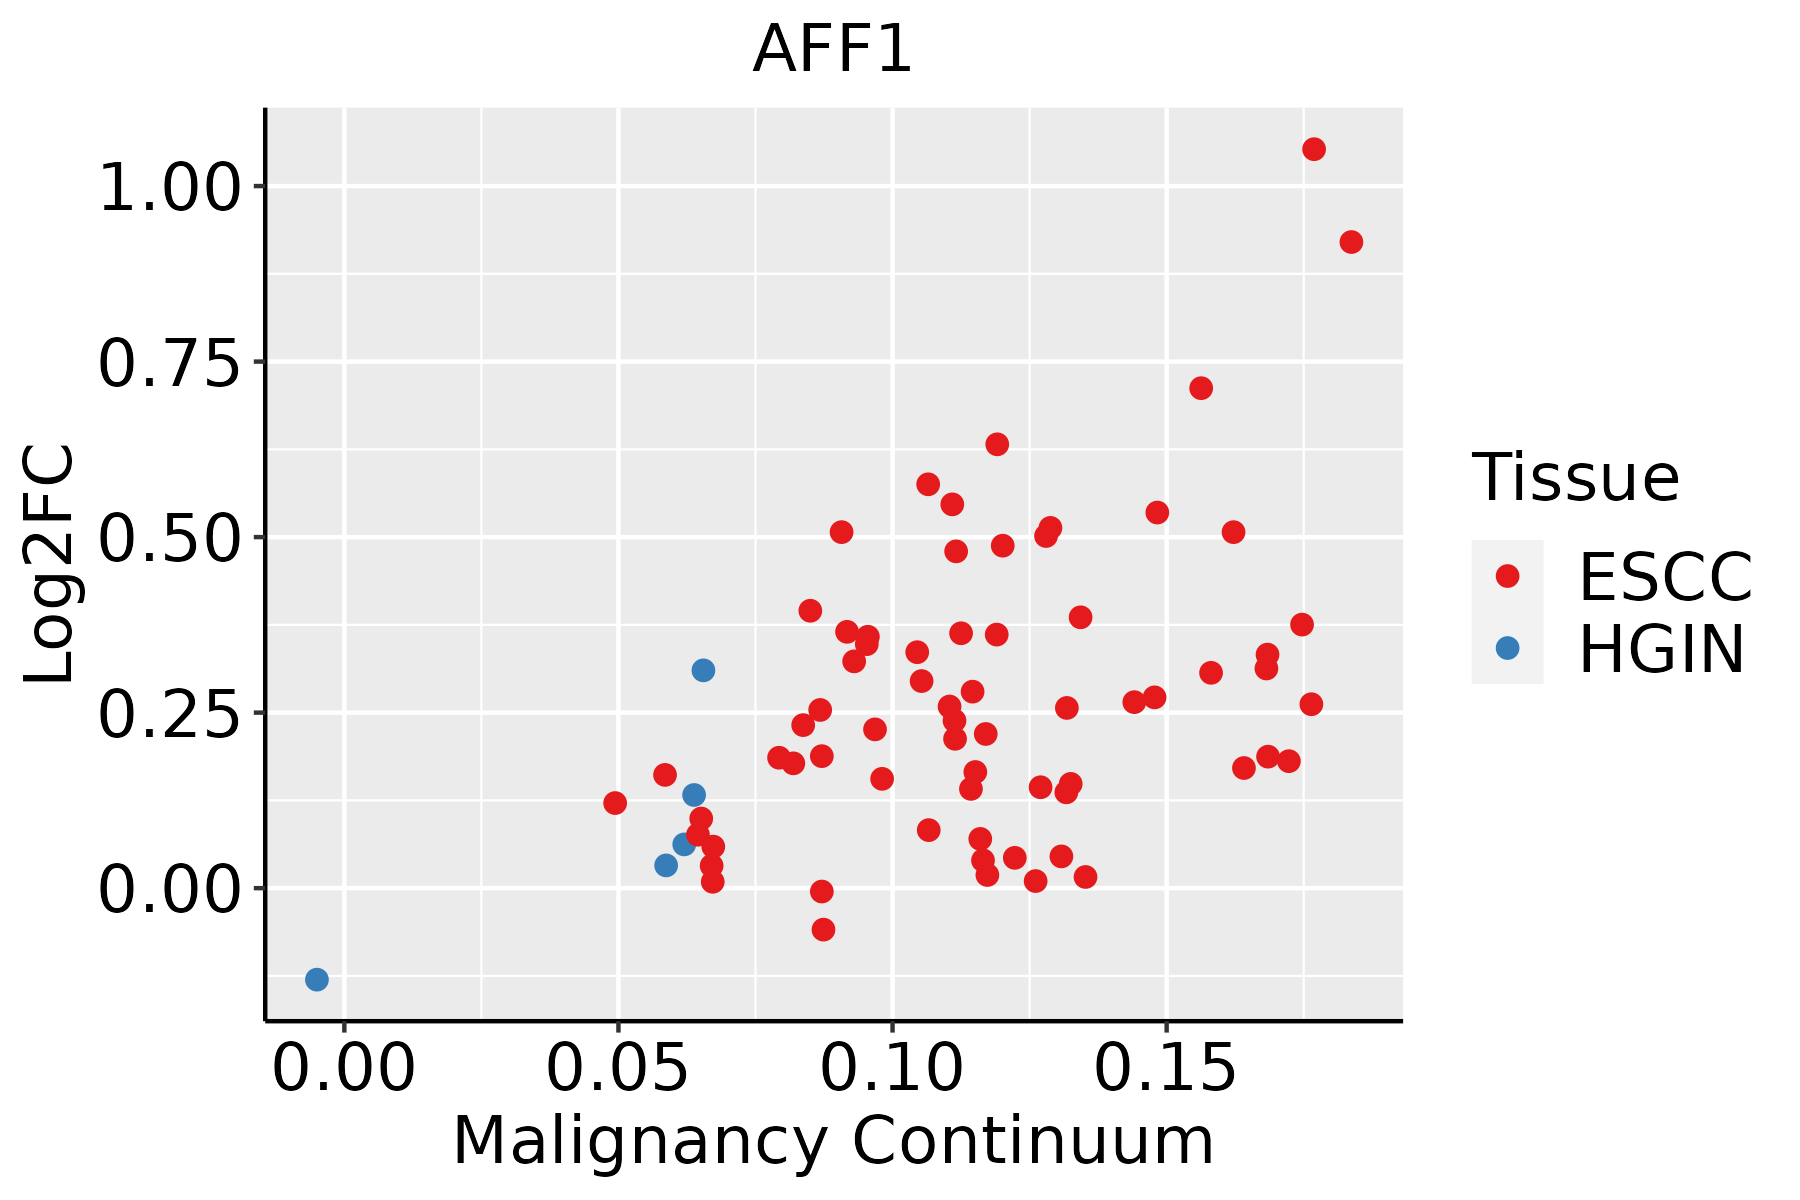 | ESCC: Esophageal squamous cell carcinoma |
| HGIN: High-grade intraepithelial neoplasias | ||
| LGIN: Low-grade intraepithelial neoplasias | ||
| Liver |  | HCC: Hepatocellular carcinoma |
| NAFLD: Non-alcoholic fatty liver disease | ||
| Lung |  | AAH: Atypical adenomatous hyperplasia |
| AIS: Adenocarcinoma in situ | ||
| IAC: Invasive lung adenocarcinoma | ||
| MIA: Minimally invasive adenocarcinoma | ||
| Prostate |  | BPH: Benign Prostatic Hyperplasia |
| Skin | 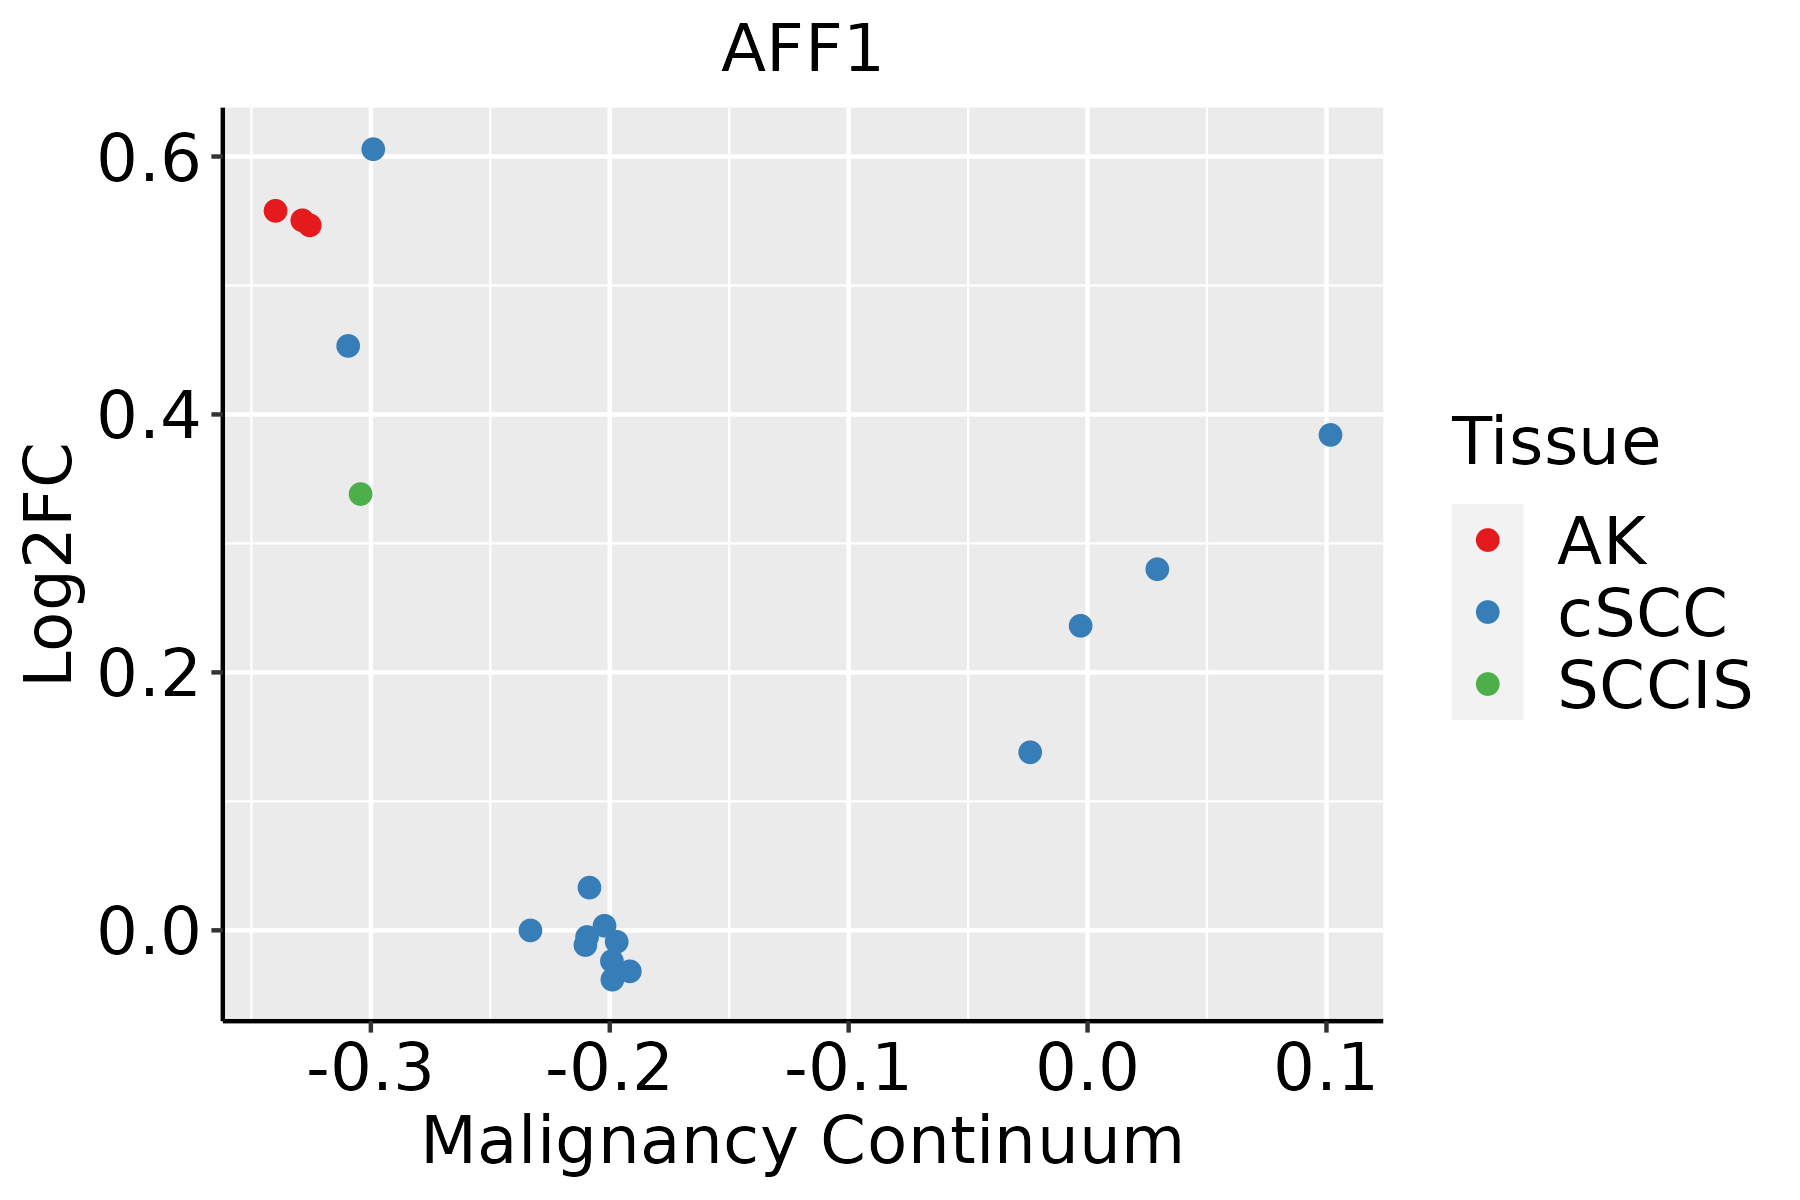 | AK: Actinic keratosis |
| cSCC: Cutaneous squamous cell carcinoma | ||
| SCCIS:squamous cell carcinoma in situ | ||
| Thyroid | 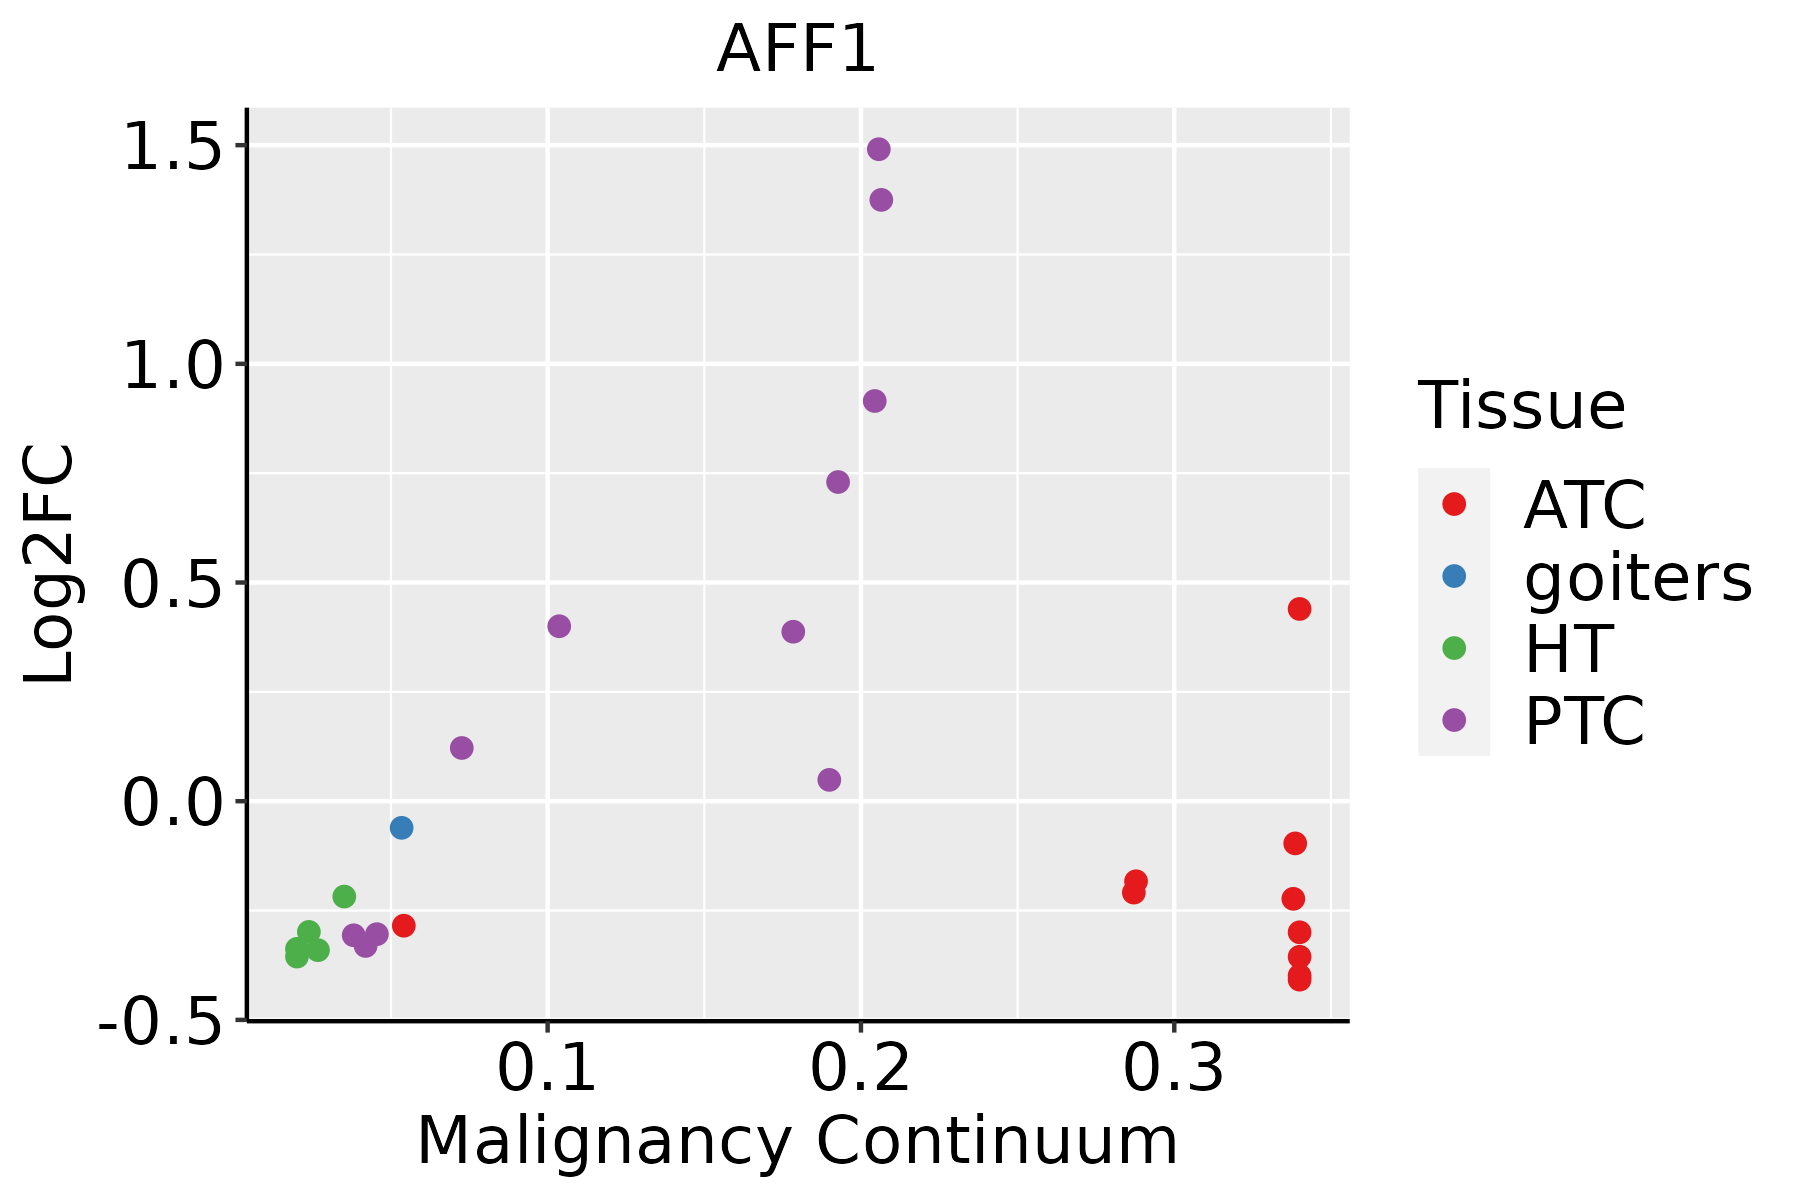 | ATC: Anaplastic thyroid cancer |
| HT: Hashimoto's thyroiditis | ||
| PTC: Papillary thyroid cancer |
| ∗log2FC in expression of this searched gene in stem-like cells from each diseased tissue sample relative to stem-like cells in normal samples in each tissue plotted against the malignancy continuum. Samples are colored based on if they are from different disease stage. |
Top |
Malignant transformation related pathway analysis |
| Find out the enriched GO biological processes and KEGG pathways involved in transition from healthy to precancer to cancer |
| Tissue | Disease Stage | Enriched GO biological Processes |
| Colorectum | AD |  |
| Colorectum | SER |  |
| Colorectum | MSS |  |
| Colorectum | MSI-H |  |
| Colorectum | FAP |  |
| ∗Top 15 enriched GO BP terms are showed in the bar plot of each disease state in each tissue. Each row represents a significant GO biological process which is colored according to the -log10(p.adjust). |
| Page: 1 2 3 4 5 6 7 8 9 |
| GO ID | Tissue | Disease Stage | Description | Gene Ratio | Bg Ratio | pvalue | p.adjust | Count |
| Page: 1 |
| Pathway ID | Tissue | Disease Stage | Description | Gene Ratio | Bg Ratio | pvalue | p.adjust | qvalue | Count |
| hsa052028 | Esophagus | ESCC | Transcriptional misregulation in cancer | 116/4205 | 193/8465 | 2.08e-03 | 5.95e-03 | 3.05e-03 | 116 |
| hsa0520213 | Esophagus | ESCC | Transcriptional misregulation in cancer | 116/4205 | 193/8465 | 2.08e-03 | 5.95e-03 | 3.05e-03 | 116 |
| hsa052026 | Lung | IAC | Transcriptional misregulation in cancer | 40/1053 | 193/8465 | 6.90e-04 | 5.90e-03 | 3.92e-03 | 40 |
| hsa0520211 | Lung | IAC | Transcriptional misregulation in cancer | 40/1053 | 193/8465 | 6.90e-04 | 5.90e-03 | 3.92e-03 | 40 |
| hsa052022 | Lung | AIS | Transcriptional misregulation in cancer | 39/961 | 193/8465 | 2.15e-04 | 2.41e-03 | 1.54e-03 | 39 |
| hsa052023 | Lung | AIS | Transcriptional misregulation in cancer | 39/961 | 193/8465 | 2.15e-04 | 2.41e-03 | 1.54e-03 | 39 |
| hsa052027 | Prostate | BPH | Transcriptional misregulation in cancer | 53/1718 | 193/8465 | 9.56e-03 | 2.92e-02 | 1.81e-02 | 53 |
| hsa0520212 | Prostate | BPH | Transcriptional misregulation in cancer | 53/1718 | 193/8465 | 9.56e-03 | 2.92e-02 | 1.81e-02 | 53 |
| hsa0520221 | Prostate | Tumor | Transcriptional misregulation in cancer | 59/1791 | 193/8465 | 1.22e-03 | 5.26e-03 | 3.26e-03 | 59 |
| hsa0520231 | Prostate | Tumor | Transcriptional misregulation in cancer | 59/1791 | 193/8465 | 1.22e-03 | 5.26e-03 | 3.26e-03 | 59 |
| Page: 1 |
Top |
Cell-cell communication analysis |
| Identification of potential cell-cell interactions between two cell types and their ligand-receptor pairs for different disease states |
| Ligand | Receptor | LRpair | Pathway | Tissue | Disease Stage |
| Page: 1 |
Top |
Single-cell gene regulatory network inference analysis |
| Find out the significant the regulons (TFs) and the target genes of each regulon across cell types for different disease states |
| TF | Cell Type | Tissue | Disease Stage | Target Gene | RSS | Regulon Activity |
| ∗The dot plots of a searched regulon are shown for all cell subpopulations in each disease state of each tissue based on the regulon specific score inferred using pySCENIC and by calculating the average expression. |
| Page: 1 |
Top |
Somatic mutation of malignant transformation related genes |
| Annotation of somatic variants for genes involved in malignant transformation |
| Hugo Symbol | Variant Class | Variant Classification | dbSNP RS | HGVSc | HGVSp | HGVSp Short | SWISSPROT | BIOTYPE | SIFT | PolyPhen | Tumor Sample Barcode | Tissue | Histology | Sex | Age | Stage | Therapy Types | Drugs | Outcome |
| AFF1 | SNV | Missense_Mutation | novel | c.1932N>C | p.Gln644His | p.Q644H | P51825 | protein_coding | deleterious(0.03) | probably_damaging(0.964) | TCGA-5L-AAT1-01 | Breast | breast invasive carcinoma | Female | <65 | III/IV | Hormone Therapy | letrozol | SD |
| AFF1 | SNV | Missense_Mutation | rs754441802 | c.3179G>A | p.Arg1060His | p.R1060H | P51825 | protein_coding | deleterious(0) | probably_damaging(0.997) | TCGA-A8-A07U-01 | Breast | breast invasive carcinoma | Female | >=65 | III/IV | Chemotherapy | 5-fluorouracil | SD |
| AFF1 | SNV | Missense_Mutation | rs374948523 | c.1042C>T | p.Pro348Ser | p.P348S | P51825 | protein_coding | tolerated(0.07) | probably_damaging(0.999) | TCGA-A8-A09Z-01 | Breast | breast invasive carcinoma | Female | >=65 | I/II | Unknown | Unknown | SD |
| AFF1 | SNV | Missense_Mutation | rs763409340 | c.1498G>A | p.Glu500Lys | p.E500K | P51825 | protein_coding | deleterious(0.04) | probably_damaging(0.949) | TCGA-AC-A3YI-01 | Breast | breast invasive carcinoma | Female | >=65 | III/IV | Chemotherapy | cytoxan | CR |
| AFF1 | SNV | Missense_Mutation | c.1393N>T | p.Pro465Ser | p.P465S | P51825 | protein_coding | tolerated(0.07) | possibly_damaging(0.572) | TCGA-AN-A0XN-01 | Breast | breast invasive carcinoma | Female | >=65 | III/IV | Unknown | Unknown | SD | |
| AFF1 | SNV | Missense_Mutation | rs769048976 | c.2966N>T | p.Thr989Met | p.T989M | P51825 | protein_coding | tolerated(0.1) | benign(0.015) | TCGA-AO-A128-01 | Breast | breast invasive carcinoma | Female | <65 | I/II | Chemotherapy | doxorubicin | SD |
| AFF1 | SNV | Missense_Mutation | rs755910368 | c.1916N>G | p.Tyr639Cys | p.Y639C | P51825 | protein_coding | tolerated(0.13) | benign(0.003) | TCGA-AR-A2LR-01 | Breast | breast invasive carcinoma | Female | <65 | I/II | Chemotherapy | adriamycin | SD |
| AFF1 | SNV | Missense_Mutation | c.601N>T | p.Pro201Ser | p.P201S | P51825 | protein_coding | tolerated(0.8) | possibly_damaging(0.603) | TCGA-BH-A0HP-01 | Breast | breast invasive carcinoma | Female | >=65 | III/IV | Chemotherapy | doxorubicin | SD | |
| AFF1 | SNV | Missense_Mutation | c.1895N>T | p.Arg632Met | p.R632M | P51825 | protein_coding | deleterious(0) | benign(0.357) | TCGA-BH-A18T-01 | Breast | breast invasive carcinoma | Female | >=65 | I/II | Unknown | Unknown | PD | |
| AFF1 | SNV | Missense_Mutation | c.1896N>T | p.Arg632Ser | p.R632S | P51825 | protein_coding | tolerated(1) | benign(0) | TCGA-BH-A18T-01 | Breast | breast invasive carcinoma | Female | >=65 | I/II | Unknown | Unknown | PD |
| Page: 1 2 3 4 5 6 7 8 9 10 11 12 13 |
Top |
Related drugs of malignant transformation related genes |
| Identification of chemicals and drugs interact with genes involved in malignant transfromation |
| (DGIdb 4.0) |
| Entrez ID | Symbol | Category | Interaction Types | Drug Claim Name | Drug Name | PMIDs |
| Page: 1 |

Copyright 2023-Present -The University of Texas Health Science Center at Houston |