
|
|||||
|
 | |
| |
| |
| |
| |
| |
|
Gene: AFDN |
Gene summary for AFDN |
| Gene information | Species | Human | Gene symbol | AFDN | Gene ID | 4301 |
| Gene name | afadin, adherens junction formation factor | |
| Gene Alias | AF6 | |
| Cytomap | 6q27 | |
| Gene Type | protein-coding | GO ID | GO:0001885 | UniProtAcc | P55196 |
Top |
Malignant transformation analysis |
| Identification of the aberrant gene expression in precancerous and cancerous lesions by comparing the gene expression of stem-like cells in diseased tissues with normal stem cells |
| Entrez ID | Symbol | Replicates | Species | Organ | Tissue | Adj P-value | Log2FC | Malignancy |
| 4301 | AFDN | HSIL_HPV_2 | Human | Cervix | HSIL_HPV | 9.10e-03 | 2.68e-01 | 0.0208 |
| 4301 | AFDN | CCI_1 | Human | Cervix | CC | 4.73e-07 | 1.50e+00 | 0.528 |
| 4301 | AFDN | CCI_2 | Human | Cervix | CC | 4.61e-06 | 7.08e-01 | 0.5249 |
| 4301 | AFDN | CCI_3 | Human | Cervix | CC | 5.65e-07 | 6.05e-01 | 0.516 |
| 4301 | AFDN | Tumor | Human | Cervix | CC | 1.95e-08 | -2.36e-01 | 0.1241 |
| 4301 | AFDN | sample3 | Human | Cervix | CC | 3.46e-03 | 2.16e-01 | 0.1387 |
| 4301 | AFDN | H2 | Human | Cervix | HSIL_HPV | 7.75e-28 | 6.95e-01 | 0.0632 |
| 4301 | AFDN | T3 | Human | Cervix | CC | 6.20e-05 | 2.78e-01 | 0.1389 |
| 4301 | AFDN | HTA11_3410_2000001011 | Human | Colorectum | AD | 1.10e-37 | -8.17e-01 | 0.0155 |
| 4301 | AFDN | HTA11_2487_2000001011 | Human | Colorectum | SER | 9.98e-11 | -5.44e-01 | -0.1808 |
| 4301 | AFDN | HTA11_2951_2000001011 | Human | Colorectum | AD | 1.07e-08 | -9.23e-01 | 0.0216 |
| 4301 | AFDN | HTA11_1938_2000001011 | Human | Colorectum | AD | 4.46e-05 | -3.98e-01 | -0.0811 |
| 4301 | AFDN | HTA11_3361_2000001011 | Human | Colorectum | AD | 3.96e-15 | -8.16e-01 | -0.1207 |
| 4301 | AFDN | HTA11_83_2000001011 | Human | Colorectum | SER | 3.19e-12 | -5.92e-01 | -0.1526 |
| 4301 | AFDN | HTA11_696_2000001011 | Human | Colorectum | AD | 2.37e-14 | -4.33e-01 | -0.1464 |
| 4301 | AFDN | HTA11_866_2000001011 | Human | Colorectum | AD | 1.22e-14 | -5.35e-01 | -0.1001 |
| 4301 | AFDN | HTA11_1391_2000001011 | Human | Colorectum | AD | 1.27e-04 | -4.30e-01 | -0.059 |
| 4301 | AFDN | HTA11_2992_2000001011 | Human | Colorectum | SER | 1.59e-09 | -4.86e-01 | -0.1706 |
| 4301 | AFDN | HTA11_546_2000001011 | Human | Colorectum | AD | 1.64e-02 | -3.88e-01 | -0.0842 |
| 4301 | AFDN | HTA11_9341_2000001011 | Human | Colorectum | SER | 4.37e-05 | -1.01e+00 | -0.00410000000000005 |
| Page: 1 2 3 4 5 6 7 8 9 10 |
| Tissue | Expression Dynamics | Abbreviation |
| Cervix | 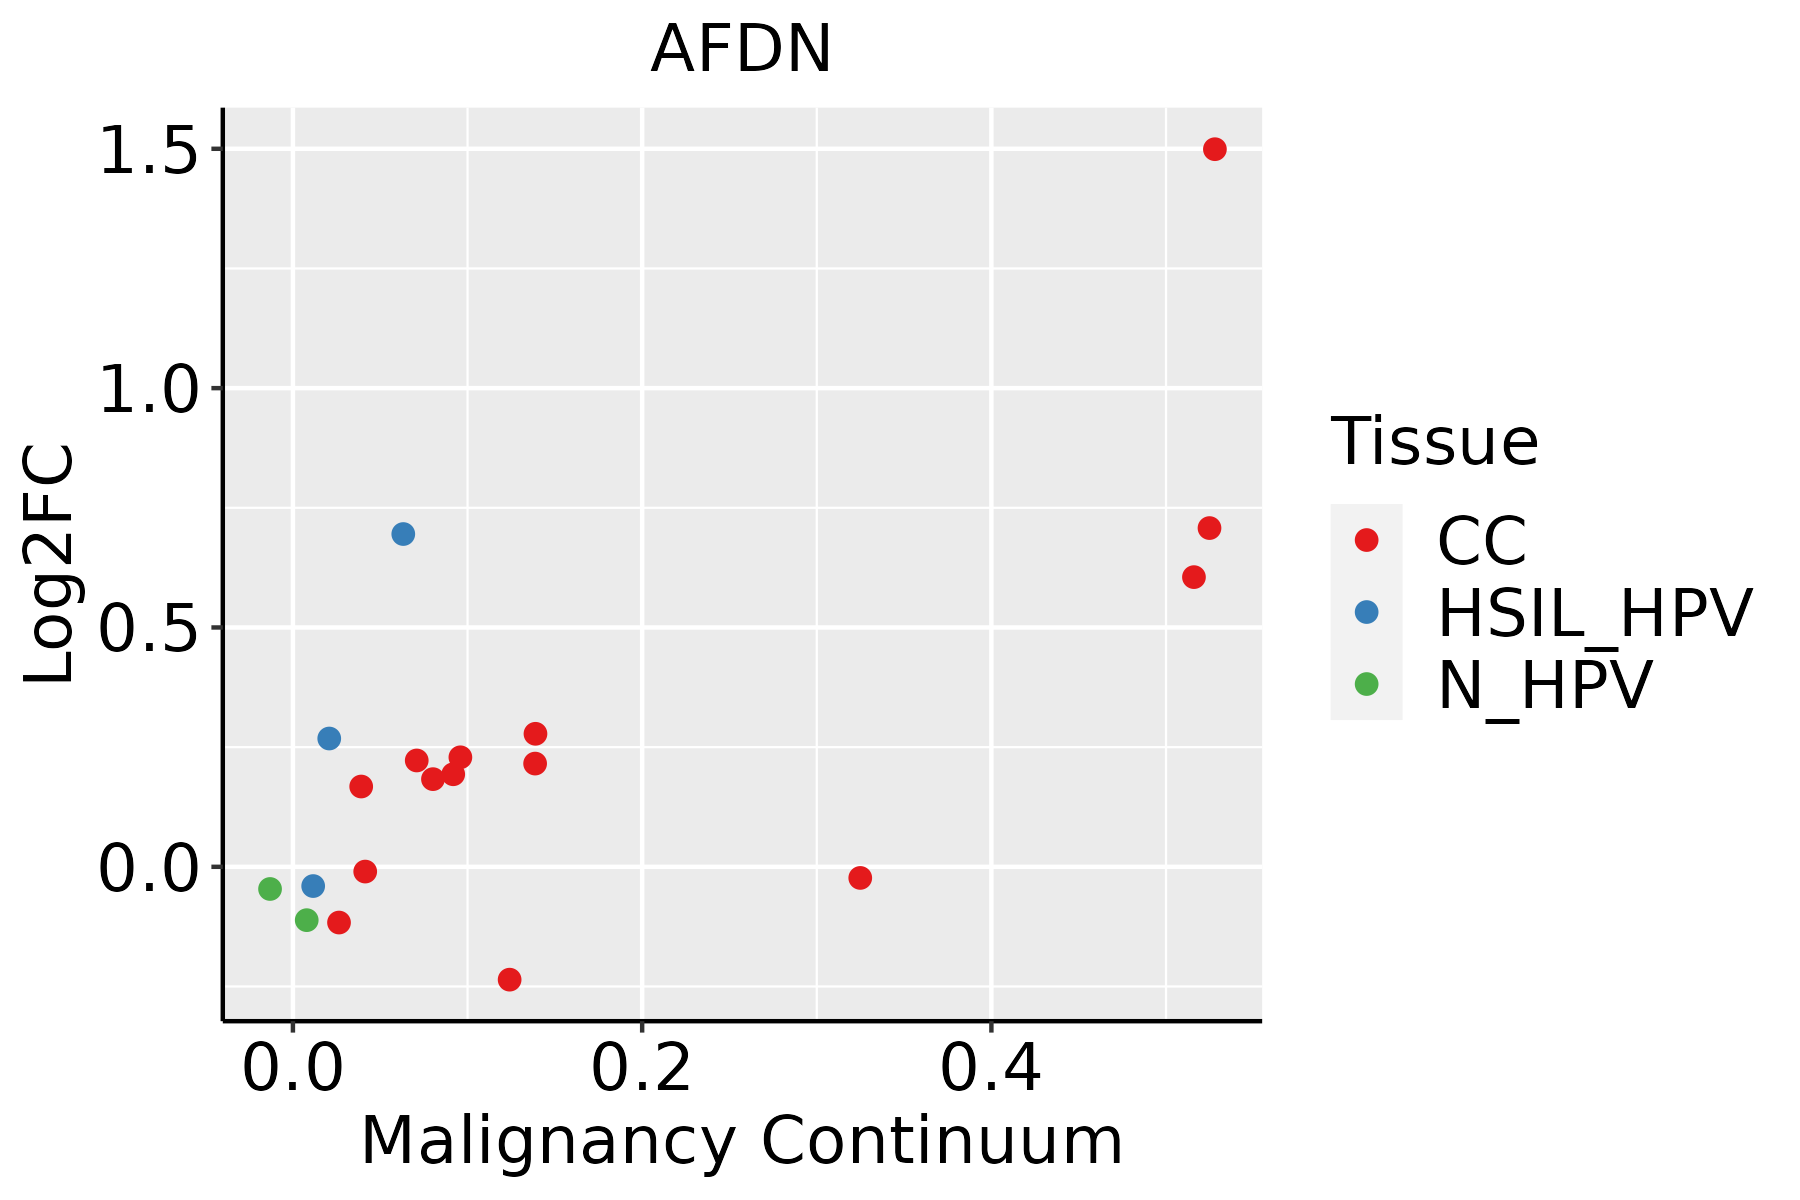 | CC: Cervix cancer |
| HSIL_HPV: HPV-infected high-grade squamous intraepithelial lesions | ||
| N_HPV: HPV-infected normal cervix | ||
| Colorectum (GSE201348) |  | FAP: Familial adenomatous polyposis |
| CRC: Colorectal cancer | ||
| Colorectum (HTA11) |  | AD: Adenomas |
| SER: Sessile serrated lesions | ||
| MSI-H: Microsatellite-high colorectal cancer | ||
| MSS: Microsatellite stable colorectal cancer | ||
| Endometrium | 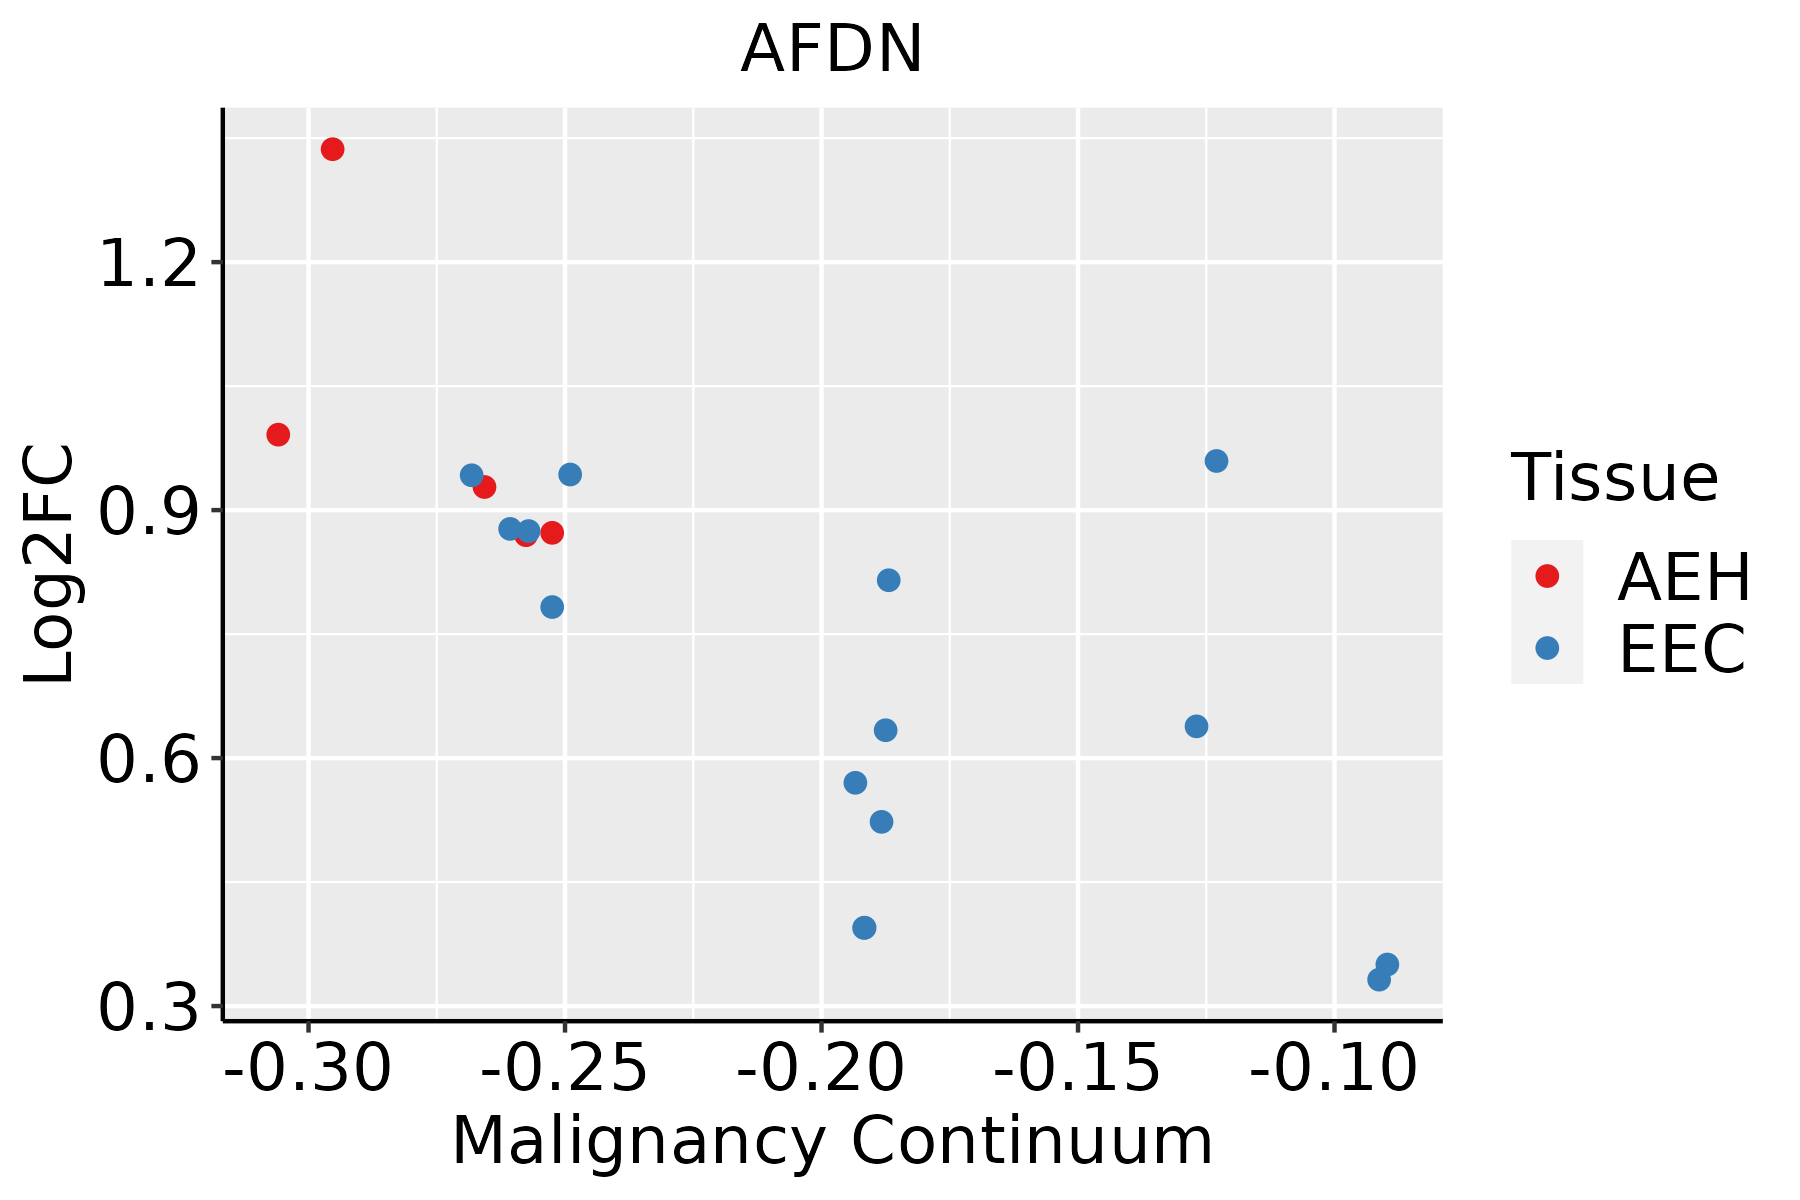 | AEH: Atypical endometrial hyperplasia |
| EEC: Endometrioid Cancer | ||
| GC |  | CAG: Chronic atrophic gastritis |
| CAG with IM: Chronic atrophic gastritis with intestinal metaplasia | ||
| CSG: Chronic superficial gastritis | ||
| GC: Gastric cancer | ||
| SIM: Severe intestinal metaplasia | ||
| WIM: Wild intestinal metaplasia | ||
| Liver |  | HCC: Hepatocellular carcinoma |
| NAFLD: Non-alcoholic fatty liver disease | ||
| Lung | 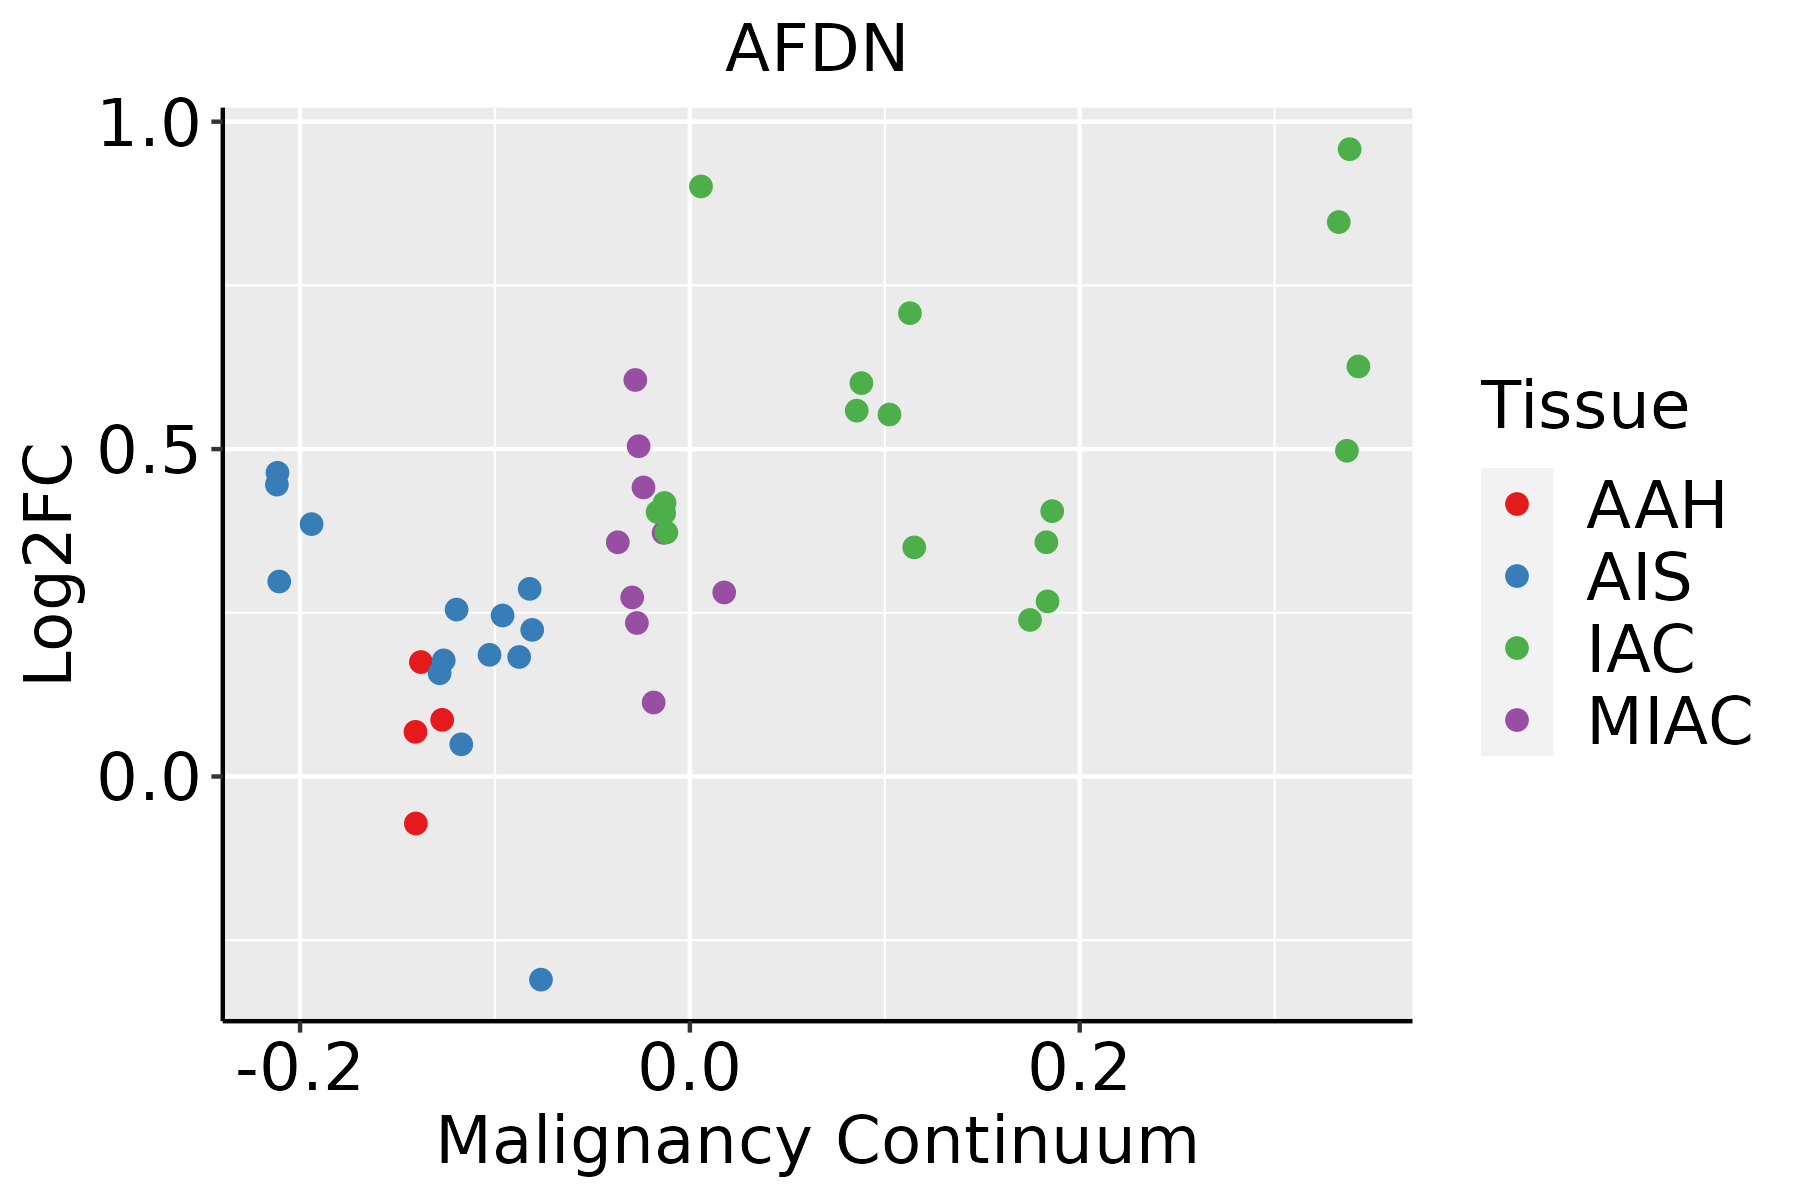 | AAH: Atypical adenomatous hyperplasia |
| AIS: Adenocarcinoma in situ | ||
| IAC: Invasive lung adenocarcinoma | ||
| MIA: Minimally invasive adenocarcinoma | ||
| Prostate |  | BPH: Benign Prostatic Hyperplasia |
| Skin | 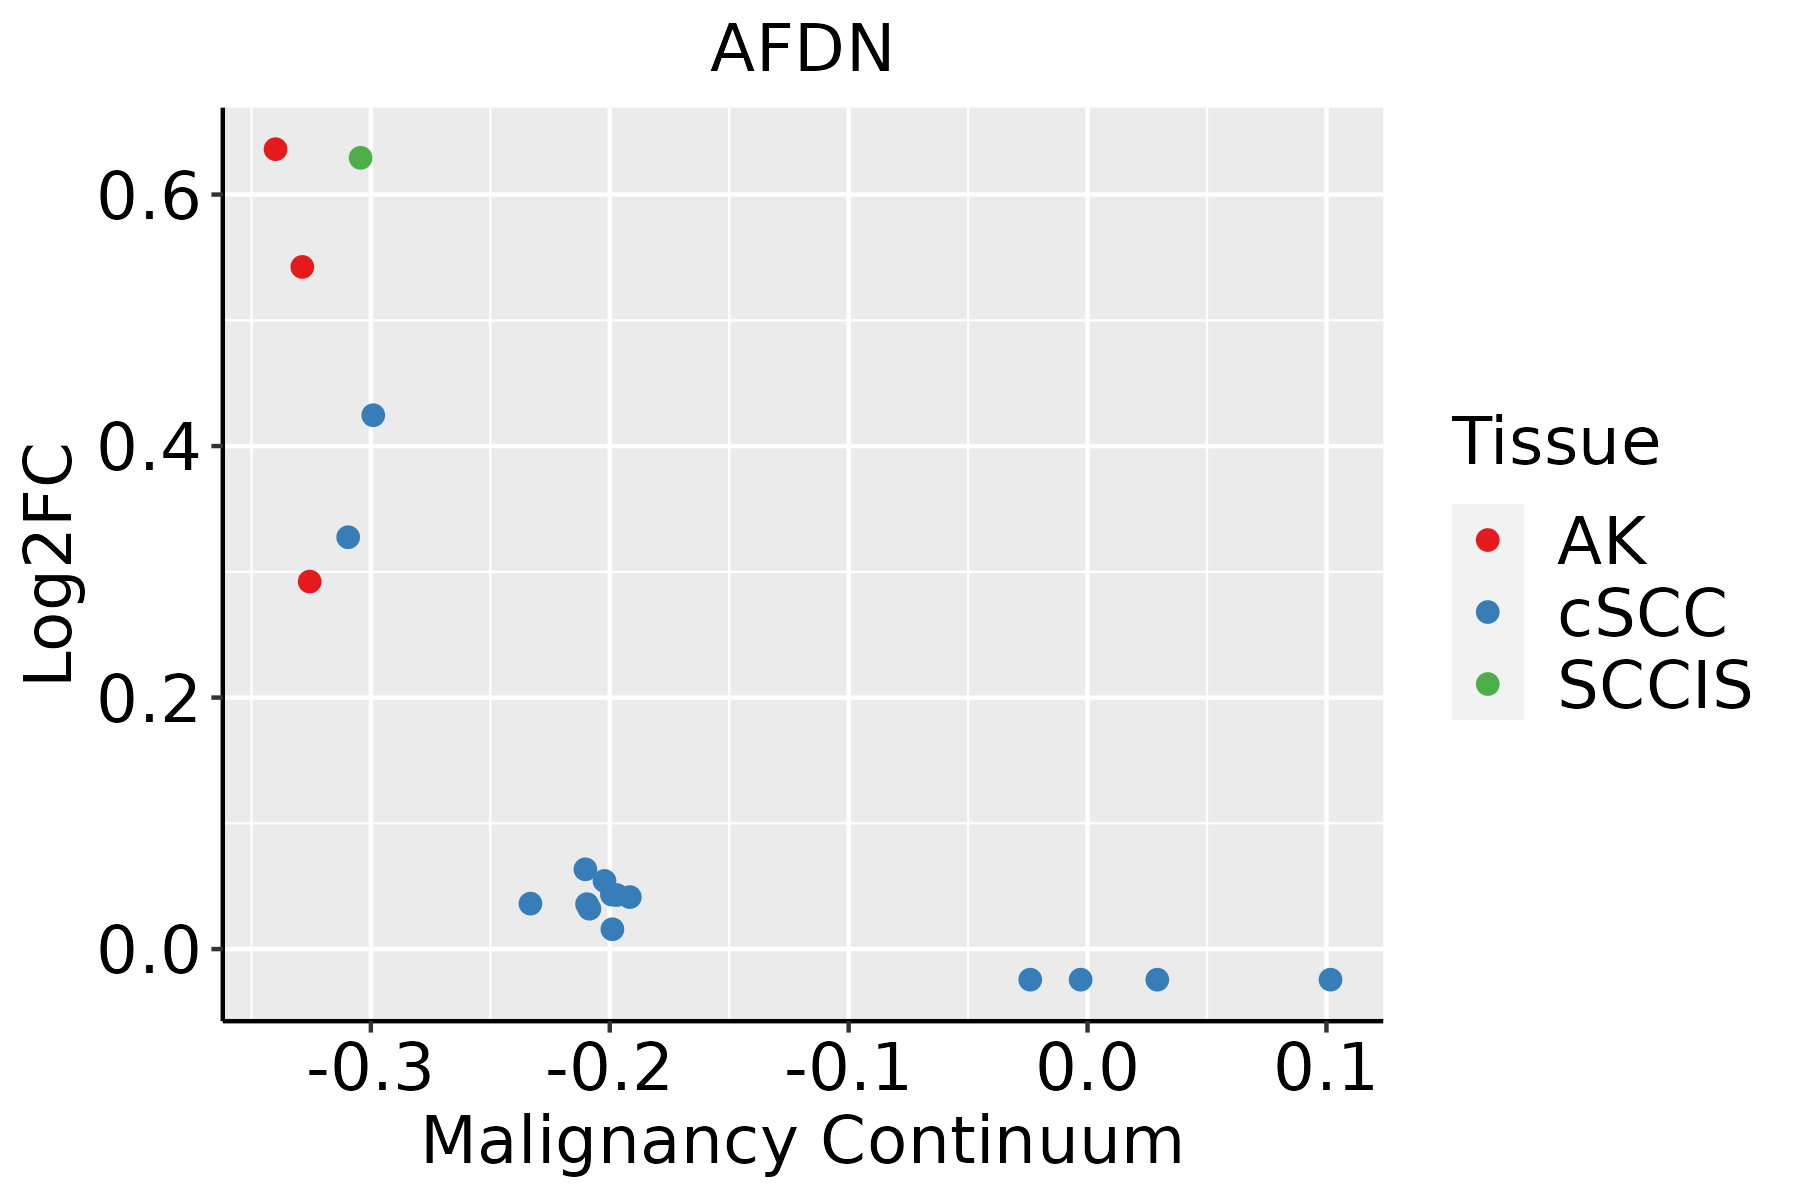 | AK: Actinic keratosis |
| cSCC: Cutaneous squamous cell carcinoma | ||
| SCCIS:squamous cell carcinoma in situ | ||
| Thyroid | 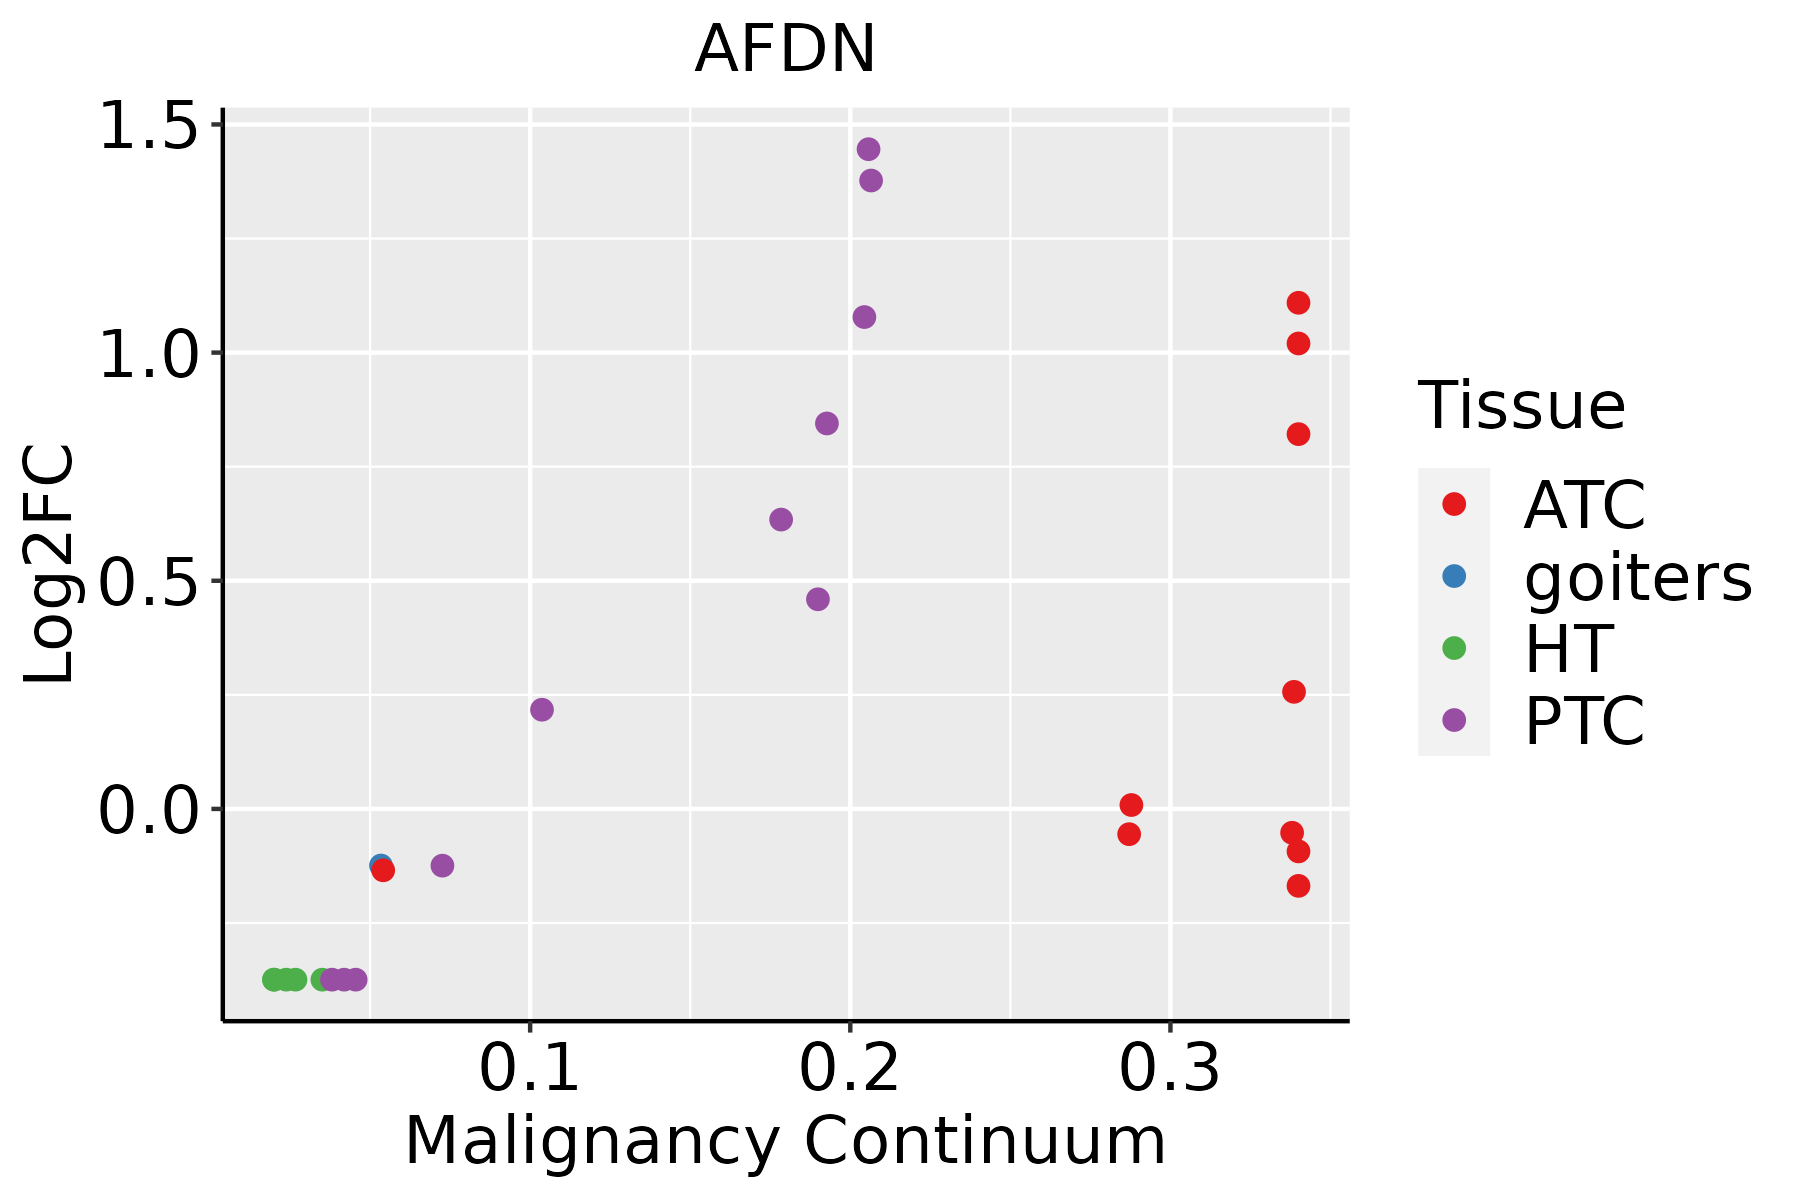 | ATC: Anaplastic thyroid cancer |
| HT: Hashimoto's thyroiditis | ||
| PTC: Papillary thyroid cancer |
| ∗log2FC in expression of this searched gene in stem-like cells from each diseased tissue sample relative to stem-like cells in normal samples in each tissue plotted against the malignancy continuum. Samples are colored based on if they are from different disease stage. |
Top |
Malignant transformation related pathway analysis |
| Find out the enriched GO biological processes and KEGG pathways involved in transition from healthy to precancer to cancer |
| Tissue | Disease Stage | Enriched GO biological Processes |
| Colorectum | AD |  |
| Colorectum | SER |  |
| Colorectum | MSS |  |
| Colorectum | MSI-H |  |
| Colorectum | FAP |  |
| ∗Top 15 enriched GO BP terms are showed in the bar plot of each disease state in each tissue. Each row represents a significant GO biological process which is colored according to the -log10(p.adjust). |
| Page: 1 2 3 4 5 6 7 8 9 |
| GO ID | Tissue | Disease Stage | Description | Gene Ratio | Bg Ratio | pvalue | p.adjust | Count |
| GO:002240710 | Cervix | CC | regulation of cell-cell adhesion | 103/2311 | 448/18723 | 1.78e-10 | 2.87e-08 | 103 |
| GO:004578510 | Cervix | CC | positive regulation of cell adhesion | 101/2311 | 437/18723 | 1.96e-10 | 3.08e-08 | 101 |
| GO:007265910 | Cervix | CC | protein localization to plasma membrane | 73/2311 | 284/18723 | 4.95e-10 | 6.73e-08 | 73 |
| GO:19907788 | Cervix | CC | protein localization to cell periphery | 78/2311 | 333/18723 | 1.22e-08 | 9.73e-07 | 78 |
| GO:00452169 | Cervix | CC | cell-cell junction organization | 53/2311 | 200/18723 | 3.83e-08 | 2.53e-06 | 53 |
| GO:00430877 | Cervix | CC | regulation of GTPase activity | 79/2311 | 348/18723 | 4.21e-08 | 2.60e-06 | 79 |
| GO:00343298 | Cervix | CC | cell junction assembly | 88/2311 | 420/18723 | 3.42e-07 | 1.38e-05 | 88 |
| GO:00070439 | Cervix | CC | cell-cell junction assembly | 39/2311 | 146/18723 | 1.86e-06 | 5.94e-05 | 39 |
| GO:00224099 | Cervix | CC | positive regulation of cell-cell adhesion | 61/2311 | 284/18723 | 9.30e-06 | 2.11e-04 | 61 |
| GO:00432978 | Cervix | CC | apical junction assembly | 24/2311 | 78/18723 | 1.36e-05 | 2.73e-04 | 24 |
| GO:00512713 | Cervix | CC | negative regulation of cellular component movement | 73/2311 | 367/18723 | 2.22e-05 | 3.95e-04 | 73 |
| GO:00400133 | Cervix | CC | negative regulation of locomotion | 76/2311 | 391/18723 | 3.47e-05 | 5.60e-04 | 76 |
| GO:20001463 | Cervix | CC | negative regulation of cell motility | 71/2311 | 359/18723 | 3.47e-05 | 5.60e-04 | 71 |
| GO:00303363 | Cervix | CC | negative regulation of cell migration | 68/2311 | 344/18723 | 5.11e-05 | 7.70e-04 | 68 |
| GO:00901509 | Cervix | CC | establishment of protein localization to membrane | 54/2311 | 260/18723 | 7.67e-05 | 1.05e-03 | 54 |
| GO:00435476 | Cervix | CC | positive regulation of GTPase activity | 53/2311 | 255/18723 | 8.72e-05 | 1.16e-03 | 53 |
| GO:01201927 | Cervix | CC | tight junction assembly | 21/2311 | 74/18723 | 1.69e-04 | 2.00e-03 | 21 |
| GO:01201937 | Cervix | CC | tight junction organization | 22/2311 | 80/18723 | 1.97e-04 | 2.26e-03 | 22 |
| GO:00469312 | Cervix | CC | pore complex assembly | 9/2311 | 20/18723 | 3.06e-04 | 3.27e-03 | 9 |
| GO:000206410 | Cervix | CC | epithelial cell development | 45/2311 | 220/18723 | 4.14e-04 | 4.21e-03 | 45 |
| Page: 1 2 3 4 5 6 7 8 9 10 11 12 13 14 15 16 17 18 19 20 21 22 23 24 25 26 |
| Pathway ID | Tissue | Disease Stage | Description | Gene Ratio | Bg Ratio | pvalue | p.adjust | qvalue | Count |
| hsa0452020 | Cervix | CC | Adherens junction | 33/1267 | 93/8465 | 6.99e-07 | 7.31e-06 | 4.32e-06 | 33 |
| hsa0453020 | Cervix | CC | Tight junction | 49/1267 | 169/8465 | 1.87e-06 | 1.78e-05 | 1.05e-05 | 49 |
| hsa0467020 | Cervix | CC | Leukocyte transendothelial migration | 36/1267 | 114/8465 | 5.22e-06 | 4.83e-05 | 2.86e-05 | 36 |
| hsa0401512 | Cervix | CC | Rap1 signaling pathway | 56/1267 | 210/8465 | 6.23e-06 | 5.61e-05 | 3.32e-05 | 56 |
| hsa040142 | Cervix | CC | Ras signaling pathway | 51/1267 | 236/8465 | 3.55e-03 | 1.34e-02 | 7.91e-03 | 51 |
| hsa04520110 | Cervix | CC | Adherens junction | 33/1267 | 93/8465 | 6.99e-07 | 7.31e-06 | 4.32e-06 | 33 |
| hsa04530110 | Cervix | CC | Tight junction | 49/1267 | 169/8465 | 1.87e-06 | 1.78e-05 | 1.05e-05 | 49 |
| hsa04670110 | Cervix | CC | Leukocyte transendothelial migration | 36/1267 | 114/8465 | 5.22e-06 | 4.83e-05 | 2.86e-05 | 36 |
| hsa0401513 | Cervix | CC | Rap1 signaling pathway | 56/1267 | 210/8465 | 6.23e-06 | 5.61e-05 | 3.32e-05 | 56 |
| hsa0401411 | Cervix | CC | Ras signaling pathway | 51/1267 | 236/8465 | 3.55e-03 | 1.34e-02 | 7.91e-03 | 51 |
| hsa0467025 | Cervix | HSIL_HPV | Leukocyte transendothelial migration | 16/459 | 114/8465 | 4.04e-04 | 3.49e-03 | 2.82e-03 | 16 |
| hsa0467035 | Cervix | HSIL_HPV | Leukocyte transendothelial migration | 16/459 | 114/8465 | 4.04e-04 | 3.49e-03 | 2.82e-03 | 16 |
| hsa04520 | Colorectum | AD | Adherens junction | 50/2092 | 93/8465 | 1.52e-09 | 2.83e-08 | 1.81e-08 | 50 |
| hsa04530 | Colorectum | AD | Tight junction | 76/2092 | 169/8465 | 5.49e-09 | 9.69e-08 | 6.18e-08 | 76 |
| hsa04015 | Colorectum | AD | Rap1 signaling pathway | 71/2092 | 210/8465 | 1.72e-03 | 9.68e-03 | 6.18e-03 | 71 |
| hsa04670 | Colorectum | AD | Leukocyte transendothelial migration | 41/2092 | 114/8465 | 4.60e-03 | 2.20e-02 | 1.40e-02 | 41 |
| hsa045201 | Colorectum | AD | Adherens junction | 50/2092 | 93/8465 | 1.52e-09 | 2.83e-08 | 1.81e-08 | 50 |
| hsa045301 | Colorectum | AD | Tight junction | 76/2092 | 169/8465 | 5.49e-09 | 9.69e-08 | 6.18e-08 | 76 |
| hsa040151 | Colorectum | AD | Rap1 signaling pathway | 71/2092 | 210/8465 | 1.72e-03 | 9.68e-03 | 6.18e-03 | 71 |
| hsa046701 | Colorectum | AD | Leukocyte transendothelial migration | 41/2092 | 114/8465 | 4.60e-03 | 2.20e-02 | 1.40e-02 | 41 |
| Page: 1 2 3 4 5 6 7 8 9 |
Top |
Cell-cell communication analysis |
| Identification of potential cell-cell interactions between two cell types and their ligand-receptor pairs for different disease states |
| Ligand | Receptor | LRpair | Pathway | Tissue | Disease Stage |
| Page: 1 |
Top |
Single-cell gene regulatory network inference analysis |
| Find out the significant the regulons (TFs) and the target genes of each regulon across cell types for different disease states |
| TF | Cell Type | Tissue | Disease Stage | Target Gene | RSS | Regulon Activity |
| ∗The dot plots of a searched regulon are shown for all cell subpopulations in each disease state of each tissue based on the regulon specific score inferred using pySCENIC and by calculating the average expression. |
| Page: 1 |
Top |
Somatic mutation of malignant transformation related genes |
| Annotation of somatic variants for genes involved in malignant transformation |
| Hugo Symbol | Variant Class | Variant Classification | dbSNP RS | HGVSc | HGVSp | HGVSp Short | SWISSPROT | BIOTYPE | SIFT | PolyPhen | Tumor Sample Barcode | Tissue | Histology | Sex | Age | Stage | Therapy Types | Drugs | Outcome |
| AFDN | SNV | Missense_Mutation | novel | c.2237T>C | p.Phe746Ser | p.F746S | protein_coding | deleterious(0) | probably_damaging(0.999) | TCGA-A8-A06Z-01 | Breast | breast invasive carcinoma | Female | >=65 | I/II | Unknown | Unknown | SD | |
| AFDN | SNV | Missense_Mutation | c.3484G>A | p.Gly1162Arg | p.G1162R | protein_coding | deleterious_low_confidence(0) | probably_damaging(1) | TCGA-AC-A23H-01 | Breast | breast invasive carcinoma | Female | >=65 | I/II | Unknown | Unknown | PD | ||
| AFDN | SNV | Missense_Mutation | novel | c.4720N>C | p.Glu1574Gln | p.E1574Q | protein_coding | deleterious_low_confidence(0) | possibly_damaging(0.724) | TCGA-AC-A62X-01 | Breast | breast invasive carcinoma | Female | >=65 | I/II | Unknown | Unknown | SD | |
| AFDN | SNV | Missense_Mutation | rs571941763 | c.4076N>T | p.Pro1359Leu | p.P1359L | protein_coding | tolerated_low_confidence(0.29) | benign(0.003) | TCGA-AN-A0FD-01 | Breast | breast invasive carcinoma | Female | >=65 | I/II | Unknown | Unknown | SD | |
| AFDN | SNV | Missense_Mutation | rs765437330 | c.3461N>T | p.Ala1154Val | p.A1154V | protein_coding | tolerated_low_confidence(0.1) | possibly_damaging(0.523) | TCGA-AO-A128-01 | Breast | breast invasive carcinoma | Female | <65 | I/II | Chemotherapy | doxorubicin | SD | |
| AFDN | SNV | Missense_Mutation | c.4406N>A | p.Ser1469Asn | p.S1469N | protein_coding | deleterious_low_confidence(0) | probably_damaging(0.997) | TCGA-BH-A0B6-01 | Breast | breast invasive carcinoma | Female | <65 | I/II | Unknown | Unknown | SD | ||
| AFDN | SNV | Missense_Mutation | c.4581G>C | p.Lys1527Asn | p.K1527N | protein_coding | deleterious_low_confidence(0) | possibly_damaging(0.863) | TCGA-BH-A0DZ-01 | Breast | breast invasive carcinoma | Female | <65 | I/II | Chemotherapy | docetaxel | SD | ||
| AFDN | SNV | Missense_Mutation | c.1568N>G | p.Ser523Cys | p.S523C | protein_coding | tolerated(0.07) | benign(0.024) | TCGA-BH-A18P-01 | Breast | breast invasive carcinoma | Female | <65 | I/II | Unknown | Unknown | PD | ||
| AFDN | SNV | Missense_Mutation | novel | c.1399C>G | p.Leu467Val | p.L467V | protein_coding | tolerated(0.14) | benign(0.013) | TCGA-BH-A5IZ-01 | Breast | breast invasive carcinoma | Female | <65 | I/II | Chemotherapy | adriamycin | CR | |
| AFDN | SNV | Missense_Mutation | c.2702G>T | p.Cys901Phe | p.C901F | protein_coding | deleterious(0) | probably_damaging(0.999) | TCGA-C8-A12Q-01 | Breast | breast invasive carcinoma | Female | >=65 | III/IV | Unknown | Unknown | PD |
| Page: 1 2 3 4 5 6 7 8 9 10 11 12 13 14 15 16 17 18 19 20 |
Top |
Related drugs of malignant transformation related genes |
| Identification of chemicals and drugs interact with genes involved in malignant transfromation |
| (DGIdb 4.0) |
| Entrez ID | Symbol | Category | Interaction Types | Drug Claim Name | Drug Name | PMIDs |
| Page: 1 |

Copyright 2023-Present -The University of Texas Health Science Center at Houston |