Schematic overview of the cellular and molecular mechanisms involved in the cancer progression, including the proposed cellular and molecular mechanisms in cancer cells trajectory. AT1: alveolar type 1 cells; AT2: alveolar type 2 cells; AAH: atypical adenomatous hyperplasia; AIS: adenocarcinoma in situ; MIA: minimally invasive adenocarcinoma; IA: invasive adenocarcinoma; EMT: epithelial-mesenchymal transition

Home

Download

Statistics

Help

Contact

Center for Computational Systems Medicine
leaf

Gene summary

leaf

Malignant transformation analysis

leaf

Malignant transformation related pathway analysis

leaf

Cell-cell communication analysis

leaf

Single-cell gene regulatory network inference analysis

leaf

Somatic mutation of malignant transformation related genes

leaf

Related drugs of malignant transformation related genes

Gene: AFAP1L2

Gene summary for AFAP1L2

check button Gene summary.

Gene informationSpeciesHuman
Gene symbol

AFAP1L2

Gene ID

84632

Gene nameactin filament associated protein 1 like 2
Gene AliasCTB-1144G6.4
Cytomap10q25.3
Gene Typeprotein-coding
GO ID

GO:0000278

UniProtAcc

Q8N4X5


Top

Malignant transformation analysis

check button Identification of the aberrant gene expression in precancerous and cancerous lesions by comparing the gene expression of stem-like cells in diseased tissues with normal stem cells
check button Malignant transformation involving gene list.
Entrez IDSymbolReplicatesSpeciesOrganTissueAdj P-valueLog2FCMalignancy
84632AFAP1L2P4T-EHumanEsophagusESCC1.17e-122.08e-010.1323
84632AFAP1L2P5T-EHumanEsophagusESCC9.23e-336.05e-010.1327
84632AFAP1L2P8T-EHumanEsophagusESCC9.44e-071.14e-010.0889
84632AFAP1L2P9T-EHumanEsophagusESCC2.07e-051.28e-010.1131
84632AFAP1L2P10T-EHumanEsophagusESCC1.51e-042.11e-020.116
84632AFAP1L2P11T-EHumanEsophagusESCC8.35e-185.98e-010.1426
84632AFAP1L2P12T-EHumanEsophagusESCC3.50e-023.07e-020.1122
84632AFAP1L2P16T-EHumanEsophagusESCC4.11e-081.10e-010.1153
84632AFAP1L2P17T-EHumanEsophagusESCC7.58e-094.88e-010.1278
84632AFAP1L2P19T-EHumanEsophagusESCC1.98e-116.28e-010.1662
84632AFAP1L2P20T-EHumanEsophagusESCC7.81e-071.51e-010.1124
84632AFAP1L2P21T-EHumanEsophagusESCC9.35e-101.98e-010.1617
84632AFAP1L2P22T-EHumanEsophagusESCC9.56e-081.40e-010.1236
84632AFAP1L2P23T-EHumanEsophagusESCC2.36e-051.86e-010.108
84632AFAP1L2P24T-EHumanEsophagusESCC1.53e-194.10e-010.1287
84632AFAP1L2P26T-EHumanEsophagusESCC5.36e-056.38e-020.1276
84632AFAP1L2P27T-EHumanEsophagusESCC8.56e-122.24e-010.1055
84632AFAP1L2P32T-EHumanEsophagusESCC9.56e-081.94e-010.1666
84632AFAP1L2P36T-EHumanEsophagusESCC4.97e-112.44e-010.1187
84632AFAP1L2P37T-EHumanEsophagusESCC1.45e-194.08e-010.1371
Page: 1 2 3 4 

check button Transcriptomic changes along malignancy continuum.
TissueExpression DynamicsAbbreviation
EsophagusThe image shows the transcriptomic changes along malignancy continuum.log2FC in expression of this searched gene in stem-like cells from each diseased tissue sample relative to stem-like cells in normal samples in each tissue plotted against the malignancy continuum. Samples are colored based on if they are from different disease stage.
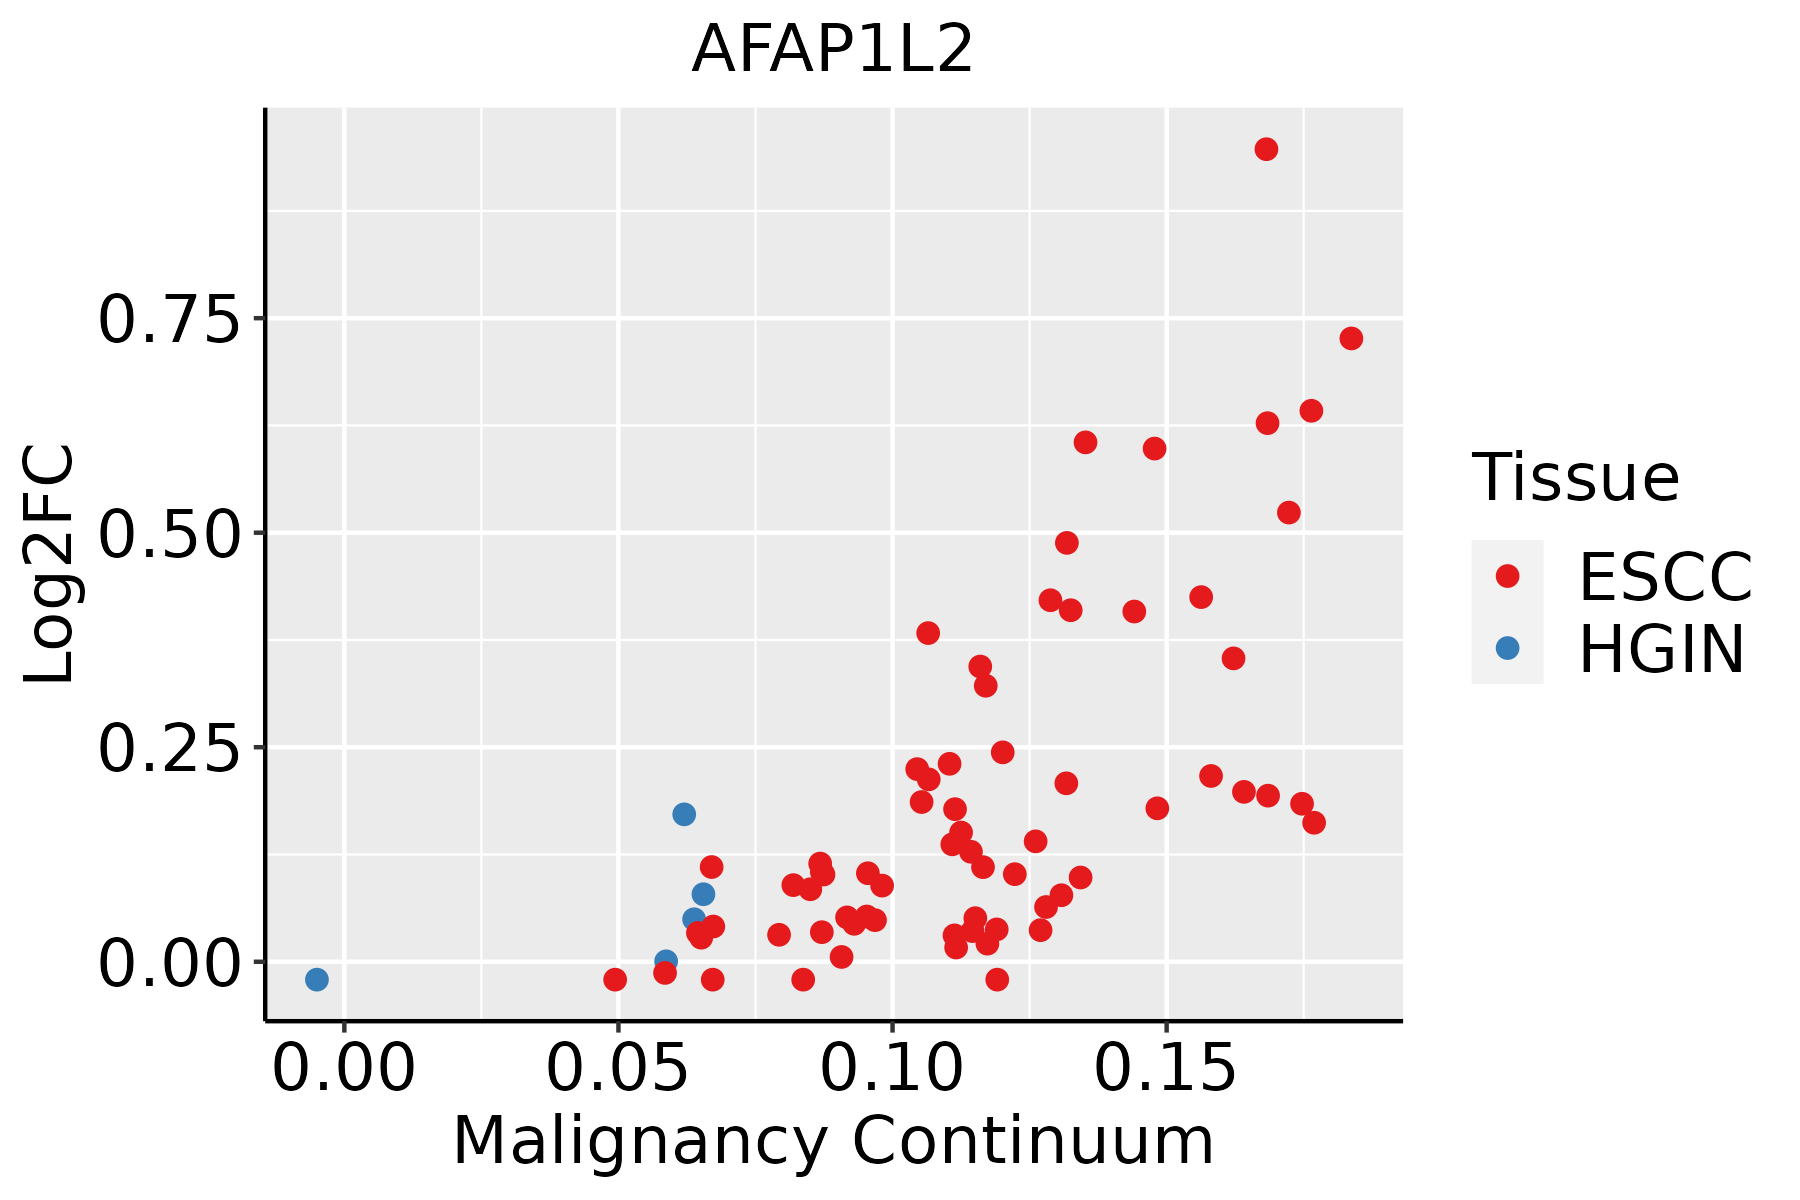
ESCC: Esophageal squamous cell carcinoma
HGIN: High-grade intraepithelial neoplasias
LGIN: Low-grade intraepithelial neoplasias
Oral CavityThe image shows the transcriptomic changes along malignancy continuum.log2FC in expression of this searched gene in stem-like cells from each diseased tissue sample relative to stem-like cells in normal samples in each tissue plotted against the malignancy continuum. Samples are colored based on if they are from different disease stage.
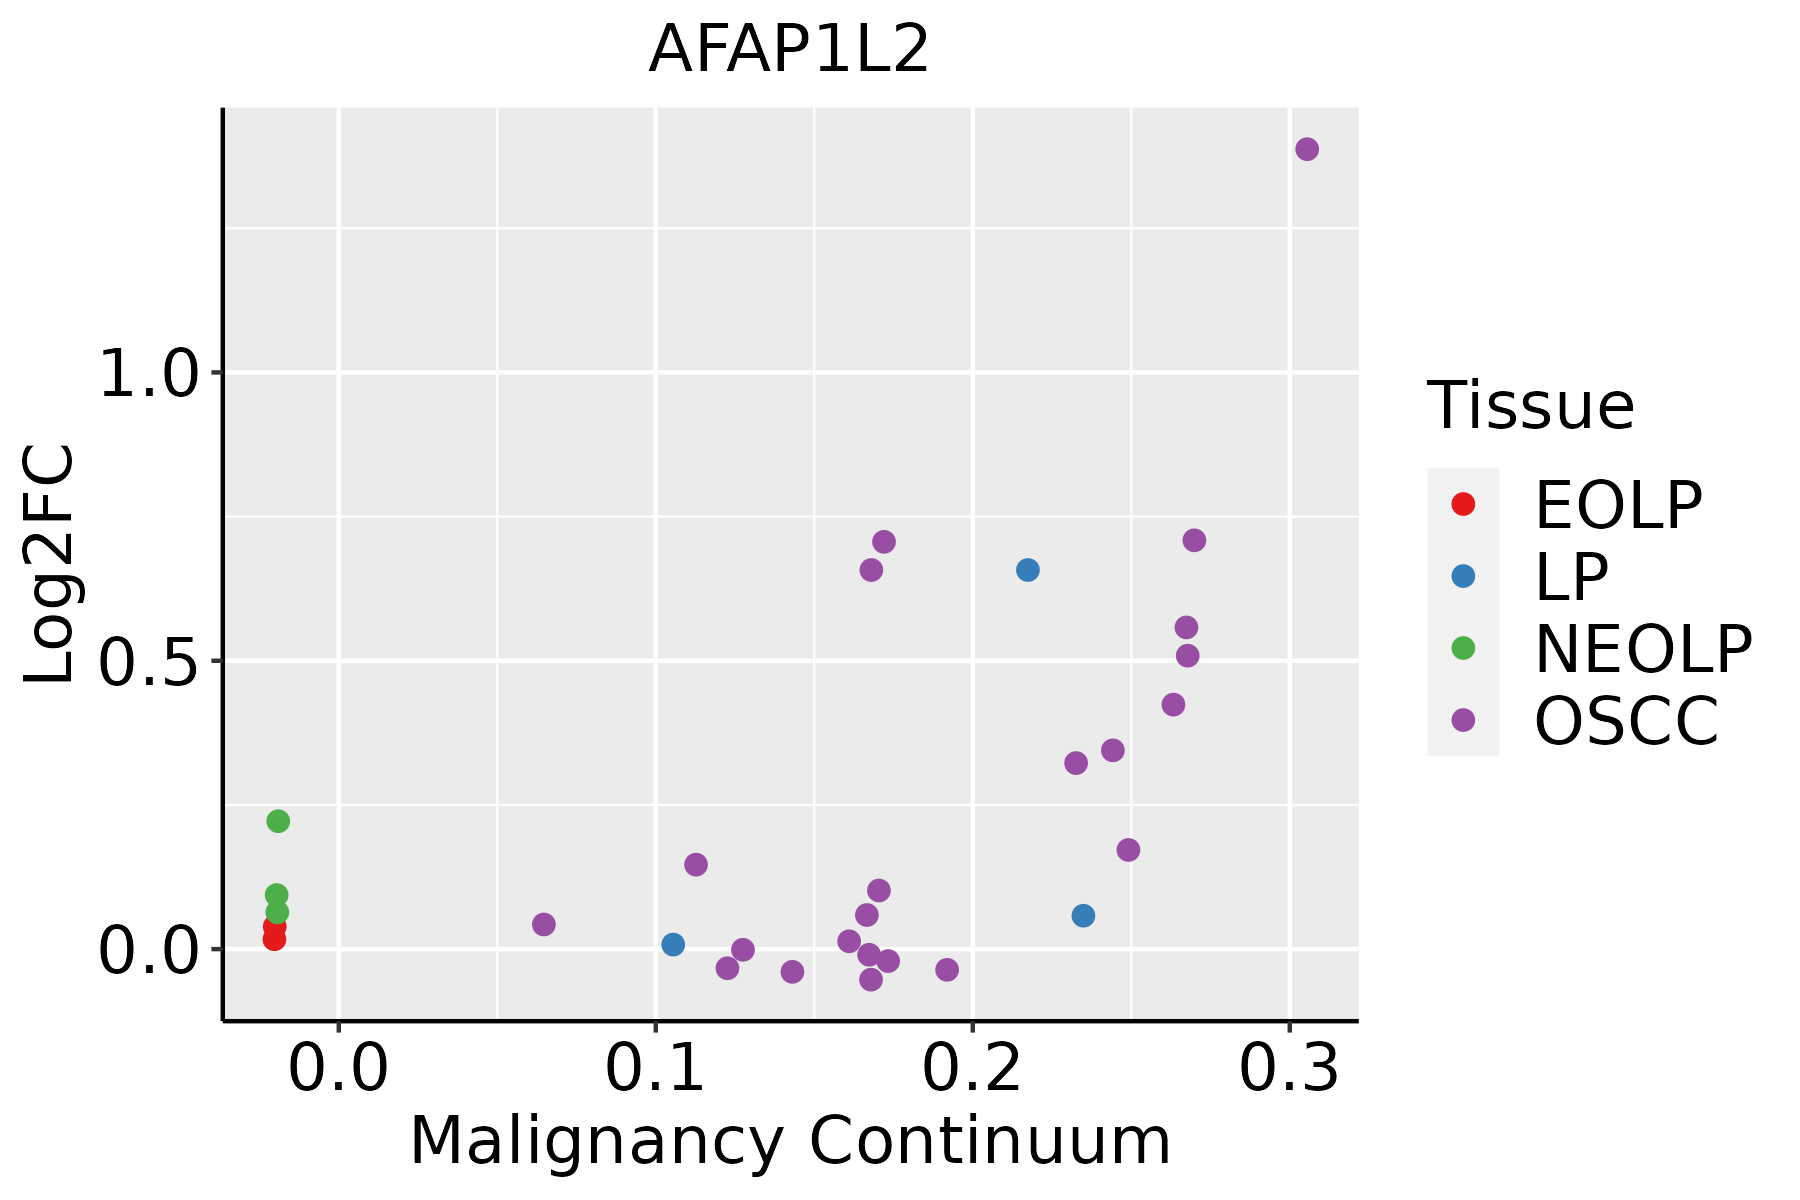
EOLP: Erosive Oral lichen planus
LP: leukoplakia
NEOLP: Non-erosive oral lichen planus
OSCC: Oral squamous cell carcinoma
ThyroidThe image shows the transcriptomic changes along malignancy continuum.log2FC in expression of this searched gene in stem-like cells from each diseased tissue sample relative to stem-like cells in normal samples in each tissue plotted against the malignancy continuum. Samples are colored based on if they are from different disease stage.ATC: Anaplastic thyroid cancer
HT: Hashimoto's thyroiditis
PTC: Papillary thyroid cancer
∗log2FC in expression of this searched gene in stem-like cells from each diseased tissue sample relative to stem-like cells in normal samples in each tissue plotted against the malignancy continuum. Samples are colored based on if they are from different disease stage.

Top

Malignant transformation related pathway analysis

check buttonFind out the enriched GO biological processes and KEGG pathways involved in transition from healthy to precancer to cancer
check button Figure of enriched GO biological processes.
TissueDisease StageEnriched GO biological Processes
ColorectumADGO analysis - Figure of enriched GO biological processes: Top 15 enriched GO BP terms are showed in the bar plot of each disease state in each tissue. Each row represents a significant GO biological process which is colored according to the -log10(p.adjust).
ColorectumSERGO analysis - Figure of enriched GO biological processes: Top 15 enriched GO BP terms are showed in the bar plot of each disease state in each tissue. Each row represents a significant GO biological process which is colored according to the -log10(p.adjust).
ColorectumMSSGO analysis - Figure of enriched GO biological processes: Top 15 enriched GO BP terms are showed in the bar plot of each disease state in each tissue. Each row represents a significant GO biological process which is colored according to the -log10(p.adjust).
ColorectumMSI-HGO analysis - Figure of enriched GO biological processes: Top 15 enriched GO BP terms are showed in the bar plot of each disease state in each tissue. Each row represents a significant GO biological process which is colored according to the -log10(p.adjust).
ColorectumFAPGO analysis - Figure of enriched GO biological processes: Top 15 enriched GO BP terms are showed in the bar plot of each disease state in each tissue. Each row represents a significant GO biological process which is colored according to the -log10(p.adjust).
∗Top 15 enriched GO BP terms are showed in the bar plot of each disease state in each tissue. Each row represents a significant GO biological process which is colored according to the -log10(p.adjust).
Page: 1 2 3 4 5 6 7 8 9 

check button Enriched GO biological processes.
GO IDTissueDisease StageDescriptionGene RatioBg Ratiopvaluep.adjustCount
GO:000734615EsophagusESCCregulation of mitotic cell cycle293/8552457/187238.00e-165.64e-14293
GO:003812718EsophagusESCCERBB signaling pathway82/8552121/187237.23e-079.40e-0682
GO:000717318EsophagusESCCepidermal growth factor receptor signaling pathway73/8552108/187233.36e-063.73e-0573
GO:004586018EsophagusESCCpositive regulation of protein kinase activity219/8552386/187236.91e-066.97e-05219
GO:003367420EsophagusESCCpositive regulation of kinase activity260/8552467/187237.26e-067.22e-05260
GO:190118413EsophagusESCCregulation of ERBB signaling pathway54/855279/187233.81e-053.08e-0454
GO:00420588EsophagusESCCregulation of epidermal growth factor receptor signaling pathway50/855273/187236.75e-055.12e-0450
GO:00182124EsophagusESCCpeptidyl-tyrosine modification202/8552378/187231.34e-036.39e-03202
GO:00181084EsophagusESCCpeptidyl-tyrosine phosphorylation200/8552375/187231.60e-037.45e-03200
GO:00507303EsophagusESCCregulation of peptidyl-tyrosine phosphorylation144/8552264/187232.22e-039.78e-03144
GO:00610972EsophagusESCCregulation of protein tyrosine kinase activity55/855290/187232.27e-039.99e-0355
GO:000181916EsophagusESCCpositive regulation of cytokine production244/8552467/187232.29e-031.01e-02244
GO:00073469Oral cavityOSCCregulation of mitotic cell cycle266/7305457/187233.87e-173.41e-15266
GO:003812715Oral cavityOSCCERBB signaling pathway76/7305121/187239.59e-081.66e-0676
GO:000717315Oral cavityOSCCepidermal growth factor receptor signaling pathway67/7305108/187231.04e-061.40e-0567
GO:004586016Oral cavityOSCCpositive regulation of protein kinase activity194/7305386/187233.90e-064.59e-05194
GO:003367418Oral cavityOSCCpositive regulation of kinase activity228/7305467/187238.31e-068.90e-05228
GO:19011847Oral cavityOSCCregulation of ERBB signaling pathway50/730579/187231.06e-051.12e-0450
GO:00420587Oral cavityOSCCregulation of epidermal growth factor receptor signaling pathway46/730573/187232.80e-052.59e-0446
GO:00182123Oral cavityOSCCpeptidyl-tyrosine modification180/7305378/187233.63e-042.22e-03180
Page: 1 2 3 

check button Enriched KEGG pathways.
Pathway IDTissueDisease StageDescriptionGene RatioBg Ratiopvaluep.adjustqvalueCount
Page: 1 

Top

Cell-cell communication analysis

check buttonIdentification of potential cell-cell interactions between two cell types and their ligand-receptor pairs for different disease states
LigandReceptorLRpairPathwayTissueDisease Stage
Page: 1 

Top

Single-cell gene regulatory network inference analysis

check buttonFind out the significant the regulons (TFs) and the target genes of each regulon across cell types for different disease states
TFCell TypeTissueDisease StageTarget GeneRSSRegulon Activity
∗The dot plots of a searched regulon are shown for all cell subpopulations in each disease state of each tissue based on the regulon specific score inferred using pySCENIC and by calculating the average expression.
Page: 1 

Top

Somatic mutation of malignant transformation related genes

check buttonAnnotation of somatic variants for genes involved in malignant transformation
Hugo SymbolVariant ClassVariant ClassificationdbSNP RSHGVScHGVSpHGVSp ShortSWISSPROTBIOTYPESIFTPolyPhenTumor Sample BarcodeTissueHistologySexAgeStageTherapy TypesDrugsOutcome
AFAP1L2SNVMissense_Mutationc.1471N>Ap.Asp491Asnp.D491NQ8N4X5protein_codingtolerated(0.2)probably_damaging(1)TCGA-AN-A0FX-01Breastbreast invasive carcinomaFemale<65I/IIUnknownUnknownSD
AFAP1L2insertionIn_Frame_Insnovelc.576_577insCCCTCTCCCATCACAACCACTTCAp.Ala192_Lys193insProSerProIleThrThrThrSerp.A192_K193insPSPITTTSQ8N4X5protein_codingTCGA-A2-A0D1-01Breastbreast invasive carcinomaFemale>=65I/IIChemotherapytaxotereSD
AFAP1L2insertionNonsense_Mutationnovelc.1682_1683insTTGAAAAGAAGAAGGAAGAAATCCGGp.Leu562Terp.L562*Q8N4X5protein_codingTCGA-A8-A09C-01Breastbreast invasive carcinomaFemale>=65I/IIUnknownUnknownSD
AFAP1L2deletionFrame_Shift_Delnovelc.545delTp.Leu182ArgfsTer37p.L182Rfs*37Q8N4X5protein_codingTCGA-D8-A27V-01Breastbreast invasive carcinomaFemale<65I/IIHormone TherapytamoxiphenSD
AFAP1L2SNVMissense_Mutationc.1648N>Tp.Pro550Serp.P550SQ8N4X5protein_codingtolerated(0.5)benign(0)TCGA-EA-A3HQ-01Cervixcervical & endocervical cancerFemale<65I/IIUnknownUnknownSD
AFAP1L2SNVMissense_Mutationrs367978439c.823N>Ap.Glu275Lysp.E275KQ8N4X5protein_codingtolerated(0.1)benign(0.033)TCGA-VS-A8EH-01Cervixcervical & endocervical cancerFemale<65III/IVChemotherapycisplatinCR
AFAP1L2SNVMissense_Mutationnovelc.875N>Tp.Cys292Phep.C292FQ8N4X5protein_codingdeleterious(0.04)benign(0.099)TCGA-ZJ-AAX4-01Cervixcervical & endocervical cancerFemale>=65I/IIUnknownUnknownSD
AFAP1L2SNVMissense_Mutationc.1127G>Cp.Arg376Thrp.R376TQ8N4X5protein_codingdeleterious(0)benign(0.312)TCGA-AA-3673-01Colorectumcolon adenocarcinomaFemale<65I/IIUnknownUnknownSD
AFAP1L2SNVMissense_Mutationnovelc.2050N>Tp.Gly684Trpp.G684WQ8N4X5protein_codingdeleterious(0.01)possibly_damaging(0.888)TCGA-AA-3950-01Colorectumcolon adenocarcinomaFemale>=65I/IIUnknownUnknownSD
AFAP1L2SNVMissense_Mutationrs750411935c.2279C>Gp.Thr760Serp.T760SQ8N4X5protein_codingtolerated(0.44)benign(0.063)TCGA-AA-A01V-01Colorectumcolon adenocarcinomaMale<65I/IIUnknownUnknownSD
Page: 1 2 3 4 5 6 

Top

Related drugs of malignant transformation related genes

check buttonIdentification of chemicals and drugs interact with genes involved in malignant transfromation
(DGIdb 4.0)
Entrez IDSymbolCategoryInteraction TypesDrug Claim NameDrug NamePMIDs
Page: 1