
|
|||||
|
 | |
| |
| |
| |
| |
| |
|
Gene: AFAP1L1 |
Gene summary for AFAP1L1 |
| Gene information | Species | Human | Gene symbol | AFAP1L1 | Gene ID | 134265 |
| Gene name | actin filament associated protein 1 like 1 | |
| Gene Alias | AFAP1L1 | |
| Cytomap | 5q32 | |
| Gene Type | protein-coding | GO ID | GO:0002102 | UniProtAcc | Q8TED9 |
Top |
Malignant transformation analysis |
| Identification of the aberrant gene expression in precancerous and cancerous lesions by comparing the gene expression of stem-like cells in diseased tissues with normal stem cells |
| Entrez ID | Symbol | Replicates | Species | Organ | Tissue | Adj P-value | Log2FC | Malignancy |
| 134265 | AFAP1L1 | HCC1_Meng | Human | Liver | HCC | 1.21e-16 | 2.06e-02 | 0.0246 |
| 134265 | AFAP1L1 | HCC1 | Human | Liver | HCC | 1.81e-11 | 1.84e+00 | 0.5336 |
| 134265 | AFAP1L1 | HCC2 | Human | Liver | HCC | 1.66e-23 | 2.25e+00 | 0.5341 |
| 134265 | AFAP1L1 | HCC5 | Human | Liver | HCC | 1.29e-38 | 2.02e+00 | 0.4932 |
| 134265 | AFAP1L1 | C04 | Human | Oral cavity | OSCC | 2.45e-11 | 4.90e-01 | 0.2633 |
| 134265 | AFAP1L1 | C21 | Human | Oral cavity | OSCC | 4.19e-11 | 2.86e-01 | 0.2678 |
| 134265 | AFAP1L1 | C30 | Human | Oral cavity | OSCC | 7.32e-21 | 6.37e-01 | 0.3055 |
| 134265 | AFAP1L1 | C51 | Human | Oral cavity | OSCC | 8.19e-05 | 2.09e-01 | 0.2674 |
| 134265 | AFAP1L1 | C06 | Human | Oral cavity | OSCC | 5.31e-08 | 8.49e-01 | 0.2699 |
| 134265 | AFAP1L1 | LN22 | Human | Oral cavity | OSCC | 2.01e-02 | 2.60e-01 | 0.1733 |
| 134265 | AFAP1L1 | SYSMH3 | Human | Oral cavity | OSCC | 8.54e-04 | 1.57e-01 | 0.2442 |
| Page: 1 |
| Tissue | Expression Dynamics | Abbreviation |
| Liver | 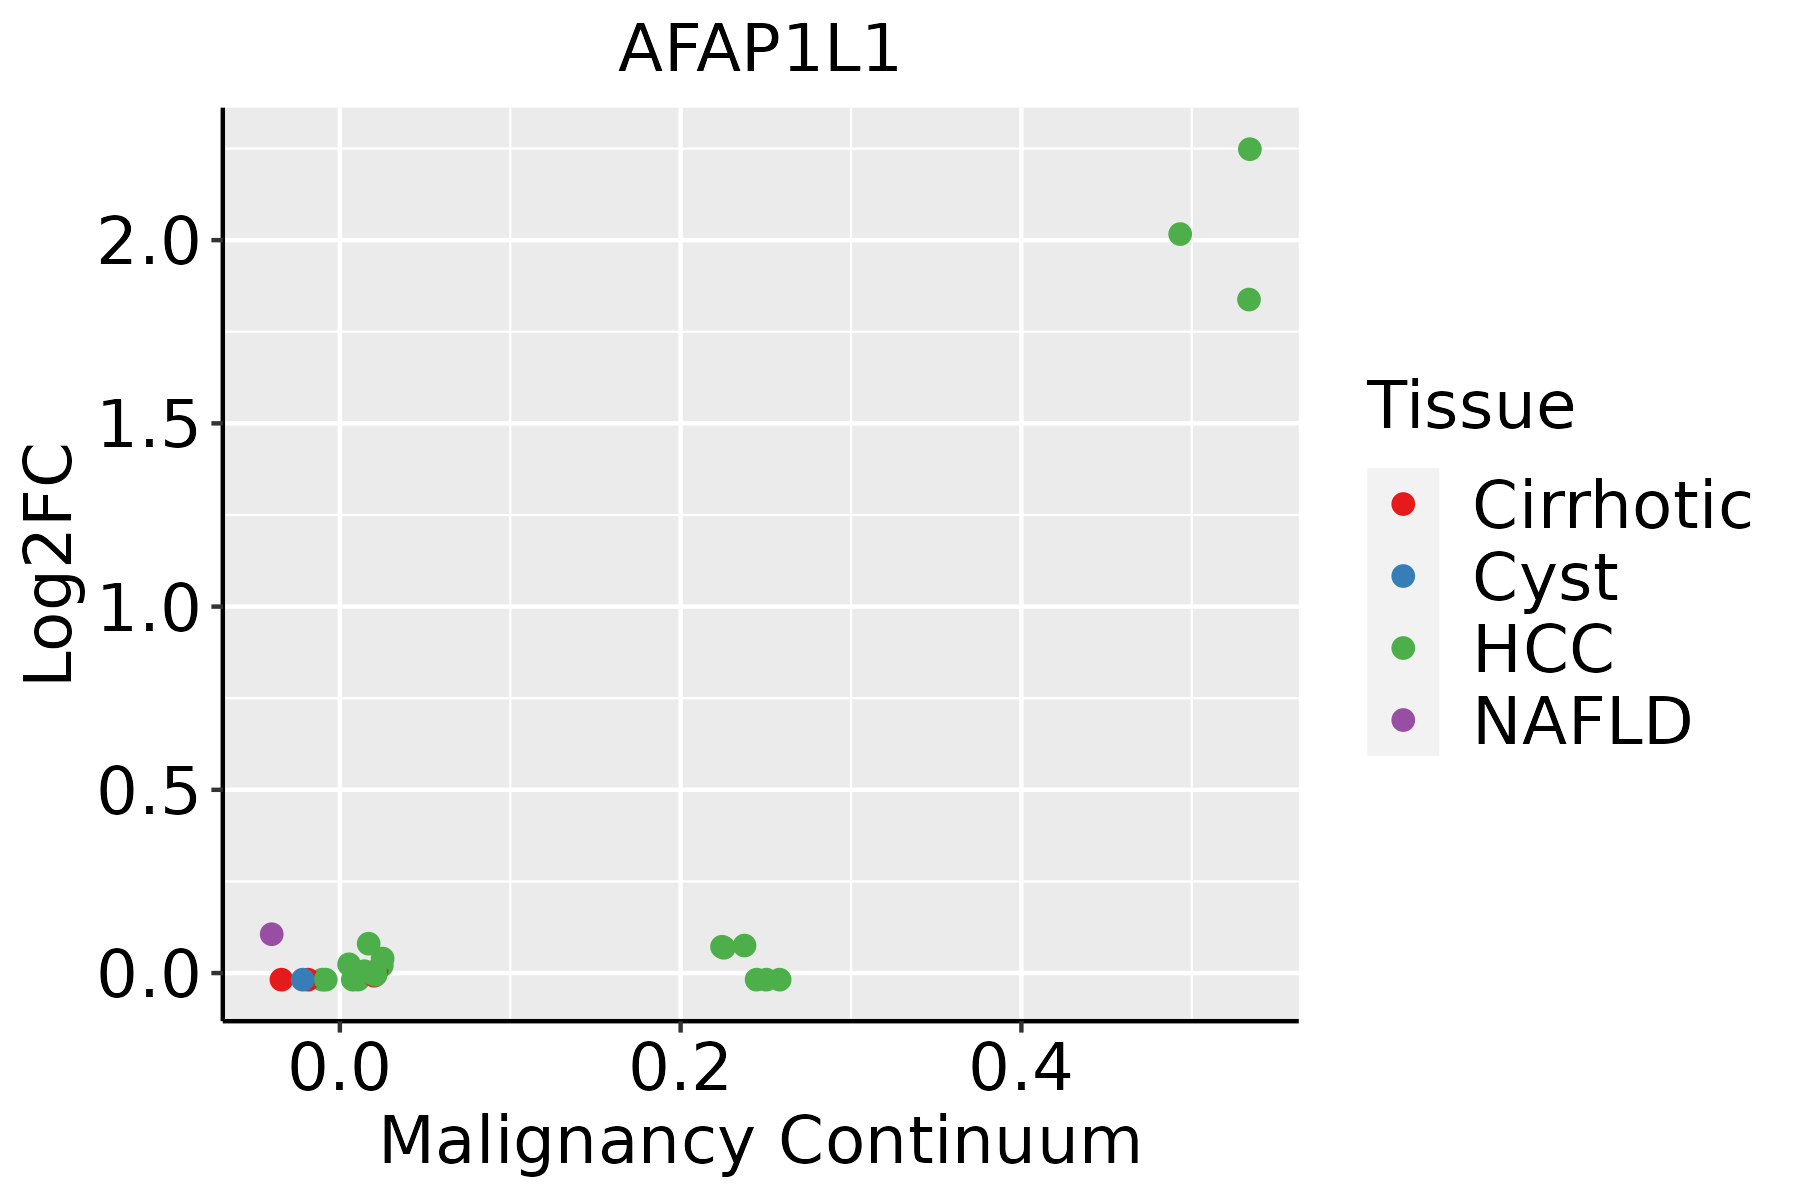 | HCC: Hepatocellular carcinoma |
| NAFLD: Non-alcoholic fatty liver disease | ||
| Oral Cavity |  | EOLP: Erosive Oral lichen planus |
| LP: leukoplakia | ||
| NEOLP: Non-erosive oral lichen planus | ||
| OSCC: Oral squamous cell carcinoma |
| ∗log2FC in expression of this searched gene in stem-like cells from each diseased tissue sample relative to stem-like cells in normal samples in each tissue plotted against the malignancy continuum. Samples are colored based on if they are from different disease stage. |
Top |
Malignant transformation related pathway analysis |
| Find out the enriched GO biological processes and KEGG pathways involved in transition from healthy to precancer to cancer |
| Tissue | Disease Stage | Enriched GO biological Processes |
| Colorectum | AD |  |
| Colorectum | SER |  |
| Colorectum | MSS |  |
| Colorectum | MSI-H |  |
| Colorectum | FAP |  |
| ∗Top 15 enriched GO BP terms are showed in the bar plot of each disease state in each tissue. Each row represents a significant GO biological process which is colored according to the -log10(p.adjust). |
| Page: 1 2 3 4 5 6 7 8 9 |
| GO ID | Tissue | Disease Stage | Description | Gene Ratio | Bg Ratio | pvalue | p.adjust | Count |
| Page: 1 |
| Pathway ID | Tissue | Disease Stage | Description | Gene Ratio | Bg Ratio | pvalue | p.adjust | qvalue | Count |
| Page: 1 |
Top |
Cell-cell communication analysis |
| Identification of potential cell-cell interactions between two cell types and their ligand-receptor pairs for different disease states |
| Ligand | Receptor | LRpair | Pathway | Tissue | Disease Stage |
| Page: 1 |
Top |
Single-cell gene regulatory network inference analysis |
| Find out the significant the regulons (TFs) and the target genes of each regulon across cell types for different disease states |
| TF | Cell Type | Tissue | Disease Stage | Target Gene | RSS | Regulon Activity |
| ∗The dot plots of a searched regulon are shown for all cell subpopulations in each disease state of each tissue based on the regulon specific score inferred using pySCENIC and by calculating the average expression. |
| Page: 1 |
Top |
Somatic mutation of malignant transformation related genes |
| Annotation of somatic variants for genes involved in malignant transformation |
| Hugo Symbol | Variant Class | Variant Classification | dbSNP RS | HGVSc | HGVSp | HGVSp Short | SWISSPROT | BIOTYPE | SIFT | PolyPhen | Tumor Sample Barcode | Tissue | Histology | Sex | Age | Stage | Therapy Types | Drugs | Outcome |
| AFAP1L1 | SNV | Missense_Mutation | c.1976N>A | p.Gly659Glu | p.G659E | Q8TED9 | protein_coding | deleterious(0) | probably_damaging(0.999) | TCGA-AC-A23H-01 | Breast | breast invasive carcinoma | Female | >=65 | I/II | Unknown | Unknown | PD | |
| AFAP1L1 | SNV | Missense_Mutation | rs559848026 | c.1715N>A | p.Arg572His | p.R572H | Q8TED9 | protein_coding | tolerated(0.14) | benign(0.003) | TCGA-AN-A0AJ-01 | Breast | breast invasive carcinoma | Female | >=65 | I/II | Unknown | Unknown | SD |
| AFAP1L1 | SNV | Missense_Mutation | c.1856N>T | p.Ala619Val | p.A619V | Q8TED9 | protein_coding | tolerated(0.12) | probably_damaging(0.994) | TCGA-D8-A1XG-01 | Breast | breast invasive carcinoma | Female | >=65 | III/IV | Unknown | Unknown | SD | |
| AFAP1L1 | SNV | Missense_Mutation | novel | c.1807N>C | p.Ser603Pro | p.S603P | Q8TED9 | protein_coding | deleterious(0) | probably_damaging(0.986) | TCGA-E9-A295-01 | Breast | breast invasive carcinoma | Female | >=65 | I/II | Hormone Therapy | tamoxiphen | SD |
| AFAP1L1 | SNV | Missense_Mutation | c.1138G>T | p.Ala380Ser | p.A380S | Q8TED9 | protein_coding | tolerated(0.85) | benign(0.003) | TCGA-S3-AA10-01 | Breast | breast invasive carcinoma | Female | >=65 | I/II | Chemotherapy | cytoxan | CR | |
| AFAP1L1 | insertion | Frame_Shift_Ins | novel | c.2096_2097insT | p.Gln699HisfsTer25 | p.Q699Hfs*25 | Q8TED9 | protein_coding | TCGA-A2-A0D4-01 | Breast | breast invasive carcinoma | Female | <65 | I/II | Chemotherapy | adriamycin | SD | ||
| AFAP1L1 | insertion | Frame_Shift_Ins | novel | c.2097_2098insGGGGTAGTGGGGCAGGTGCAGTGGCTCATGCCTGTAA | p.Ser700GlyfsTer36 | p.S700Gfs*36 | Q8TED9 | protein_coding | TCGA-A2-A0D4-01 | Breast | breast invasive carcinoma | Female | <65 | I/II | Chemotherapy | adriamycin | SD | ||
| AFAP1L1 | insertion | Nonsense_Mutation | novel | c.2075_2076insATCTCGAAGGGGATTAGGTTTCAACATATGAAT | p.Ala692_Val693insSerArgArgGlyLeuGlyPheAsnIleTerIle | p.A692_V693insSRRGLGFNI*I | Q8TED9 | protein_coding | TCGA-BH-A0BA-01 | Breast | breast invasive carcinoma | Female | <65 | III/IV | Chemotherapy | cytoxan | SD | ||
| AFAP1L1 | deletion | Frame_Shift_Del | novel | c.300delN | p.Glu100AspfsTer2 | p.E100Dfs*2 | Q8TED9 | protein_coding | TCGA-EW-A2FV-01 | Breast | breast invasive carcinoma | Female | <65 | III/IV | Chemotherapy | docetaxel | SD | ||
| AFAP1L1 | SNV | Missense_Mutation | novel | c.1379C>T | p.Ala460Val | p.A460V | Q8TED9 | protein_coding | tolerated(0.22) | possibly_damaging(0.653) | TCGA-2W-A8YY-01 | Cervix | cervical & endocervical cancer | Female | <65 | I/II | Chemotherapy | cisplatin | CR |
| Page: 1 2 3 4 5 6 7 8 |
Top |
Related drugs of malignant transformation related genes |
| Identification of chemicals and drugs interact with genes involved in malignant transfromation |
| (DGIdb 4.0) |
| Entrez ID | Symbol | Category | Interaction Types | Drug Claim Name | Drug Name | PMIDs |
| Page: 1 |

Copyright 2023-Present -The University of Texas Health Science Center at Houston |