
|
|||||
|
 | |
| |
| |
| |
| |
| |
|
Gene: AFAP1 |
Gene summary for AFAP1 |
| Gene information | Species | Human | Gene symbol | AFAP1 | Gene ID | 60312 |
| Gene name | actin filament associated protein 1 | |
| Gene Alias | AFAP | |
| Cytomap | 4p16.1 | |
| Gene Type | protein-coding | GO ID | GO:0006996 | UniProtAcc | Q6ZRV0 |
Top |
Malignant transformation analysis |
| Identification of the aberrant gene expression in precancerous and cancerous lesions by comparing the gene expression of stem-like cells in diseased tissues with normal stem cells |
| Entrez ID | Symbol | Replicates | Species | Organ | Tissue | Adj P-value | Log2FC | Malignancy |
| 60312 | AFAP1 | LZE8T | Human | Esophagus | ESCC | 1.22e-03 | 1.70e-01 | 0.067 |
| 60312 | AFAP1 | LZE24T | Human | Esophagus | ESCC | 6.62e-04 | 2.11e-01 | 0.0596 |
| 60312 | AFAP1 | P1T-E | Human | Esophagus | ESCC | 1.06e-05 | 2.54e-01 | 0.0875 |
| 60312 | AFAP1 | P2T-E | Human | Esophagus | ESCC | 1.54e-21 | 4.55e-01 | 0.1177 |
| 60312 | AFAP1 | P4T-E | Human | Esophagus | ESCC | 1.22e-16 | 3.79e-01 | 0.1323 |
| 60312 | AFAP1 | P5T-E | Human | Esophagus | ESCC | 3.17e-03 | 1.43e-01 | 0.1327 |
| 60312 | AFAP1 | P8T-E | Human | Esophagus | ESCC | 1.06e-24 | 4.03e-01 | 0.0889 |
| 60312 | AFAP1 | P9T-E | Human | Esophagus | ESCC | 3.00e-09 | 2.05e-01 | 0.1131 |
| 60312 | AFAP1 | P10T-E | Human | Esophagus | ESCC | 5.19e-09 | 2.25e-01 | 0.116 |
| 60312 | AFAP1 | P11T-E | Human | Esophagus | ESCC | 1.03e-10 | 4.61e-01 | 0.1426 |
| 60312 | AFAP1 | P12T-E | Human | Esophagus | ESCC | 1.72e-18 | 3.62e-01 | 0.1122 |
| 60312 | AFAP1 | P15T-E | Human | Esophagus | ESCC | 2.38e-06 | 2.37e-01 | 0.1149 |
| 60312 | AFAP1 | P16T-E | Human | Esophagus | ESCC | 4.75e-13 | 3.29e-01 | 0.1153 |
| 60312 | AFAP1 | P19T-E | Human | Esophagus | ESCC | 1.11e-04 | 5.04e-01 | 0.1662 |
| 60312 | AFAP1 | P20T-E | Human | Esophagus | ESCC | 3.80e-08 | 3.38e-01 | 0.1124 |
| 60312 | AFAP1 | P21T-E | Human | Esophagus | ESCC | 5.63e-10 | 2.44e-01 | 0.1617 |
| 60312 | AFAP1 | P22T-E | Human | Esophagus | ESCC | 4.03e-03 | 1.32e-01 | 0.1236 |
| 60312 | AFAP1 | P23T-E | Human | Esophagus | ESCC | 4.42e-06 | 2.08e-01 | 0.108 |
| 60312 | AFAP1 | P24T-E | Human | Esophagus | ESCC | 7.34e-09 | 2.22e-01 | 0.1287 |
| 60312 | AFAP1 | P26T-E | Human | Esophagus | ESCC | 1.28e-14 | 2.18e-01 | 0.1276 |
| Page: 1 2 3 4 |
| Tissue | Expression Dynamics | Abbreviation |
| Esophagus | 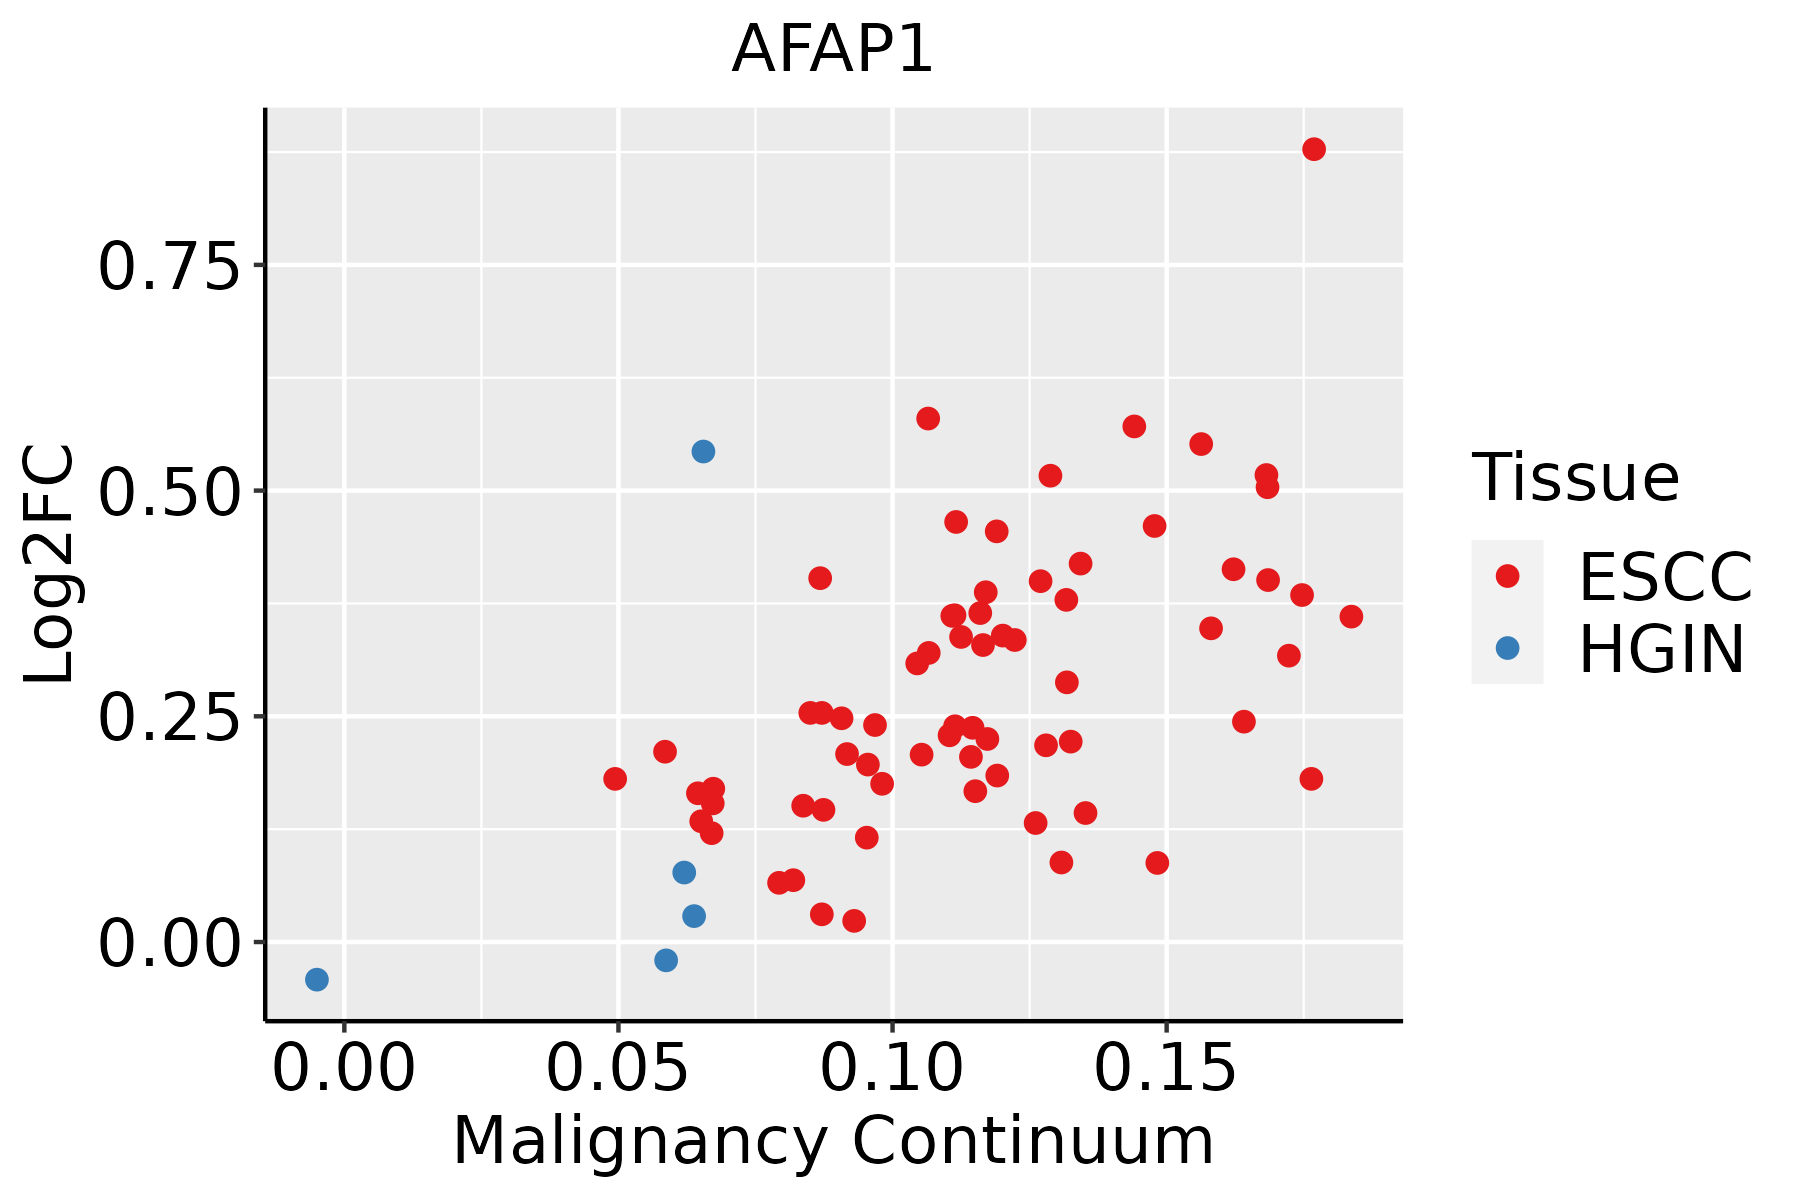 | ESCC: Esophageal squamous cell carcinoma |
| HGIN: High-grade intraepithelial neoplasias | ||
| LGIN: Low-grade intraepithelial neoplasias | ||
| Thyroid | 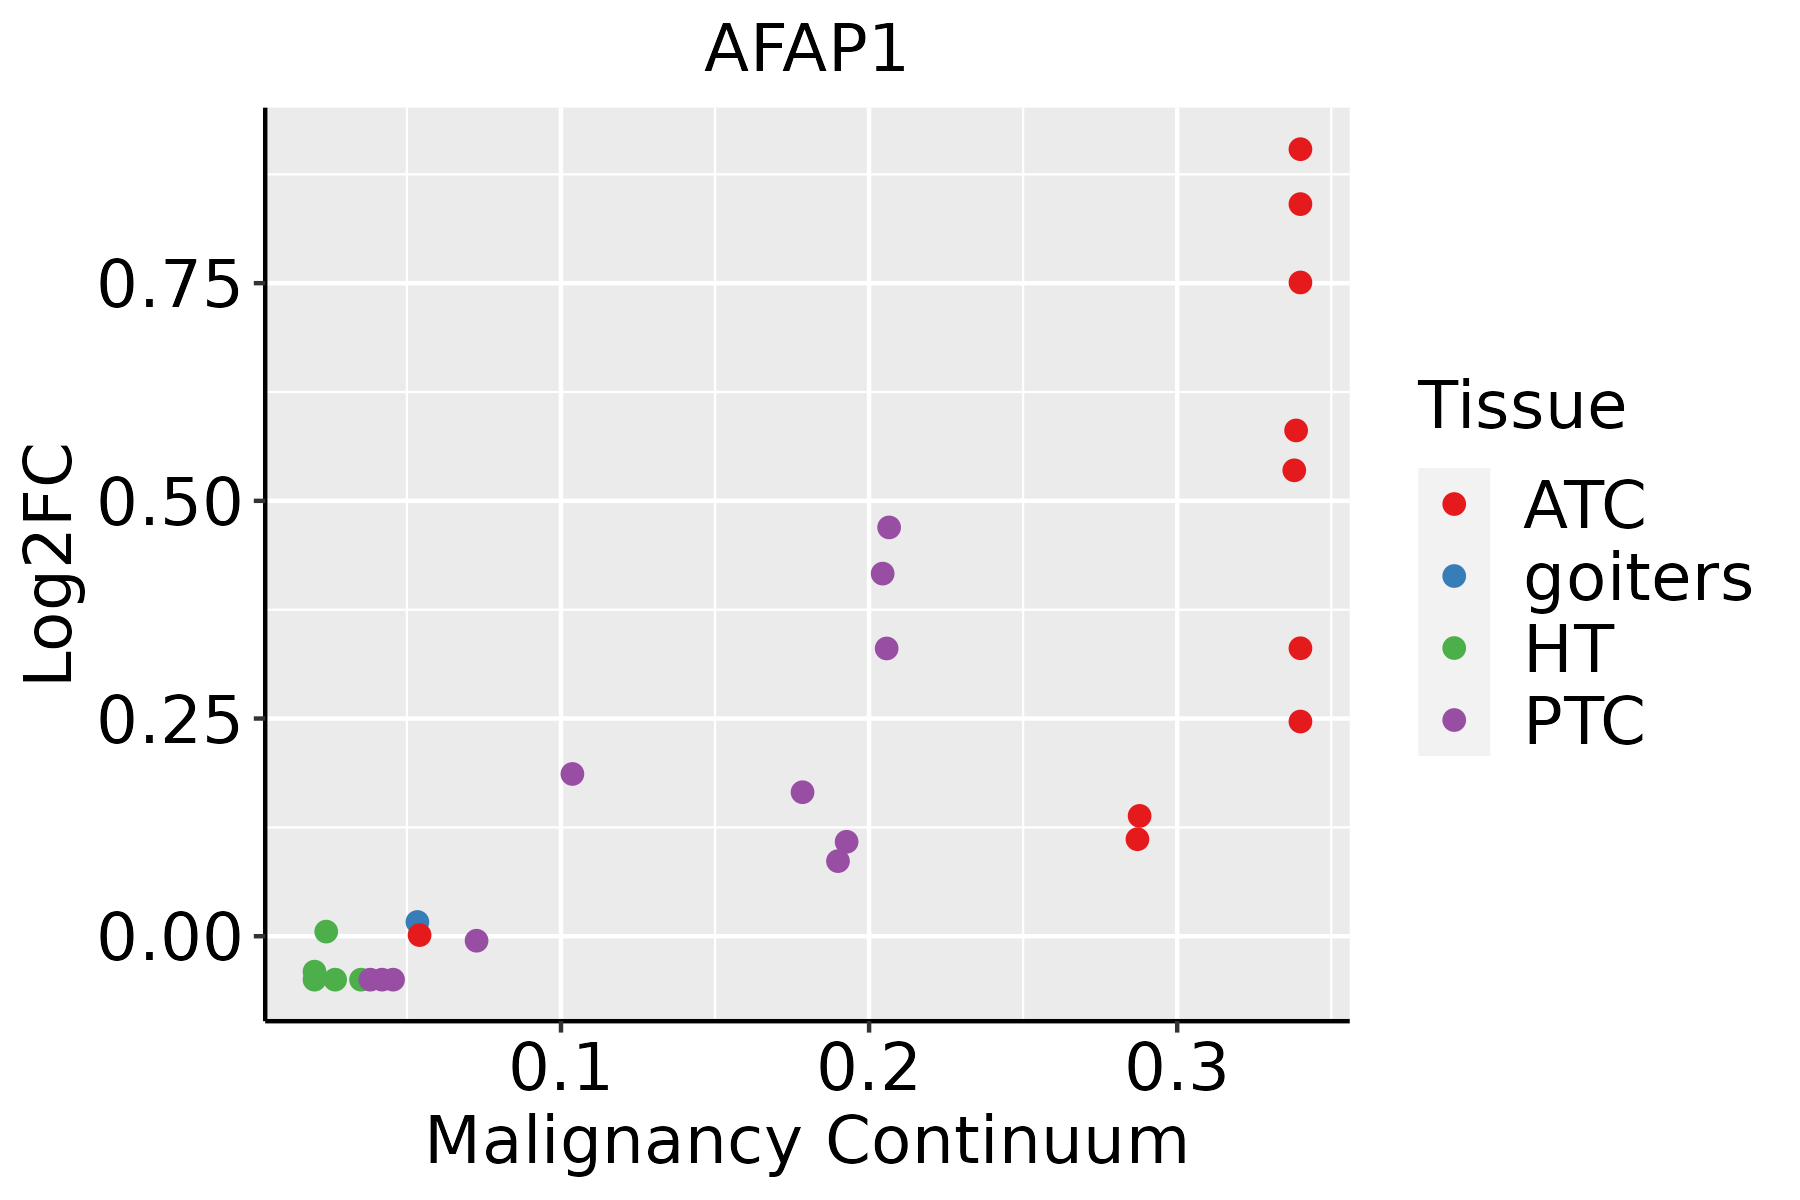 | ATC: Anaplastic thyroid cancer |
| HT: Hashimoto's thyroiditis | ||
| PTC: Papillary thyroid cancer |
| ∗log2FC in expression of this searched gene in stem-like cells from each diseased tissue sample relative to stem-like cells in normal samples in each tissue plotted against the malignancy continuum. Samples are colored based on if they are from different disease stage. |
Top |
Malignant transformation related pathway analysis |
| Find out the enriched GO biological processes and KEGG pathways involved in transition from healthy to precancer to cancer |
| Tissue | Disease Stage | Enriched GO biological Processes |
| Colorectum | AD |  |
| Colorectum | SER |  |
| Colorectum | MSS |  |
| Colorectum | MSI-H |  |
| Colorectum | FAP |  |
| ∗Top 15 enriched GO BP terms are showed in the bar plot of each disease state in each tissue. Each row represents a significant GO biological process which is colored according to the -log10(p.adjust). |
| Page: 1 2 3 4 5 6 7 8 9 |
| GO ID | Tissue | Disease Stage | Description | Gene Ratio | Bg Ratio | pvalue | p.adjust | Count |
| GO:000734615 | Esophagus | ESCC | regulation of mitotic cell cycle | 293/8552 | 457/18723 | 8.00e-16 | 5.64e-14 | 293 |
| GO:003812718 | Esophagus | ESCC | ERBB signaling pathway | 82/8552 | 121/18723 | 7.23e-07 | 9.40e-06 | 82 |
| GO:000717318 | Esophagus | ESCC | epidermal growth factor receptor signaling pathway | 73/8552 | 108/18723 | 3.36e-06 | 3.73e-05 | 73 |
| GO:004586018 | Esophagus | ESCC | positive regulation of protein kinase activity | 219/8552 | 386/18723 | 6.91e-06 | 6.97e-05 | 219 |
| GO:003367420 | Esophagus | ESCC | positive regulation of kinase activity | 260/8552 | 467/18723 | 7.26e-06 | 7.22e-05 | 260 |
| GO:190118413 | Esophagus | ESCC | regulation of ERBB signaling pathway | 54/8552 | 79/18723 | 3.81e-05 | 3.08e-04 | 54 |
| GO:00420588 | Esophagus | ESCC | regulation of epidermal growth factor receptor signaling pathway | 50/8552 | 73/18723 | 6.75e-05 | 5.12e-04 | 50 |
| GO:00182124 | Esophagus | ESCC | peptidyl-tyrosine modification | 202/8552 | 378/18723 | 1.34e-03 | 6.39e-03 | 202 |
| GO:00181084 | Esophagus | ESCC | peptidyl-tyrosine phosphorylation | 200/8552 | 375/18723 | 1.60e-03 | 7.45e-03 | 200 |
| GO:00507303 | Esophagus | ESCC | regulation of peptidyl-tyrosine phosphorylation | 144/8552 | 264/18723 | 2.22e-03 | 9.78e-03 | 144 |
| GO:00610972 | Esophagus | ESCC | regulation of protein tyrosine kinase activity | 55/8552 | 90/18723 | 2.27e-03 | 9.99e-03 | 55 |
| GO:000181916 | Esophagus | ESCC | positive regulation of cytokine production | 244/8552 | 467/18723 | 2.29e-03 | 1.01e-02 | 244 |
| GO:00073469 | Oral cavity | OSCC | regulation of mitotic cell cycle | 266/7305 | 457/18723 | 3.87e-17 | 3.41e-15 | 266 |
| GO:003812715 | Oral cavity | OSCC | ERBB signaling pathway | 76/7305 | 121/18723 | 9.59e-08 | 1.66e-06 | 76 |
| GO:000717315 | Oral cavity | OSCC | epidermal growth factor receptor signaling pathway | 67/7305 | 108/18723 | 1.04e-06 | 1.40e-05 | 67 |
| GO:004586016 | Oral cavity | OSCC | positive regulation of protein kinase activity | 194/7305 | 386/18723 | 3.90e-06 | 4.59e-05 | 194 |
| GO:003367418 | Oral cavity | OSCC | positive regulation of kinase activity | 228/7305 | 467/18723 | 8.31e-06 | 8.90e-05 | 228 |
| GO:19011847 | Oral cavity | OSCC | regulation of ERBB signaling pathway | 50/7305 | 79/18723 | 1.06e-05 | 1.12e-04 | 50 |
| GO:00420587 | Oral cavity | OSCC | regulation of epidermal growth factor receptor signaling pathway | 46/7305 | 73/18723 | 2.80e-05 | 2.59e-04 | 46 |
| GO:00182123 | Oral cavity | OSCC | peptidyl-tyrosine modification | 180/7305 | 378/18723 | 3.63e-04 | 2.22e-03 | 180 |
| Page: 1 2 3 |
| Pathway ID | Tissue | Disease Stage | Description | Gene Ratio | Bg Ratio | pvalue | p.adjust | qvalue | Count |
| Page: 1 |
Top |
Cell-cell communication analysis |
| Identification of potential cell-cell interactions between two cell types and their ligand-receptor pairs for different disease states |
| Ligand | Receptor | LRpair | Pathway | Tissue | Disease Stage |
| Page: 1 |
Top |
Single-cell gene regulatory network inference analysis |
| Find out the significant the regulons (TFs) and the target genes of each regulon across cell types for different disease states |
| TF | Cell Type | Tissue | Disease Stage | Target Gene | RSS | Regulon Activity |
| ∗The dot plots of a searched regulon are shown for all cell subpopulations in each disease state of each tissue based on the regulon specific score inferred using pySCENIC and by calculating the average expression. |
| Page: 1 |
Top |
Somatic mutation of malignant transformation related genes |
| Annotation of somatic variants for genes involved in malignant transformation |
| Hugo Symbol | Variant Class | Variant Classification | dbSNP RS | HGVSc | HGVSp | HGVSp Short | SWISSPROT | BIOTYPE | SIFT | PolyPhen | Tumor Sample Barcode | Tissue | Histology | Sex | Age | Stage | Therapy Types | Drugs | Outcome |
| AFAP1 | SNV | Missense_Mutation | c.755G>T | p.Ser252Ile | p.S252I | Q8N556 | protein_coding | deleterious(0.02) | benign(0.046) | TCGA-A8-A06Z-01 | Breast | breast invasive carcinoma | Female | >=65 | I/II | Unknown | Unknown | SD | |
| AFAP1 | SNV | Missense_Mutation | c.1627N>T | p.Pro543Ser | p.P543S | Q8N556 | protein_coding | tolerated(0.42) | benign(0.158) | TCGA-GM-A2DI-01 | Breast | breast invasive carcinoma | Female | <65 | I/II | Chemotherapy | taxotere | CR | |
| AFAP1 | SNV | Missense_Mutation | novel | c.2207N>G | p.Thr736Ser | p.T736S | Q8N556 | protein_coding | tolerated(0.12) | probably_damaging(0.97) | TCGA-HN-A2NL-01 | Breast | breast invasive carcinoma | Female | <65 | I/II | Chemotherapy | cyclophosphamide | SD |
| AFAP1 | SNV | Missense_Mutation | rs768316774 | c.1082G>A | p.Arg361His | p.R361H | Q8N556 | protein_coding | tolerated(0.51) | probably_damaging(0.995) | TCGA-2W-A8YY-01 | Cervix | cervical & endocervical cancer | Female | <65 | I/II | Chemotherapy | cisplatin | CR |
| AFAP1 | SNV | Missense_Mutation | c.500N>A | p.Gly167Asp | p.G167D | Q8N556 | protein_coding | deleterious(0) | probably_damaging(1) | TCGA-A6-5661-01 | Colorectum | colon adenocarcinoma | Female | >=65 | I/II | Unknown | Unknown | SD | |
| AFAP1 | SNV | Missense_Mutation | c.1298T>C | p.Ile433Thr | p.I433T | Q8N556 | protein_coding | deleterious(0) | benign(0.324) | TCGA-AA-3710-01 | Colorectum | colon adenocarcinoma | Female | >=65 | I/II | Unknown | Unknown | SD | |
| AFAP1 | SNV | Missense_Mutation | c.460N>A | p.Ala154Thr | p.A154T | Q8N556 | protein_coding | deleterious(0.03) | probably_damaging(0.998) | TCGA-AA-3815-01 | Colorectum | colon adenocarcinoma | Female | >=65 | I/II | Unknown | Unknown | SD | |
| AFAP1 | SNV | Missense_Mutation | rs768168136 | c.2287T>G | p.Ser763Ala | p.S763A | Q8N556 | protein_coding | tolerated(0.11) | probably_damaging(0.97) | TCGA-AA-3966-01 | Colorectum | colon adenocarcinoma | Female | >=65 | I/II | Unknown | Unknown | SD |
| AFAP1 | SNV | Missense_Mutation | rs143249636 | c.26N>A | p.Arg9His | p.R9H | Q8N556 | protein_coding | deleterious(0.05) | possibly_damaging(0.483) | TCGA-AA-A00N-01 | Colorectum | colon adenocarcinoma | Male | >=65 | I/II | Unknown | Unknown | PD |
| AFAP1 | SNV | Missense_Mutation | c.915N>T | p.Lys305Asn | p.K305N | Q8N556 | protein_coding | deleterious(0) | possibly_damaging(0.848) | TCGA-AA-A010-01 | Colorectum | colon adenocarcinoma | Female | <65 | I/II | Chemotherapy | folinic | CR |
| Page: 1 2 3 4 5 6 7 8 9 |
Top |
Related drugs of malignant transformation related genes |
| Identification of chemicals and drugs interact with genes involved in malignant transfromation |
| (DGIdb 4.0) |
| Entrez ID | Symbol | Category | Interaction Types | Drug Claim Name | Drug Name | PMIDs |
| Page: 1 |

Copyright 2023-Present -The University of Texas Health Science Center at Houston |