
|
|||||
|
 | |
| |
| |
| |
| |
| |
|
Gene: AES |
Gene summary for AES |
| Gene information | Species | Human | Gene symbol | AES | Gene ID | 166 |
| Gene name | TLE family member 5, transcriptional modulator | |
| Gene Alias | AES | |
| Cytomap | 19p13.3 | |
| Gene Type | protein-coding | GO ID | GO:0000122 | UniProtAcc | Q08117 |
Top |
Malignant transformation analysis |
| Identification of the aberrant gene expression in precancerous and cancerous lesions by comparing the gene expression of stem-like cells in diseased tissues with normal stem cells |
| Entrez ID | Symbol | Replicates | Species | Organ | Tissue | Adj P-value | Log2FC | Malignancy |
| 166 | AES | GSM4909296 | Human | Breast | IDC | 2.48e-04 | -7.86e-02 | 0.1524 |
| 166 | AES | GSM4909297 | Human | Breast | IDC | 1.37e-12 | -3.53e-01 | 0.1517 |
| 166 | AES | GSM4909311 | Human | Breast | IDC | 4.20e-25 | -1.48e-01 | 0.1534 |
| 166 | AES | GSM4909312 | Human | Breast | IDC | 2.02e-08 | -2.57e-01 | 0.1552 |
| 166 | AES | GSM4909319 | Human | Breast | IDC | 1.30e-31 | -2.36e-01 | 0.1563 |
| 166 | AES | GSM4909320 | Human | Breast | IDC | 1.78e-03 | -3.79e-01 | 0.1575 |
| 166 | AES | GSM4909321 | Human | Breast | IDC | 2.41e-13 | -3.18e-01 | 0.1559 |
| 166 | AES | brca3 | Human | Breast | Precancer | 2.79e-03 | -4.33e-02 | -0.0263 |
| 166 | AES | M1 | Human | Breast | IDC | 5.20e-11 | 5.30e-01 | 0.1577 |
| 166 | AES | NCCBC14 | Human | Breast | DCIS | 4.23e-05 | 8.50e-02 | 0.2021 |
| 166 | AES | NCCBC5 | Human | Breast | DCIS | 5.88e-12 | -1.54e-01 | 0.2046 |
| 166 | AES | P1 | Human | Breast | IDC | 1.16e-18 | 8.45e-02 | 0.1527 |
| 166 | AES | DCIS2 | Human | Breast | DCIS | 5.08e-62 | 5.44e-01 | 0.0085 |
| 166 | AES | AEH-subject1 | Human | Endometrium | AEH | 4.08e-58 | -7.32e-01 | -0.3059 |
| 166 | AES | AEH-subject2 | Human | Endometrium | AEH | 4.26e-53 | -7.32e-01 | -0.2525 |
| 166 | AES | AEH-subject3 | Human | Endometrium | AEH | 4.08e-58 | -7.32e-01 | -0.2576 |
| 166 | AES | AEH-subject4 | Human | Endometrium | AEH | 5.04e-42 | -7.32e-01 | -0.2657 |
| 166 | AES | AEH-subject5 | Human | Endometrium | AEH | 4.08e-58 | -7.32e-01 | -0.2953 |
| 166 | AES | EEC-subject1 | Human | Endometrium | EEC | 4.01e-57 | -7.32e-01 | -0.2682 |
| 166 | AES | EEC-subject2 | Human | Endometrium | EEC | 1.28e-59 | -7.32e-01 | -0.2607 |
| Page: 1 2 3 4 5 6 7 8 9 10 |
| Tissue | Expression Dynamics | Abbreviation |
| Breast |  | IDC: Invasive ductal carcinoma |
| DCIS: Ductal carcinoma in situ | ||
| Precancer(BRCA1-mut): Precancerous lesion from BRCA1 mutation carriers | ||
| Endometrium | 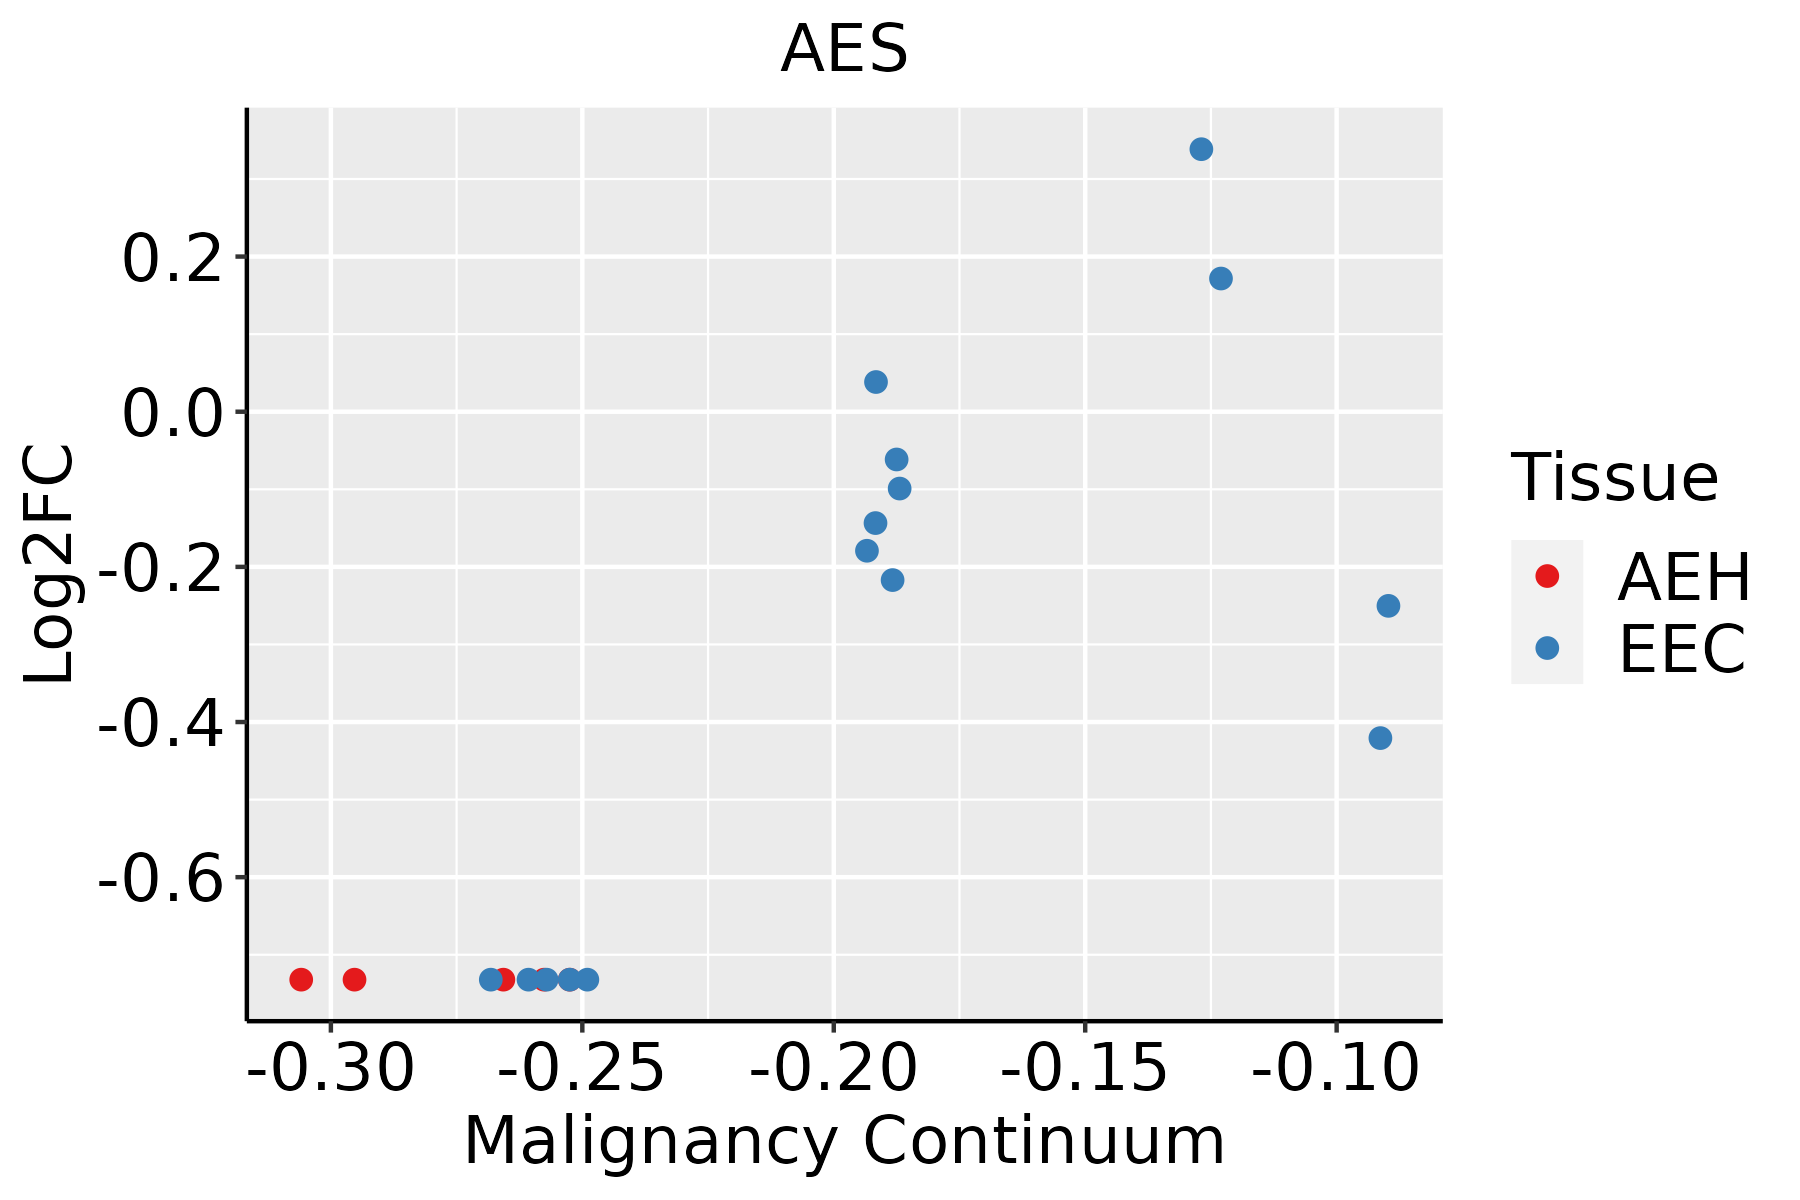 | AEH: Atypical endometrial hyperplasia |
| EEC: Endometrioid Cancer | ||
| Esophagus | 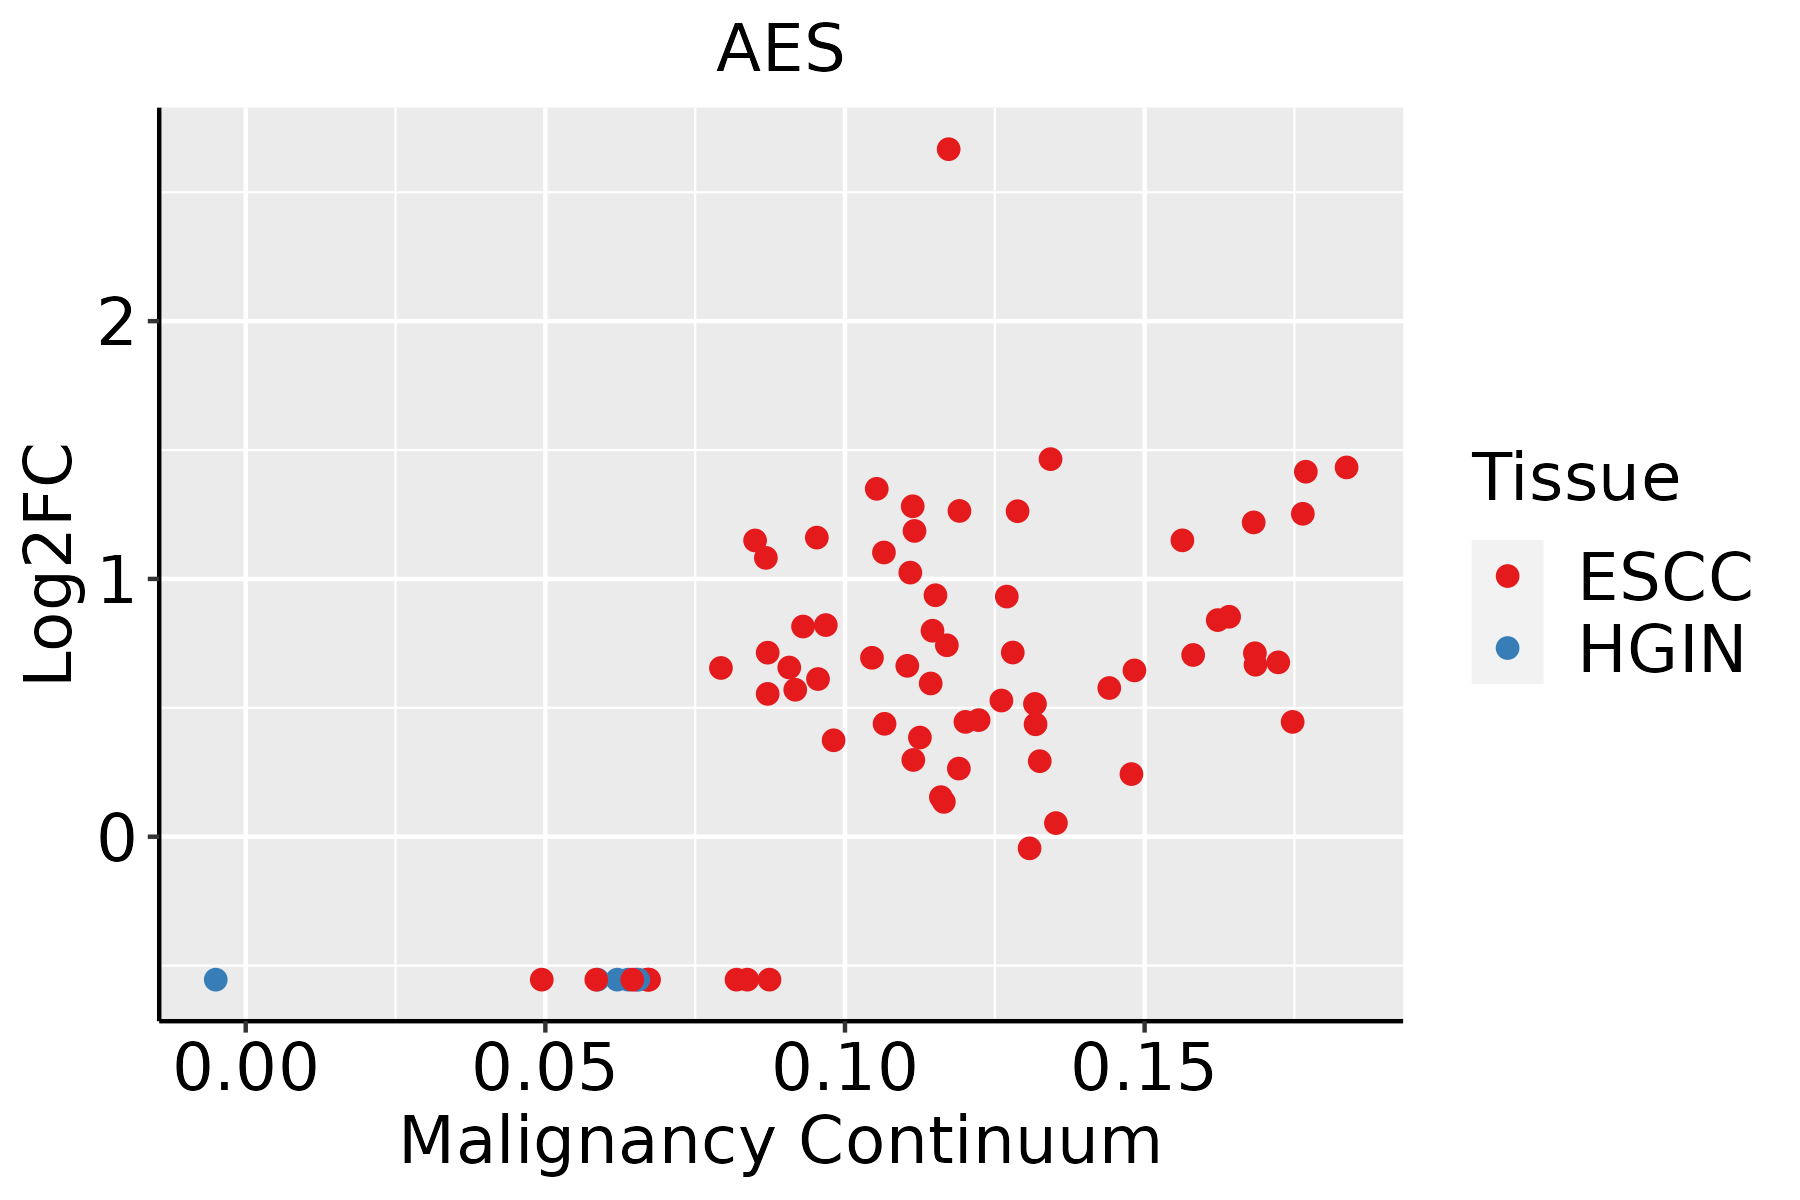 | ESCC: Esophageal squamous cell carcinoma |
| HGIN: High-grade intraepithelial neoplasias | ||
| LGIN: Low-grade intraepithelial neoplasias | ||
| Liver | 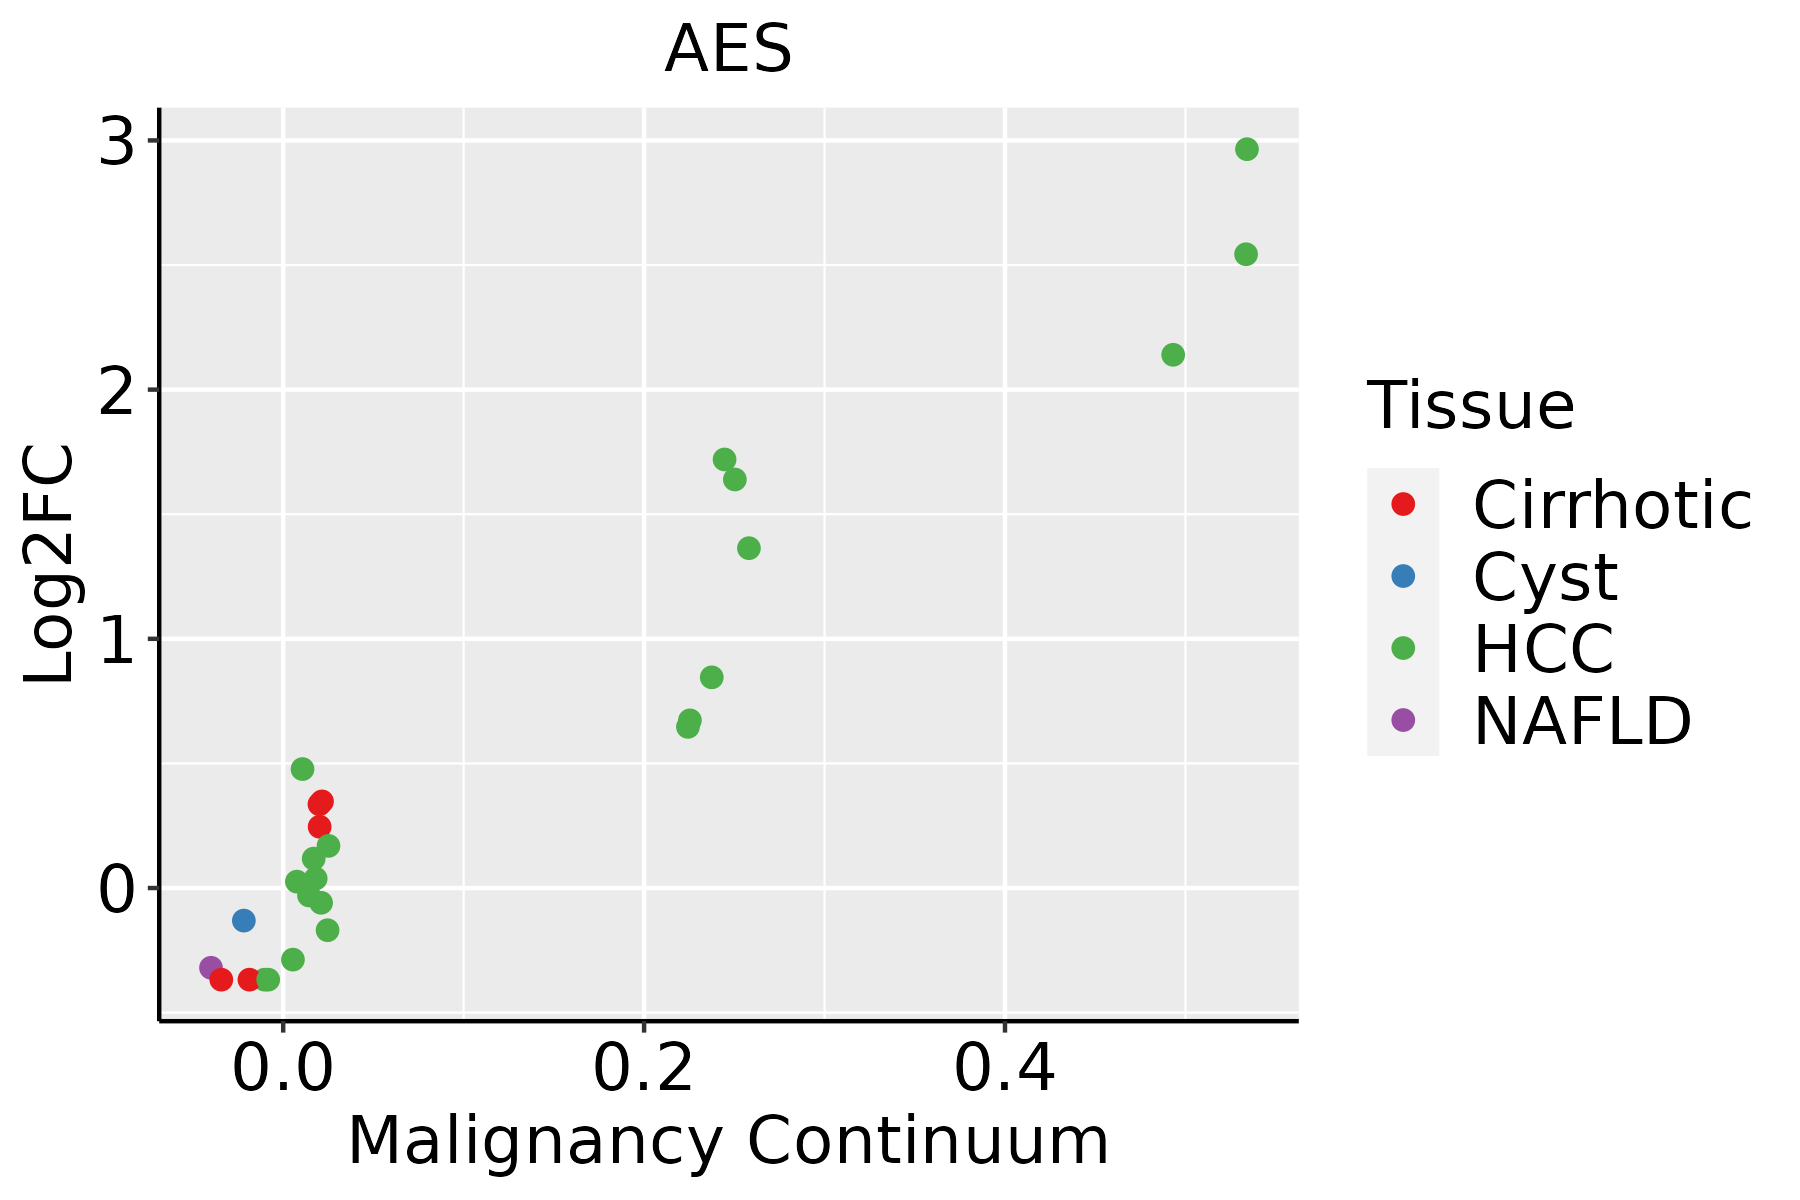 | HCC: Hepatocellular carcinoma |
| NAFLD: Non-alcoholic fatty liver disease | ||
| Oral Cavity |  | EOLP: Erosive Oral lichen planus |
| LP: leukoplakia | ||
| NEOLP: Non-erosive oral lichen planus | ||
| OSCC: Oral squamous cell carcinoma | ||
| Prostate | 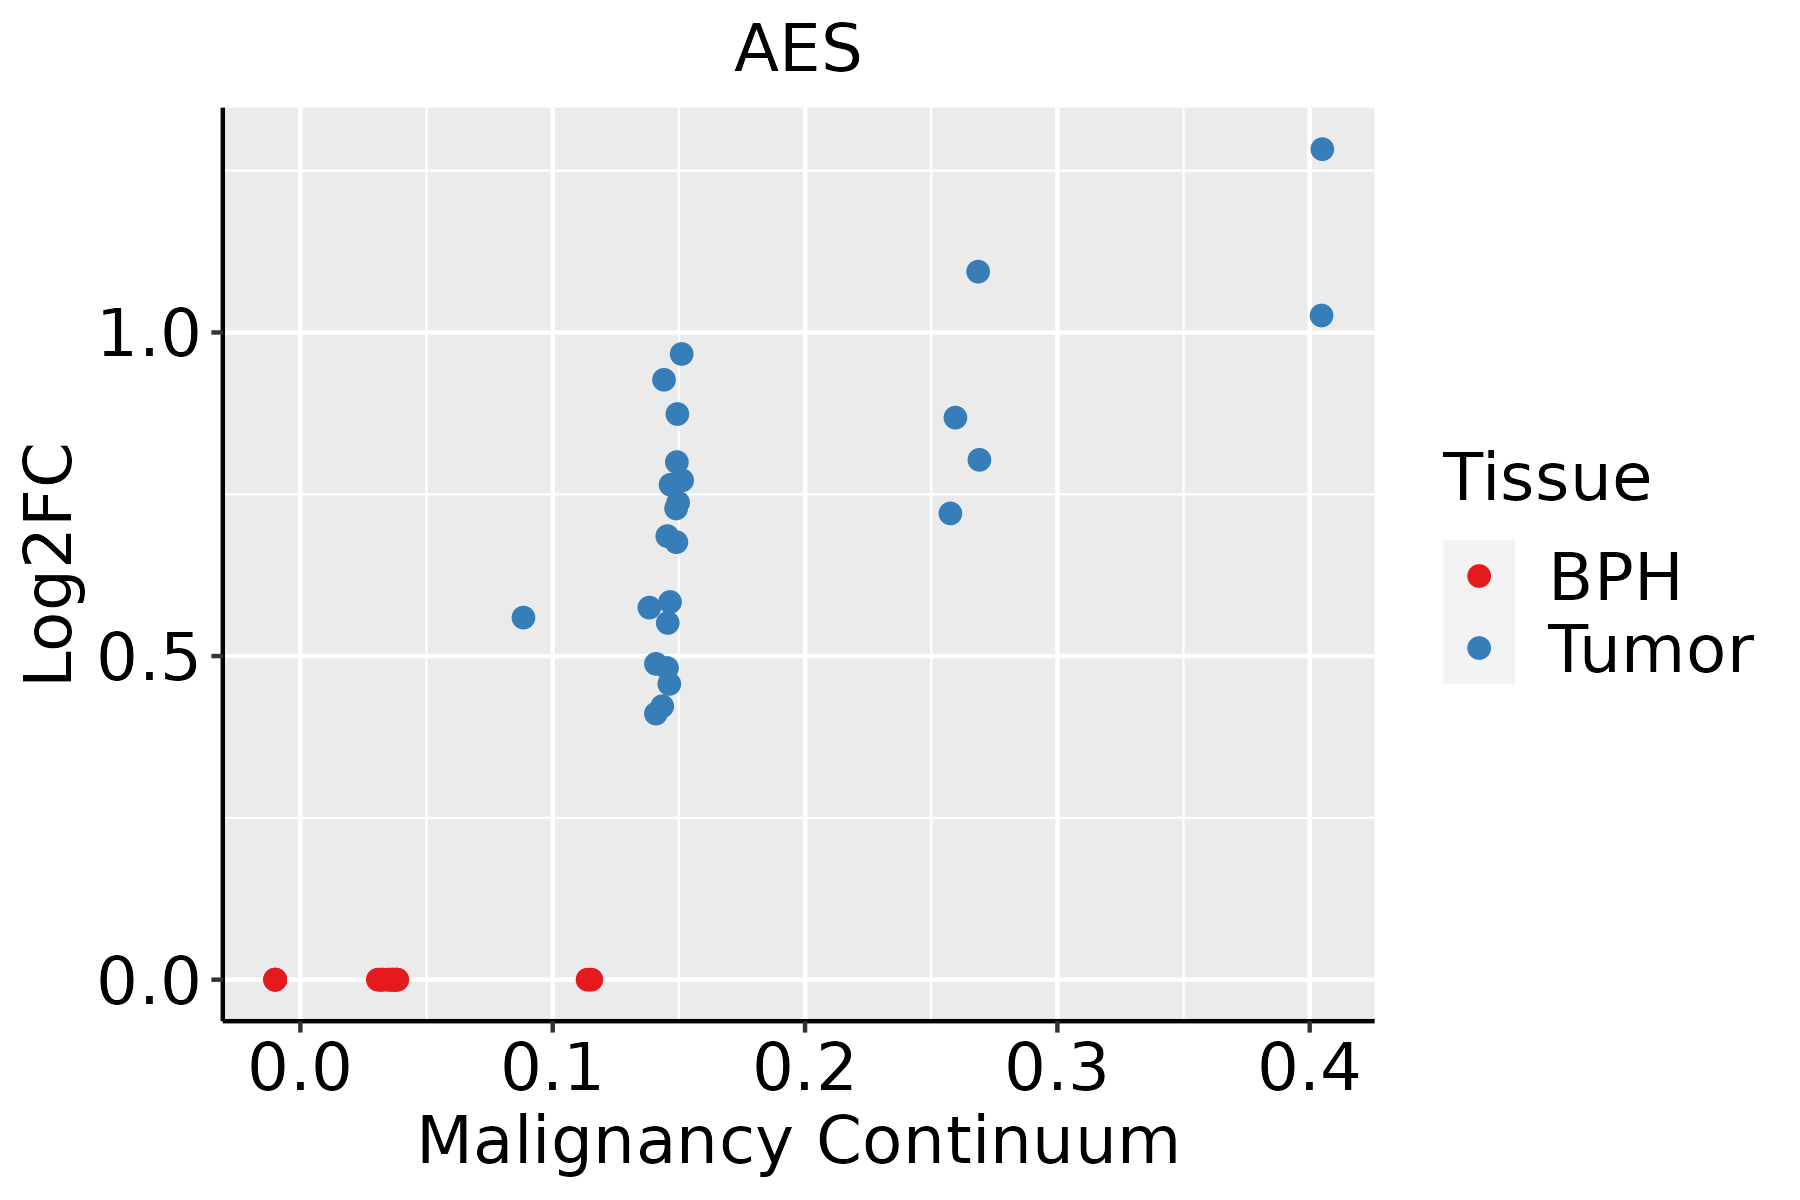 | BPH: Benign Prostatic Hyperplasia |
| Skin | 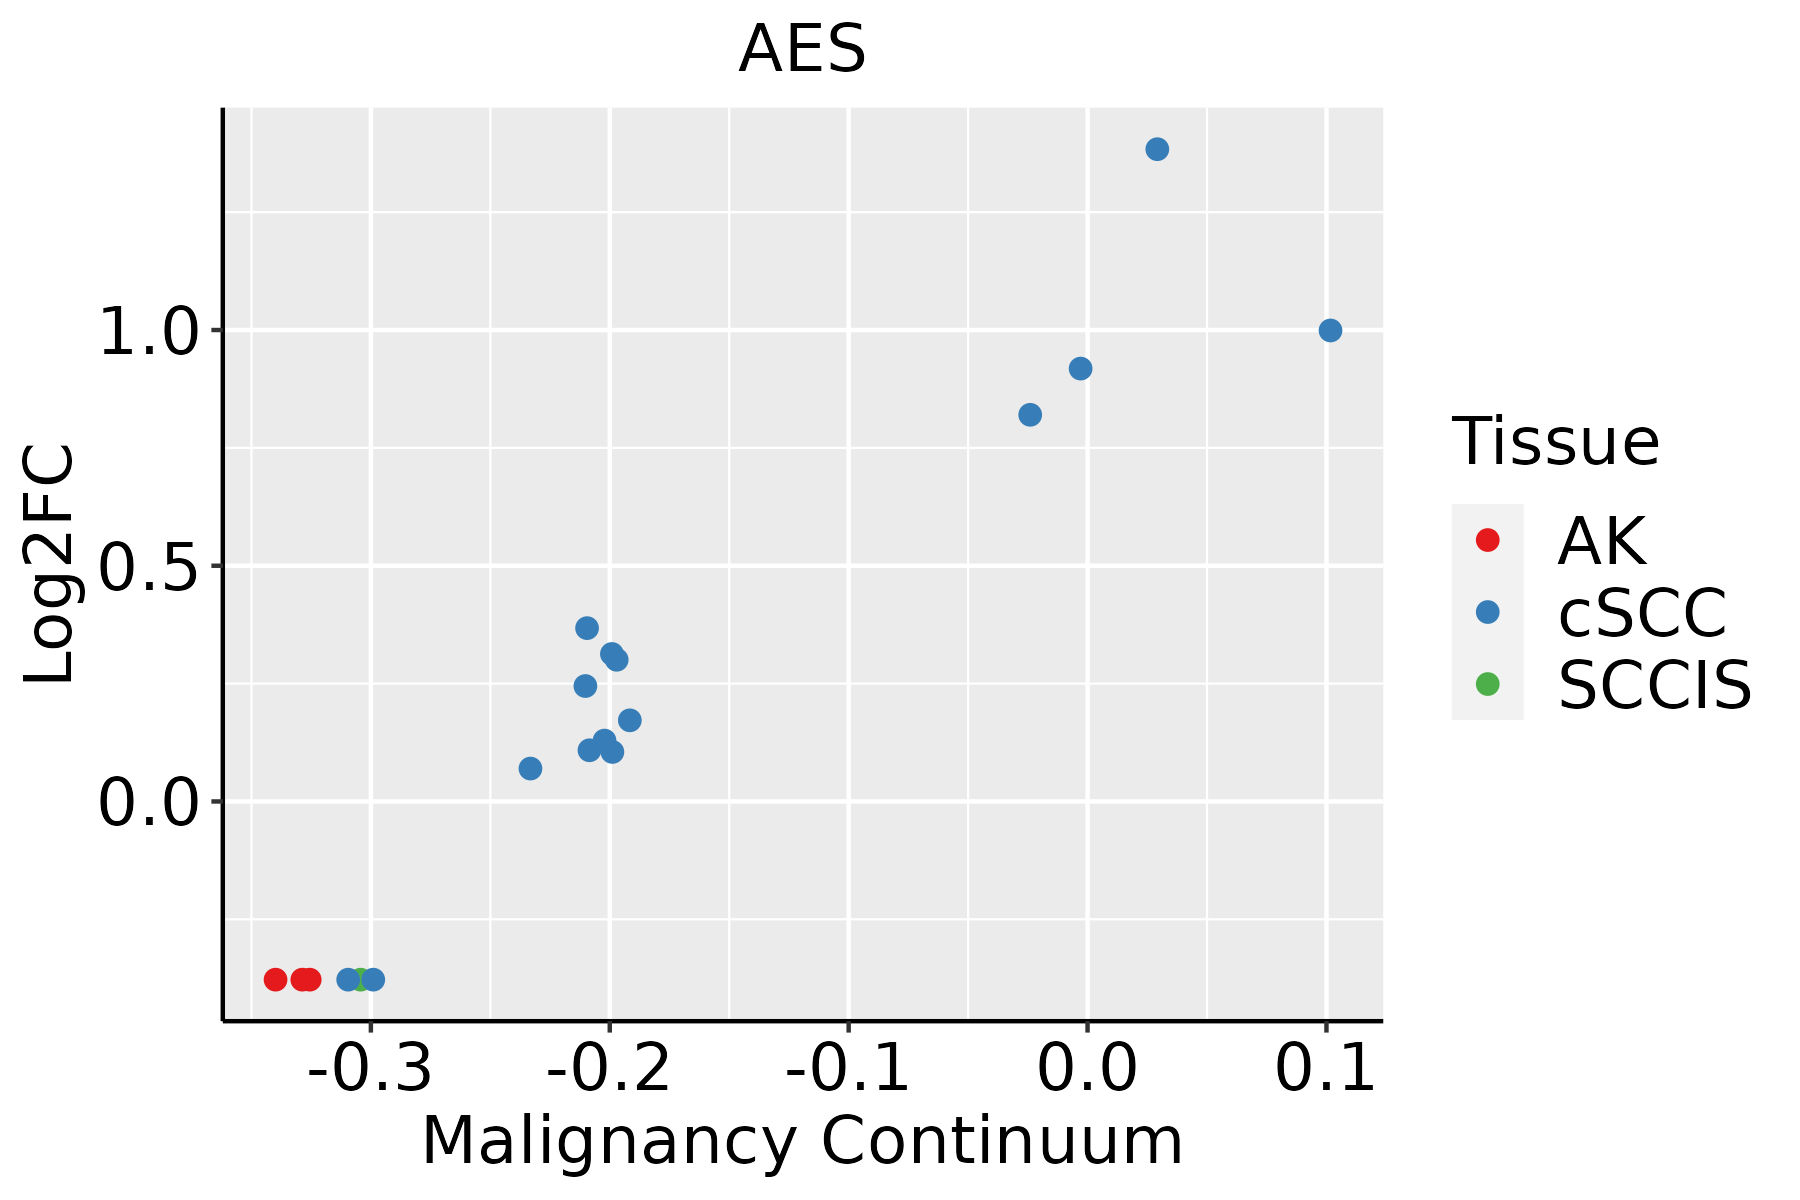 | AK: Actinic keratosis |
| cSCC: Cutaneous squamous cell carcinoma | ||
| SCCIS:squamous cell carcinoma in situ | ||
| Thyroid |  | ATC: Anaplastic thyroid cancer |
| HT: Hashimoto's thyroiditis | ||
| PTC: Papillary thyroid cancer |
| ∗log2FC in expression of this searched gene in stem-like cells from each diseased tissue sample relative to stem-like cells in normal samples in each tissue plotted against the malignancy continuum. Samples are colored based on if they are from different disease stage. |
Top |
Malignant transformation related pathway analysis |
| Find out the enriched GO biological processes and KEGG pathways involved in transition from healthy to precancer to cancer |
| Tissue | Disease Stage | Enriched GO biological Processes |
| Colorectum | AD |  |
| Colorectum | SER |  |
| Colorectum | MSS |  |
| Colorectum | MSI-H |  |
| Colorectum | FAP |  |
| ∗Top 15 enriched GO BP terms are showed in the bar plot of each disease state in each tissue. Each row represents a significant GO biological process which is colored according to the -log10(p.adjust). |
| Page: 1 2 3 4 5 6 7 8 9 |
| GO ID | Tissue | Disease Stage | Description | Gene Ratio | Bg Ratio | pvalue | p.adjust | Count |
| Page: 1 |
| Pathway ID | Tissue | Disease Stage | Description | Gene Ratio | Bg Ratio | pvalue | p.adjust | qvalue | Count |
| Page: 1 |
Top |
Cell-cell communication analysis |
| Identification of potential cell-cell interactions between two cell types and their ligand-receptor pairs for different disease states |
| Ligand | Receptor | LRpair | Pathway | Tissue | Disease Stage |
| Page: 1 |
Top |
Single-cell gene regulatory network inference analysis |
| Find out the significant the regulons (TFs) and the target genes of each regulon across cell types for different disease states |
| TF | Cell Type | Tissue | Disease Stage | Target Gene | RSS | Regulon Activity |
| ∗The dot plots of a searched regulon are shown for all cell subpopulations in each disease state of each tissue based on the regulon specific score inferred using pySCENIC and by calculating the average expression. |
| Page: 1 |
Top |
Somatic mutation of malignant transformation related genes |
| Annotation of somatic variants for genes involved in malignant transformation |
| Hugo Symbol | Variant Class | Variant Classification | dbSNP RS | HGVSc | HGVSp | HGVSp Short | SWISSPROT | BIOTYPE | SIFT | PolyPhen | Tumor Sample Barcode | Tissue | Histology | Sex | Age | Stage | Therapy Types | Drugs | Outcome |
| AES | SNV | Missense_Mutation | c.240N>A | p.His80Gln | p.H80Q | Q08117 | protein_coding | deleterious_low_confidence(0.03) | probably_damaging(0.978) | TCGA-D5-6530-01 | Colorectum | colon adenocarcinoma | Male | <65 | I/II | Unknown | Unknown | SD | |
| AES | SNV | Missense_Mutation | novel | c.292G>A | p.Asp98Asn | p.D98N | Q08117 | protein_coding | deleterious_low_confidence(0.02) | probably_damaging(0.977) | TCGA-A5-A0G2-01 | Endometrium | uterine corpus endometrioid carcinoma | Female | <65 | III/IV | Unknown | Unknown | SD |
| AES | SNV | Missense_Mutation | novel | c.481C>T | p.Pro161Ser | p.P161S | Q08117 | protein_coding | deleterious_low_confidence(0) | probably_damaging(0.977) | TCGA-AP-A1DK-01 | Endometrium | uterine corpus endometrioid carcinoma | Female | <65 | I/II | Unknown | Unknown | SD |
| AES | SNV | Missense_Mutation | novel | c.532N>A | p.Ala178Thr | p.A178T | Q08117 | protein_coding | deleterious_low_confidence(0.01) | possibly_damaging(0.772) | TCGA-AX-A1C4-01 | Endometrium | uterine corpus endometrioid carcinoma | Female | <65 | I/II | Unknown | Unknown | SD |
| AES | SNV | Missense_Mutation | novel | c.221N>A | p.Gly74Asp | p.G74D | Q08117 | protein_coding | deleterious_low_confidence(0.02) | benign(0.009) | TCGA-AX-A3FT-01 | Endometrium | uterine corpus endometrioid carcinoma | Female | <65 | I/II | Unknown | Unknown | SD |
| AES | SNV | Missense_Mutation | novel | c.199N>C | p.Trp67Arg | p.W67R | Q08117 | protein_coding | tolerated_low_confidence(0.06) | benign(0) | TCGA-D1-A175-01 | Endometrium | uterine corpus endometrioid carcinoma | Female | <65 | I/II | Chemotherapy | paclitaxel | SD |
| AES | deletion | Frame_Shift_Del | novel | c.762_763delNN | p.His255ProfsTer4 | p.H255Pfs*4 | Q08117 | protein_coding | TCGA-D1-A1NX-01 | Endometrium | uterine corpus endometrioid carcinoma | Female | >=65 | III/IV | Chemotherapy | carboplatin | PD | ||
| AES | SNV | Missense_Mutation | novel | c.592N>A | p.Gln198Lys | p.Q198K | Q08117 | protein_coding | tolerated_low_confidence(0.06) | benign(0.353) | TCGA-67-3773-01 | Lung | lung adenocarcinoma | Female | >=65 | I/II | Unknown | Unknown | SD |
| AES | SNV | Missense_Mutation | c.469N>T | p.Ala157Ser | p.A157S | Q08117 | protein_coding | tolerated_low_confidence(0.08) | benign(0.416) | TCGA-34-5231-01 | Lung | lung squamous cell carcinoma | Male | >=65 | I/II | Unknown | Unknown | SD | |
| AES | SNV | Missense_Mutation | c.665N>G | p.Pro222Arg | p.P222R | Q08117 | protein_coding | deleterious_low_confidence(0) | benign(0.021) | TCGA-39-5016-01 | Lung | lung squamous cell carcinoma | Male | <65 | I/II | Unknown | Unknown | SD |
| Page: 1 2 |
Top |
Related drugs of malignant transformation related genes |
| Identification of chemicals and drugs interact with genes involved in malignant transfromation |
| (DGIdb 4.0) |
| Entrez ID | Symbol | Category | Interaction Types | Drug Claim Name | Drug Name | PMIDs |
| Page: 1 |

Copyright 2023-Present -The University of Texas Health Science Center at Houston |