
|
|||||
|
 | |
| |
| |
| |
| |
| |
|
Gene: AEN |
Gene summary for AEN |
| Gene information | Species | Human | Gene symbol | AEN | Gene ID | 64782 |
| Gene name | apoptosis enhancing nuclease | |
| Gene Alias | ISG20L1 | |
| Cytomap | 15q26.1 | |
| Gene Type | protein-coding | GO ID | GO:0006139 | UniProtAcc | Q8WTP8 |
Top |
Malignant transformation analysis |
| Identification of the aberrant gene expression in precancerous and cancerous lesions by comparing the gene expression of stem-like cells in diseased tissues with normal stem cells |
| Entrez ID | Symbol | Replicates | Species | Organ | Tissue | Adj P-value | Log2FC | Malignancy |
| 64782 | AEN | LZE7T | Human | Esophagus | ESCC | 4.89e-02 | 4.46e-01 | 0.0667 |
| 64782 | AEN | P4T-E | Human | Esophagus | ESCC | 2.41e-06 | 5.25e-02 | 0.1323 |
| 64782 | AEN | P9T-E | Human | Esophagus | ESCC | 3.12e-03 | 5.83e-02 | 0.1131 |
| 64782 | AEN | P10T-E | Human | Esophagus | ESCC | 1.07e-03 | 9.87e-03 | 0.116 |
| 64782 | AEN | P11T-E | Human | Esophagus | ESCC | 2.06e-03 | 1.20e-01 | 0.1426 |
| 64782 | AEN | P12T-E | Human | Esophagus | ESCC | 2.25e-03 | -1.60e-02 | 0.1122 |
| 64782 | AEN | P15T-E | Human | Esophagus | ESCC | 3.42e-05 | 1.24e-01 | 0.1149 |
| 64782 | AEN | P16T-E | Human | Esophagus | ESCC | 2.28e-08 | 7.21e-02 | 0.1153 |
| 64782 | AEN | P20T-E | Human | Esophagus | ESCC | 1.77e-03 | 5.40e-02 | 0.1124 |
| 64782 | AEN | P21T-E | Human | Esophagus | ESCC | 5.07e-06 | 9.91e-02 | 0.1617 |
| 64782 | AEN | P22T-E | Human | Esophagus | ESCC | 7.77e-04 | -3.24e-02 | 0.1236 |
| 64782 | AEN | P23T-E | Human | Esophagus | ESCC | 3.60e-17 | 4.09e-01 | 0.108 |
| 64782 | AEN | P24T-E | Human | Esophagus | ESCC | 6.12e-08 | 6.14e-02 | 0.1287 |
| 64782 | AEN | P26T-E | Human | Esophagus | ESCC | 4.98e-11 | 2.36e-01 | 0.1276 |
| 64782 | AEN | P28T-E | Human | Esophagus | ESCC | 1.29e-10 | 1.71e-01 | 0.1149 |
| 64782 | AEN | P30T-E | Human | Esophagus | ESCC | 5.44e-03 | 1.76e-01 | 0.137 |
| 64782 | AEN | P31T-E | Human | Esophagus | ESCC | 9.93e-07 | 5.92e-02 | 0.1251 |
| 64782 | AEN | P32T-E | Human | Esophagus | ESCC | 6.03e-10 | 8.22e-02 | 0.1666 |
| 64782 | AEN | P36T-E | Human | Esophagus | ESCC | 4.66e-04 | 7.10e-02 | 0.1187 |
| 64782 | AEN | P37T-E | Human | Esophagus | ESCC | 7.05e-08 | 3.68e-02 | 0.1371 |
| Page: 1 2 3 |
| Tissue | Expression Dynamics | Abbreviation |
| Esophagus | 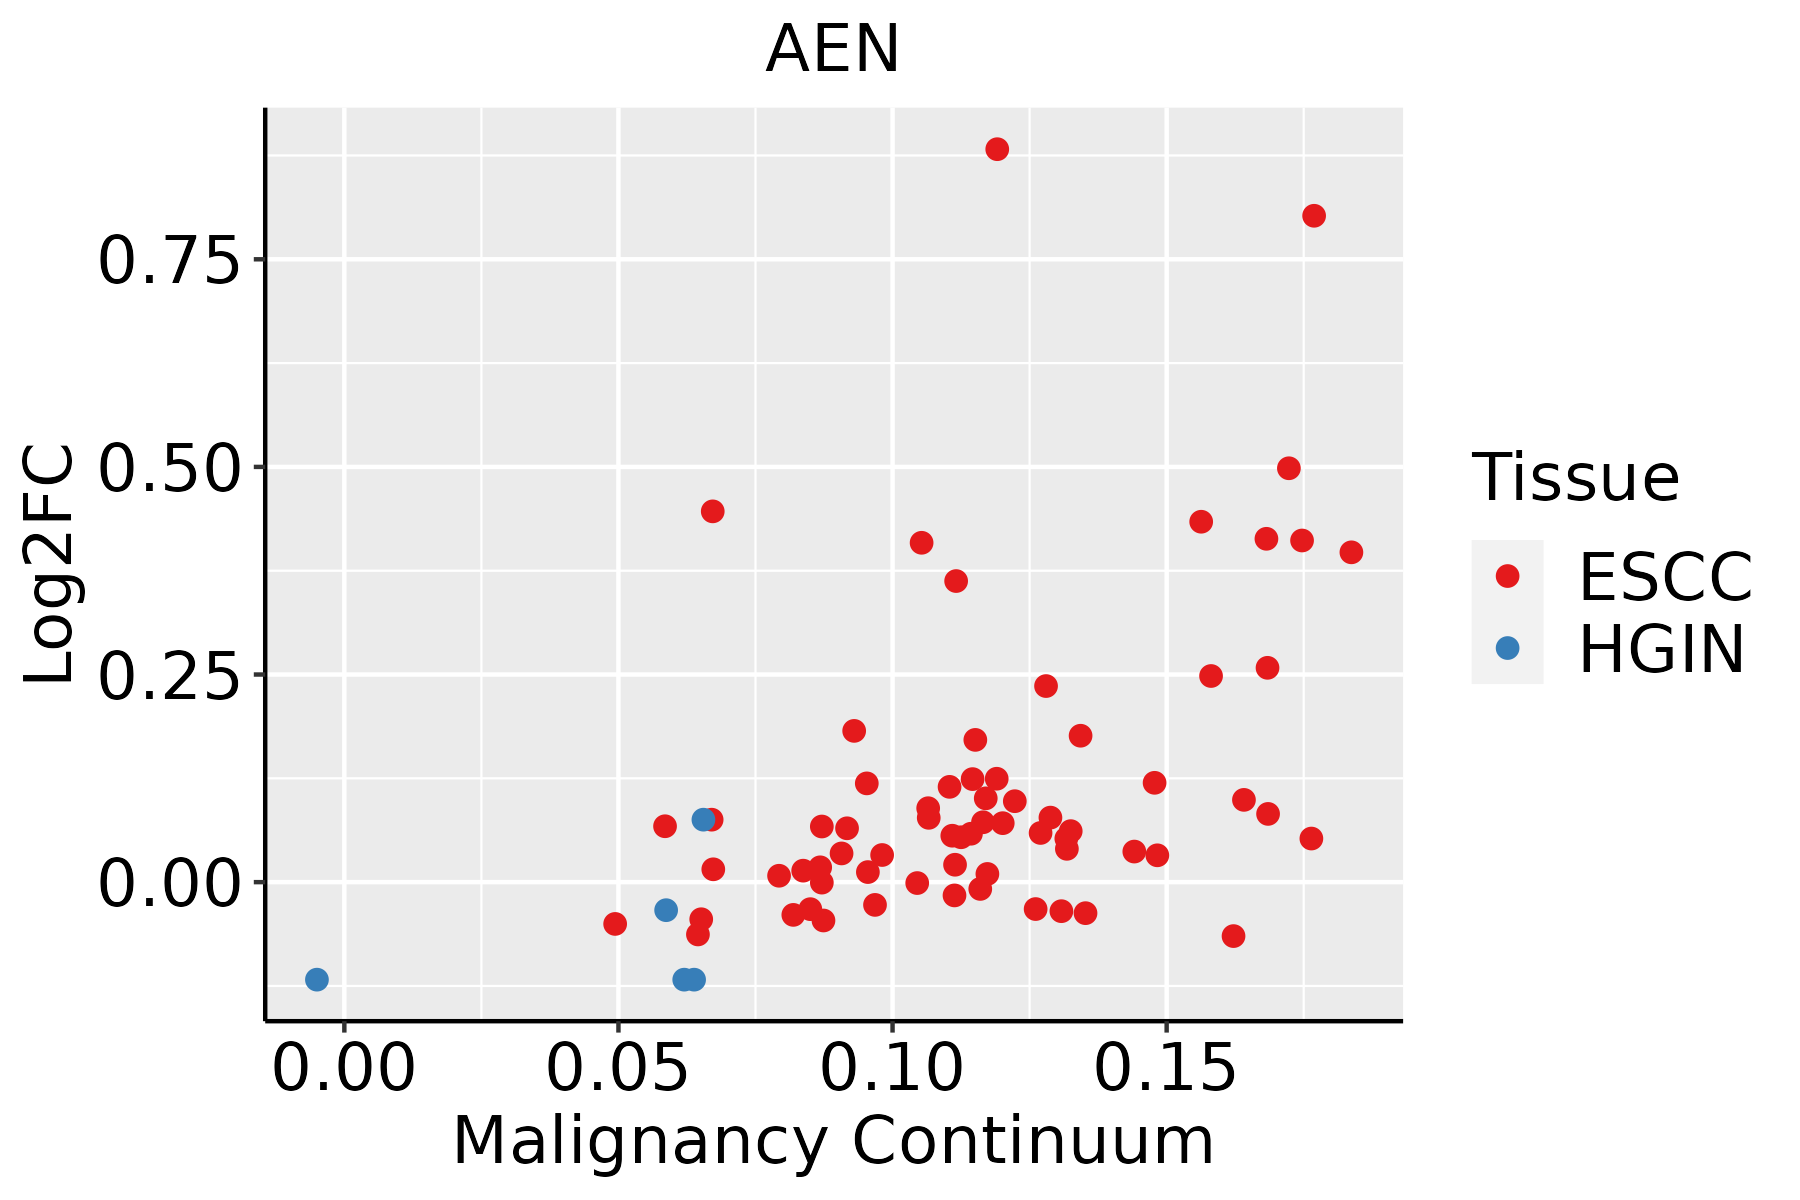 | ESCC: Esophageal squamous cell carcinoma |
| HGIN: High-grade intraepithelial neoplasias | ||
| LGIN: Low-grade intraepithelial neoplasias | ||
| Oral Cavity |  | EOLP: Erosive Oral lichen planus |
| LP: leukoplakia | ||
| NEOLP: Non-erosive oral lichen planus | ||
| OSCC: Oral squamous cell carcinoma |
| ∗log2FC in expression of this searched gene in stem-like cells from each diseased tissue sample relative to stem-like cells in normal samples in each tissue plotted against the malignancy continuum. Samples are colored based on if they are from different disease stage. |
Top |
Malignant transformation related pathway analysis |
| Find out the enriched GO biological processes and KEGG pathways involved in transition from healthy to precancer to cancer |
| Tissue | Disease Stage | Enriched GO biological Processes |
| Colorectum | AD |  |
| Colorectum | SER |  |
| Colorectum | MSS |  |
| Colorectum | MSI-H |  |
| Colorectum | FAP |  |
| ∗Top 15 enriched GO BP terms are showed in the bar plot of each disease state in each tissue. Each row represents a significant GO biological process which is colored according to the -log10(p.adjust). |
| Page: 1 2 3 4 5 6 7 8 9 |
| GO ID | Tissue | Disease Stage | Description | Gene Ratio | Bg Ratio | pvalue | p.adjust | Count |
| GO:0097193111 | Esophagus | ESCC | intrinsic apoptotic signaling pathway | 222/8552 | 288/18723 | 5.87e-28 | 2.02e-25 | 222 |
| GO:0072331111 | Esophagus | ESCC | signal transduction by p53 class mediator | 121/8552 | 163/18723 | 9.61e-14 | 4.69e-12 | 121 |
| GO:001021217 | Esophagus | ESCC | response to ionizing radiation | 110/8552 | 148/18723 | 1.11e-12 | 4.78e-11 | 110 |
| GO:0008630110 | Esophagus | ESCC | intrinsic apoptotic signaling pathway in response to DNA damage | 78/8552 | 99/18723 | 1.43e-11 | 5.08e-10 | 78 |
| GO:000931419 | Esophagus | ESCC | response to radiation | 277/8552 | 456/18723 | 4.42e-11 | 1.43e-09 | 277 |
| GO:0042771110 | Esophagus | ESCC | intrinsic apoptotic signaling pathway in response to DNA damage by p53 class mediator | 38/8552 | 43/18723 | 5.75e-09 | 1.18e-07 | 38 |
| GO:0072332111 | Esophagus | ESCC | intrinsic apoptotic signaling pathway by p53 class mediator | 59/8552 | 76/18723 | 1.22e-08 | 2.42e-07 | 59 |
| GO:00903053 | Esophagus | ESCC | nucleic acid phosphodiester bond hydrolysis | 163/8552 | 261/18723 | 3.07e-08 | 5.73e-07 | 163 |
| GO:009719320 | Oral cavity | OSCC | intrinsic apoptotic signaling pathway | 202/7305 | 288/18723 | 4.64e-27 | 1.73e-24 | 202 |
| GO:007233120 | Oral cavity | OSCC | signal transduction by p53 class mediator | 107/7305 | 163/18723 | 4.75e-12 | 1.83e-10 | 107 |
| GO:00102128 | Oral cavity | OSCC | response to ionizing radiation | 99/7305 | 148/18723 | 5.49e-12 | 2.08e-10 | 99 |
| GO:000863018 | Oral cavity | OSCC | intrinsic apoptotic signaling pathway in response to DNA damage | 72/7305 | 99/18723 | 9.50e-12 | 3.50e-10 | 72 |
| GO:007233219 | Oral cavity | OSCC | intrinsic apoptotic signaling pathway by p53 class mediator | 56/7305 | 76/18723 | 8.43e-10 | 2.13e-08 | 56 |
| GO:000931416 | Oral cavity | OSCC | response to radiation | 241/7305 | 456/18723 | 9.76e-10 | 2.40e-08 | 241 |
| GO:004277118 | Oral cavity | OSCC | intrinsic apoptotic signaling pathway in response to DNA damage by p53 class mediator | 36/7305 | 43/18723 | 2.12e-09 | 4.97e-08 | 36 |
| GO:00903052 | Oral cavity | OSCC | nucleic acid phosphodiester bond hydrolysis | 142/7305 | 261/18723 | 2.90e-07 | 4.43e-06 | 142 |
| Page: 1 |
| Pathway ID | Tissue | Disease Stage | Description | Gene Ratio | Bg Ratio | pvalue | p.adjust | qvalue | Count |
| Page: 1 |
Top |
Cell-cell communication analysis |
| Identification of potential cell-cell interactions between two cell types and their ligand-receptor pairs for different disease states |
| Ligand | Receptor | LRpair | Pathway | Tissue | Disease Stage |
| Page: 1 |
Top |
Single-cell gene regulatory network inference analysis |
| Find out the significant the regulons (TFs) and the target genes of each regulon across cell types for different disease states |
| TF | Cell Type | Tissue | Disease Stage | Target Gene | RSS | Regulon Activity |
| ∗The dot plots of a searched regulon are shown for all cell subpopulations in each disease state of each tissue based on the regulon specific score inferred using pySCENIC and by calculating the average expression. |
| Page: 1 |
Top |
Somatic mutation of malignant transformation related genes |
| Annotation of somatic variants for genes involved in malignant transformation |
| Hugo Symbol | Variant Class | Variant Classification | dbSNP RS | HGVSc | HGVSp | HGVSp Short | SWISSPROT | BIOTYPE | SIFT | PolyPhen | Tumor Sample Barcode | Tissue | Histology | Sex | Age | Stage | Therapy Types | Drugs | Outcome |
| AEN | SNV | Missense_Mutation | c.353T>C | p.Val118Ala | p.V118A | Q8WTP8 | protein_coding | deleterious(0) | probably_damaging(0.977) | TCGA-AN-A0AK-01 | Breast | breast invasive carcinoma | Female | >=65 | I/II | Unknown | Unknown | SD | |
| AEN | SNV | Missense_Mutation | novel | c.674N>A | p.Gly225Asp | p.G225D | Q8WTP8 | protein_coding | tolerated(0.1) | benign(0.246) | TCGA-2W-A8YY-01 | Cervix | cervical & endocervical cancer | Female | <65 | I/II | Chemotherapy | cisplatin | CR |
| AEN | SNV | Missense_Mutation | novel | c.214N>G | p.Thr72Ala | p.T72A | Q8WTP8 | protein_coding | tolerated(0.68) | benign(0) | TCGA-AA-3984-01 | Colorectum | colon adenocarcinoma | Female | <65 | I/II | Unknown | Unknown | SD |
| AEN | SNV | Missense_Mutation | c.754N>A | p.Gly252Arg | p.G252R | Q8WTP8 | protein_coding | deleterious(0) | probably_damaging(1) | TCGA-G4-6586-01 | Colorectum | colon adenocarcinoma | Female | >=65 | I/II | Unknown | Unknown | SD | |
| AEN | SNV | Missense_Mutation | novel | c.448G>A | p.Glu150Lys | p.E150K | Q8WTP8 | protein_coding | tolerated(0.24) | benign(0.181) | TCGA-4E-A92E-01 | Endometrium | uterine corpus endometrioid carcinoma | Female | <65 | I/II | Unknown | Unknown | SD |
| AEN | SNV | Missense_Mutation | rs756247681 | c.115N>T | p.Arg39Trp | p.R39W | Q8WTP8 | protein_coding | deleterious(0) | probably_damaging(0.993) | TCGA-A5-A0G2-01 | Endometrium | uterine corpus endometrioid carcinoma | Female | <65 | III/IV | Unknown | Unknown | SD |
| AEN | SNV | Missense_Mutation | novel | c.941N>A | p.Arg314Lys | p.R314K | Q8WTP8 | protein_coding | tolerated_low_confidence(0.9) | benign(0) | TCGA-A5-A0G2-01 | Endometrium | uterine corpus endometrioid carcinoma | Female | <65 | III/IV | Unknown | Unknown | SD |
| AEN | SNV | Missense_Mutation | c.792G>T | p.Glu264Asp | p.E264D | Q8WTP8 | protein_coding | tolerated(0.18) | benign(0.156) | TCGA-AP-A051-01 | Endometrium | uterine corpus endometrioid carcinoma | Female | >=65 | I/II | Unknown | Unknown | SD | |
| AEN | SNV | Missense_Mutation | novel | c.712N>A | p.Ala238Thr | p.A238T | Q8WTP8 | protein_coding | tolerated(0.36) | possibly_damaging(0.68) | TCGA-AX-A06F-01 | Endometrium | uterine corpus endometrioid carcinoma | Female | <65 | III/IV | Chemotherapy | carboplatin | SD |
| AEN | SNV | Missense_Mutation | rs756014603 | c.592N>A | p.Asp198Asn | p.D198N | Q8WTP8 | protein_coding | deleterious(0) | probably_damaging(1) | TCGA-AX-A0J1-01 | Endometrium | uterine corpus endometrioid carcinoma | Female | >=65 | I/II | Unknown | Unknown | SD |
| Page: 1 2 3 |
Top |
Related drugs of malignant transformation related genes |
| Identification of chemicals and drugs interact with genes involved in malignant transfromation |
| (DGIdb 4.0) |
| Entrez ID | Symbol | Category | Interaction Types | Drug Claim Name | Drug Name | PMIDs |
| Page: 1 |

Copyright 2023-Present -The University of Texas Health Science Center at Houston |