
|
|||||
|
 | |
| |
| |
| |
| |
| |
|
Gene: AEBP2 |
Gene summary for AEBP2 |
| Gene information | Species | Human | Gene symbol | AEBP2 | Gene ID | 121536 |
| Gene name | AE binding protein 2 | |
| Gene Alias | AEBP2 | |
| Cytomap | 12p12.3 | |
| Gene Type | protein-coding | GO ID | GO:0000122 | UniProtAcc | Q6ZN18 |
Top |
Malignant transformation analysis |
| Identification of the aberrant gene expression in precancerous and cancerous lesions by comparing the gene expression of stem-like cells in diseased tissues with normal stem cells |
| Entrez ID | Symbol | Replicates | Species | Organ | Tissue | Adj P-value | Log2FC | Malignancy |
| 121536 | AEBP2 | CCI_1 | Human | Cervix | CC | 8.25e-04 | 9.60e-01 | 0.528 |
| 121536 | AEBP2 | CCI_2 | Human | Cervix | CC | 8.44e-13 | 1.24e+00 | 0.5249 |
| 121536 | AEBP2 | CCI_3 | Human | Cervix | CC | 1.68e-17 | 1.89e+00 | 0.516 |
| 121536 | AEBP2 | HTA11_3410_2000001011 | Human | Colorectum | AD | 6.11e-05 | -3.34e-01 | 0.0155 |
| 121536 | AEBP2 | HTA11_99999974143_84620 | Human | Colorectum | MSS | 5.68e-16 | -5.55e-01 | 0.3005 |
| 121536 | AEBP2 | A001-C-207 | Human | Colorectum | FAP | 4.14e-04 | -3.49e-01 | 0.1278 |
| 121536 | AEBP2 | A015-C-203 | Human | Colorectum | FAP | 3.05e-26 | -4.92e-01 | -0.1294 |
| 121536 | AEBP2 | A015-C-204 | Human | Colorectum | FAP | 1.24e-05 | -2.38e-01 | -0.0228 |
| 121536 | AEBP2 | A002-C-201 | Human | Colorectum | FAP | 7.13e-14 | -4.15e-01 | 0.0324 |
| 121536 | AEBP2 | A002-C-203 | Human | Colorectum | FAP | 4.12e-02 | -1.95e-01 | 0.2786 |
| 121536 | AEBP2 | A001-C-119 | Human | Colorectum | FAP | 1.52e-06 | -4.23e-01 | -0.1557 |
| 121536 | AEBP2 | A001-C-108 | Human | Colorectum | FAP | 4.53e-13 | -3.35e-01 | -0.0272 |
| 121536 | AEBP2 | A002-C-205 | Human | Colorectum | FAP | 1.27e-20 | -4.46e-01 | -0.1236 |
| 121536 | AEBP2 | A001-C-104 | Human | Colorectum | FAP | 3.91e-02 | -2.37e-01 | 0.0184 |
| 121536 | AEBP2 | A015-C-005 | Human | Colorectum | FAP | 2.36e-04 | -2.54e-01 | -0.0336 |
| 121536 | AEBP2 | A015-C-006 | Human | Colorectum | FAP | 2.62e-15 | -3.42e-01 | -0.0994 |
| 121536 | AEBP2 | A015-C-106 | Human | Colorectum | FAP | 4.40e-09 | -2.08e-01 | -0.0511 |
| 121536 | AEBP2 | A002-C-114 | Human | Colorectum | FAP | 2.60e-15 | -3.73e-01 | -0.1561 |
| 121536 | AEBP2 | A015-C-104 | Human | Colorectum | FAP | 1.08e-23 | -4.06e-01 | -0.1899 |
| 121536 | AEBP2 | A001-C-014 | Human | Colorectum | FAP | 3.74e-16 | -4.16e-01 | 0.0135 |
| Page: 1 2 3 4 5 6 7 |
| Tissue | Expression Dynamics | Abbreviation |
| Cervix |  | CC: Cervix cancer |
| HSIL_HPV: HPV-infected high-grade squamous intraepithelial lesions | ||
| N_HPV: HPV-infected normal cervix | ||
| Colorectum (GSE201348) |  | FAP: Familial adenomatous polyposis |
| CRC: Colorectal cancer | ||
| Colorectum (HTA11) |  | AD: Adenomas |
| SER: Sessile serrated lesions | ||
| MSI-H: Microsatellite-high colorectal cancer | ||
| MSS: Microsatellite stable colorectal cancer | ||
| Esophagus |  | ESCC: Esophageal squamous cell carcinoma |
| HGIN: High-grade intraepithelial neoplasias | ||
| LGIN: Low-grade intraepithelial neoplasias | ||
| Lung | 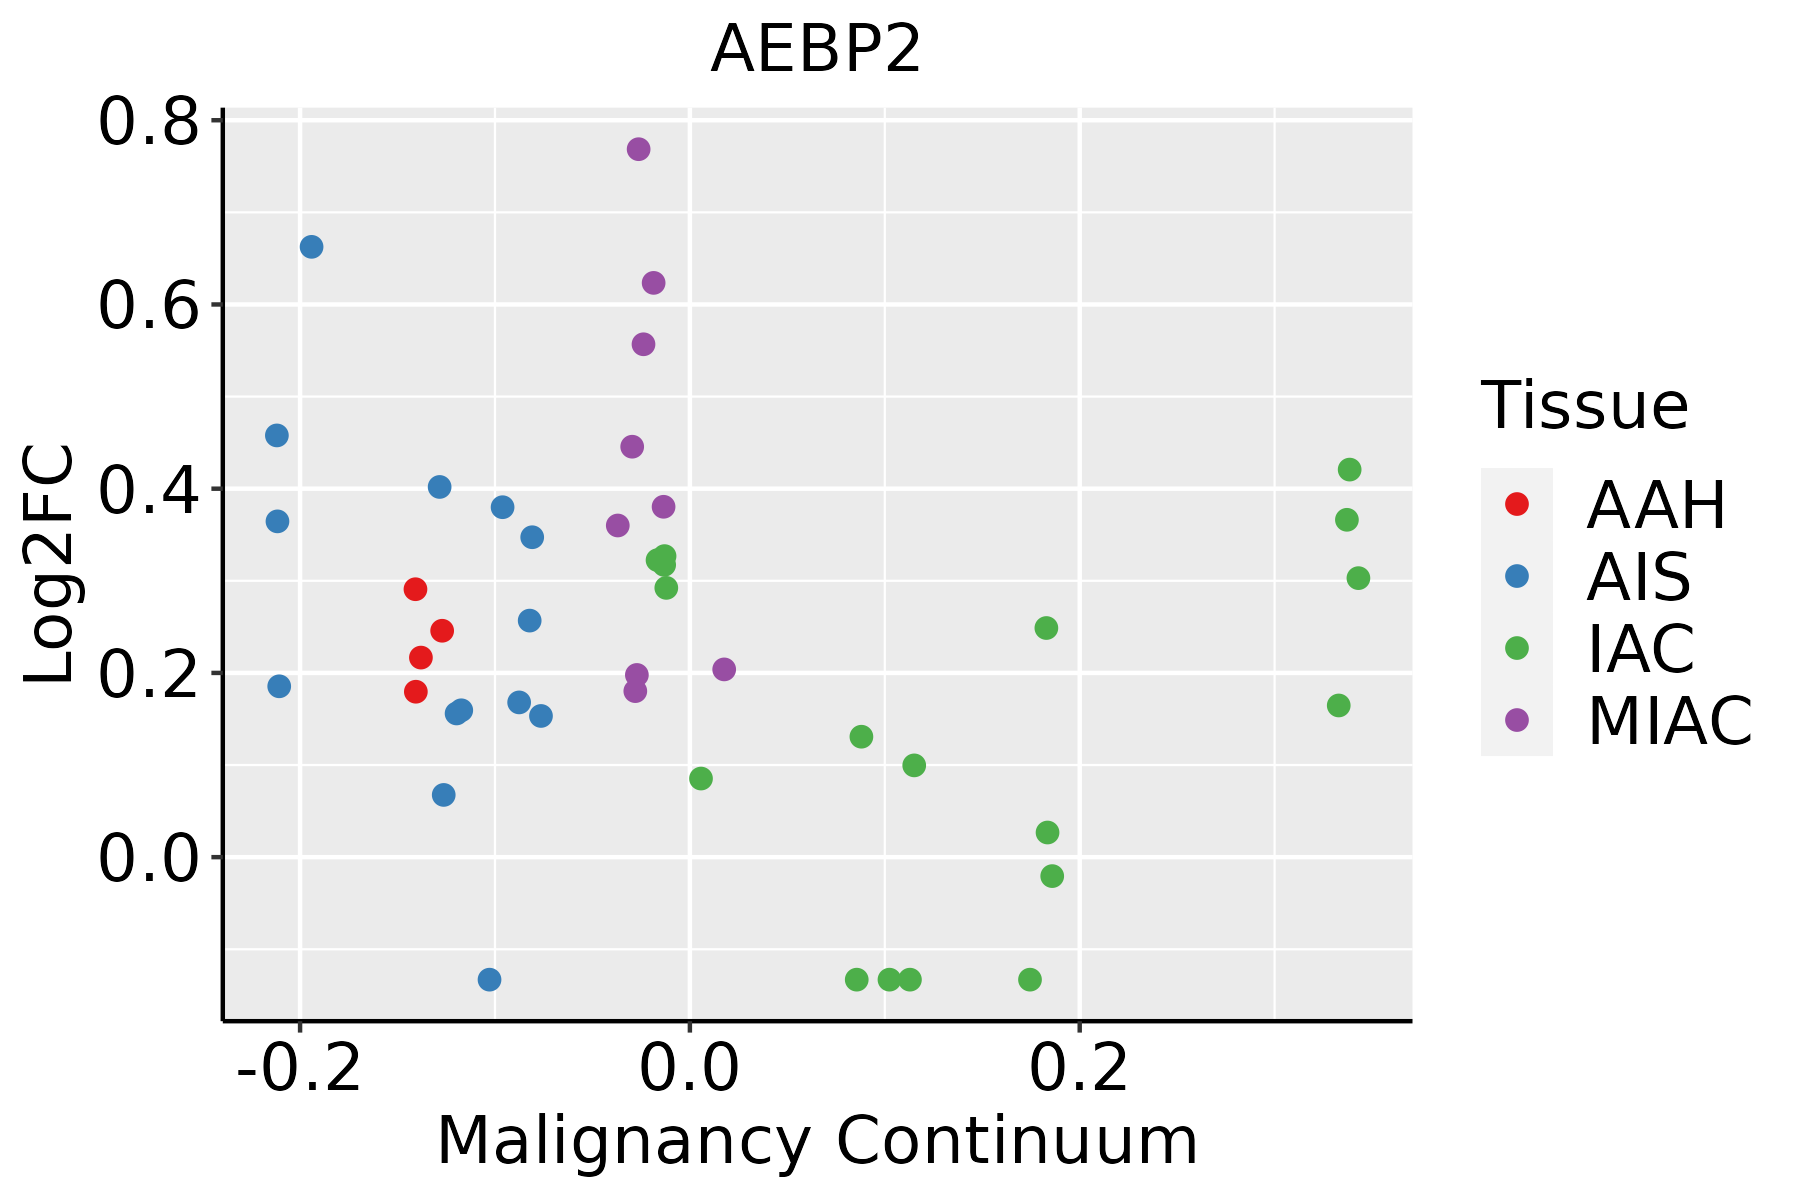 | AAH: Atypical adenomatous hyperplasia |
| AIS: Adenocarcinoma in situ | ||
| IAC: Invasive lung adenocarcinoma | ||
| MIA: Minimally invasive adenocarcinoma | ||
| Oral Cavity |  | EOLP: Erosive Oral lichen planus |
| LP: leukoplakia | ||
| NEOLP: Non-erosive oral lichen planus | ||
| OSCC: Oral squamous cell carcinoma | ||
| Thyroid | 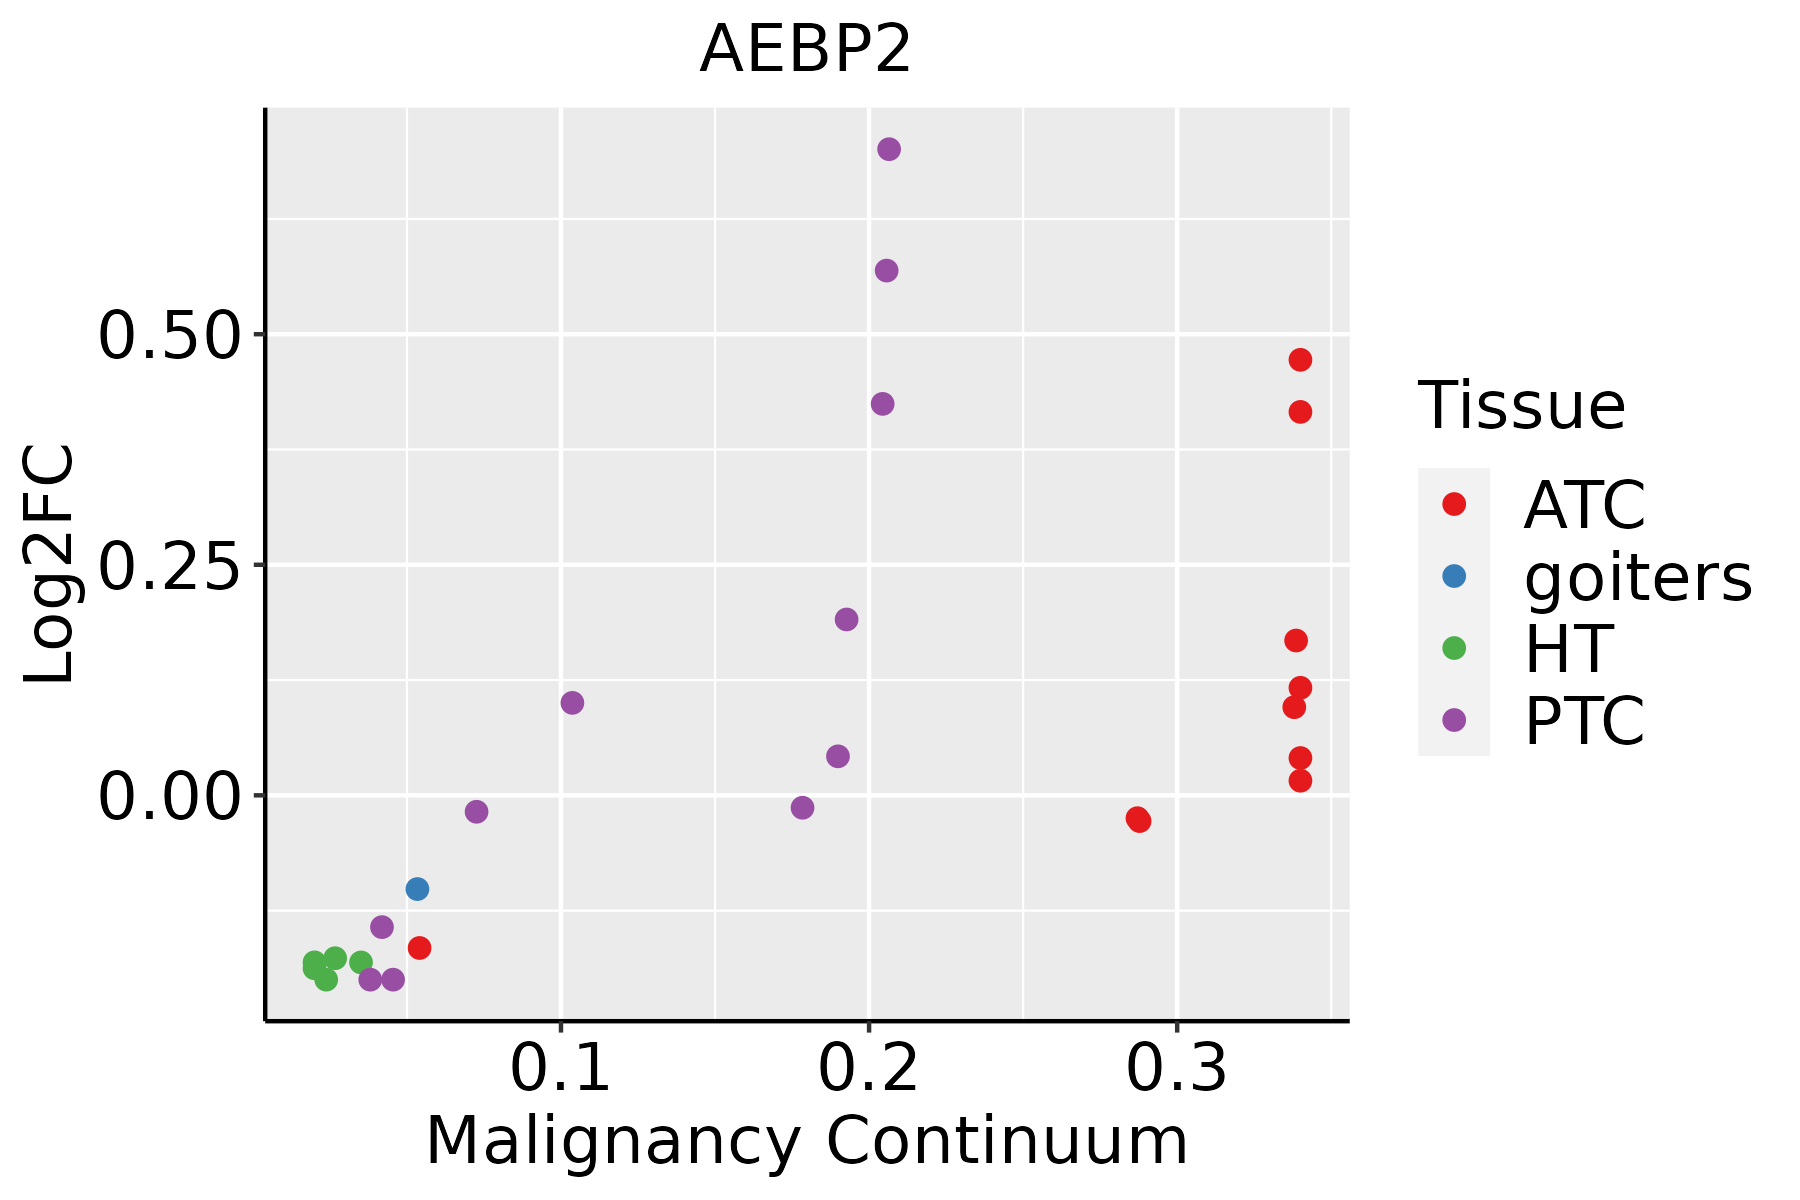 | ATC: Anaplastic thyroid cancer |
| HT: Hashimoto's thyroiditis | ||
| PTC: Papillary thyroid cancer |
| ∗log2FC in expression of this searched gene in stem-like cells from each diseased tissue sample relative to stem-like cells in normal samples in each tissue plotted against the malignancy continuum. Samples are colored based on if they are from different disease stage. |
Top |
Malignant transformation related pathway analysis |
| Find out the enriched GO biological processes and KEGG pathways involved in transition from healthy to precancer to cancer |
| Tissue | Disease Stage | Enriched GO biological Processes |
| Colorectum | AD |  |
| Colorectum | SER |  |
| Colorectum | MSS |  |
| Colorectum | MSI-H |  |
| Colorectum | FAP |  |
| ∗Top 15 enriched GO BP terms are showed in the bar plot of each disease state in each tissue. Each row represents a significant GO biological process which is colored according to the -log10(p.adjust). |
| Page: 1 2 3 4 5 6 7 8 9 |
| GO ID | Tissue | Disease Stage | Description | Gene Ratio | Bg Ratio | pvalue | p.adjust | Count |
| GO:00063257 | Cervix | CC | chromatin organization | 78/2311 | 409/18723 | 5.40e-05 | 8.02e-04 | 78 |
| GO:0006325 | Colorectum | AD | chromatin organization | 119/3918 | 409/18723 | 4.85e-05 | 8.33e-04 | 119 |
| GO:00063252 | Colorectum | MSS | chromatin organization | 107/3467 | 409/18723 | 7.22e-05 | 1.21e-03 | 107 |
| GO:00063253 | Colorectum | FAP | chromatin organization | 84/2622 | 409/18723 | 1.62e-04 | 2.47e-03 | 84 |
| GO:00063254 | Colorectum | CRC | chromatin organization | 74/2078 | 409/18723 | 1.48e-05 | 4.61e-04 | 74 |
| GO:000632517 | Esophagus | ESCC | chromatin organization | 240/8552 | 409/18723 | 6.52e-08 | 1.14e-06 | 240 |
| GO:00063256 | Lung | IAC | chromatin organization | 69/2061 | 409/18723 | 2.01e-04 | 3.53e-03 | 69 |
| GO:000632512 | Lung | AIS | chromatin organization | 62/1849 | 409/18723 | 4.24e-04 | 7.29e-03 | 62 |
| GO:000632510 | Oral cavity | OSCC | chromatin organization | 190/7305 | 409/18723 | 1.17e-03 | 5.97e-03 | 190 |
| GO:000632515 | Oral cavity | EOLP | chromatin organization | 84/2218 | 409/18723 | 2.68e-07 | 8.16e-06 | 84 |
| GO:000632521 | Oral cavity | NEOLP | chromatin organization | 70/2005 | 409/18723 | 4.97e-05 | 6.83e-04 | 70 |
| GO:000632520 | Thyroid | PTC | chromatin organization | 183/5968 | 409/18723 | 2.55e-08 | 5.70e-07 | 183 |
| GO:0006325110 | Thyroid | ATC | chromatin organization | 189/6293 | 409/18723 | 6.40e-08 | 1.13e-06 | 189 |
| Page: 1 |
| Pathway ID | Tissue | Disease Stage | Description | Gene Ratio | Bg Ratio | pvalue | p.adjust | qvalue | Count |
| Page: 1 |
Top |
Cell-cell communication analysis |
| Identification of potential cell-cell interactions between two cell types and their ligand-receptor pairs for different disease states |
| Ligand | Receptor | LRpair | Pathway | Tissue | Disease Stage |
| Page: 1 |
Top |
Single-cell gene regulatory network inference analysis |
| Find out the significant the regulons (TFs) and the target genes of each regulon across cell types for different disease states |
| TF | Cell Type | Tissue | Disease Stage | Target Gene | RSS | Regulon Activity |
| AEBP2 | CD8TCM | Colorectum | MSS | SIRT5,CRELD1,IKZF2, etc. | 7.30e-02 |  |
| ∗The dot plots of a searched regulon are shown for all cell subpopulations in each disease state of each tissue based on the regulon specific score inferred using pySCENIC and by calculating the average expression. |
| Page: 1 |
Top |
Somatic mutation of malignant transformation related genes |
| Annotation of somatic variants for genes involved in malignant transformation |
| Hugo Symbol | Variant Class | Variant Classification | dbSNP RS | HGVSc | HGVSp | HGVSp Short | SWISSPROT | BIOTYPE | SIFT | PolyPhen | Tumor Sample Barcode | Tissue | Histology | Sex | Age | Stage | Therapy Types | Drugs | Outcome |
| AEBP2 | SNV | Missense_Mutation | c.713N>A | p.Ser238Asn | p.S238N | Q6ZN18 | protein_coding | deleterious_low_confidence(0.03) | probably_damaging(0.968) | TCGA-A2-A04T-01 | Breast | breast invasive carcinoma | Female | <65 | I/II | Chemotherapy | cyclophosphamide | SD | |
| AEBP2 | SNV | Missense_Mutation | novel | c.676N>G | p.Ser226Gly | p.S226G | Q6ZN18 | protein_coding | deleterious_low_confidence(0.04) | benign(0.018) | TCGA-AN-A046-01 | Breast | breast invasive carcinoma | Female | >=65 | I/II | Unknown | Unknown | SD |
| AEBP2 | SNV | Missense_Mutation | novel | c.829N>A | p.Asp277Asn | p.D277N | Q6ZN18 | protein_coding | deleterious_low_confidence(0.01) | probably_damaging(0.997) | TCGA-AN-A046-01 | Breast | breast invasive carcinoma | Female | >=65 | I/II | Unknown | Unknown | SD |
| AEBP2 | SNV | Missense_Mutation | rs754732926 | c.848N>A | p.Arg283His | p.R283H | Q6ZN18 | protein_coding | tolerated_low_confidence(0.05) | benign(0.015) | TCGA-BH-A18G-01 | Breast | breast invasive carcinoma | Female | >=65 | I/II | Unknown | Unknown | SD |
| AEBP2 | SNV | Missense_Mutation | c.1112N>T | p.Ser371Phe | p.S371F | Q6ZN18 | protein_coding | deleterious_low_confidence(0.01) | probably_damaging(0.991) | TCGA-JW-A5VJ-01 | Cervix | cervical & endocervical cancer | Female | <65 | I/II | Unknown | Unknown | PD | |
| AEBP2 | SNV | Missense_Mutation | c.727C>T | p.Pro243Ser | p.P243S | Q6ZN18 | protein_coding | deleterious_low_confidence(0.01) | probably_damaging(0.996) | TCGA-JX-A5QV-01 | Cervix | cervical & endocervical cancer | Female | <65 | I/II | Unknown | Unknown | SD | |
| AEBP2 | SNV | Missense_Mutation | novel | c.1166G>A | p.Arg389His | p.R389H | Q6ZN18 | protein_coding | tolerated_low_confidence(0.19) | possibly_damaging(0.899) | TCGA-VS-A9UJ-01 | Cervix | cervical & endocervical cancer | Female | <65 | I/II | Unknown | Unknown | PD |
| AEBP2 | SNV | Missense_Mutation | c.1325C>A | p.Ser442Tyr | p.S442Y | Q6ZN18 | protein_coding | deleterious_low_confidence(0) | probably_damaging(0.915) | TCGA-A6-3809-01 | Colorectum | colon adenocarcinoma | Female | >=65 | I/II | Unknown | Unknown | SD | |
| AEBP2 | SNV | Missense_Mutation | novel | c.1108N>A | p.Glu370Lys | p.E370K | Q6ZN18 | protein_coding | tolerated_low_confidence(0.09) | probably_damaging(0.98) | TCGA-AZ-4315-01 | Colorectum | colon adenocarcinoma | Male | <65 | I/II | Unknown | Unknown | SD |
| AEBP2 | SNV | Missense_Mutation | c.1049N>A | p.Pro350His | p.P350H | Q6ZN18 | protein_coding | deleterious_low_confidence(0.02) | probably_damaging(0.998) | TCGA-F4-6570-01 | Colorectum | colon adenocarcinoma | Female | >=65 | I/II | Unknown | Unknown | SD |
| Page: 1 2 3 |
Top |
Related drugs of malignant transformation related genes |
| Identification of chemicals and drugs interact with genes involved in malignant transfromation |
| (DGIdb 4.0) |
| Entrez ID | Symbol | Category | Interaction Types | Drug Claim Name | Drug Name | PMIDs |
| Page: 1 |

Copyright 2023-Present -The University of Texas Health Science Center at Houston |