
|
|||||
|
 | |
| |
| |
| |
| |
| |
|
Gene: AEBP1 |
Gene summary for AEBP1 |
| Gene information | Species | Human | Gene symbol | AEBP1 | Gene ID | 165 |
| Gene name | AE binding protein 1 | |
| Gene Alias | ACLP | |
| Cytomap | 7p13 | |
| Gene Type | protein-coding | GO ID | GO:0000122 | UniProtAcc | Q8IUX7 |
Top |
Malignant transformation analysis |
| Identification of the aberrant gene expression in precancerous and cancerous lesions by comparing the gene expression of stem-like cells in diseased tissues with normal stem cells |
| Entrez ID | Symbol | Replicates | Species | Organ | Tissue | Adj P-value | Log2FC | Malignancy |
| 165 | AEBP1 | P2T-E | Human | Esophagus | ESCC | 6.66e-11 | 2.42e-01 | 0.1177 |
| 165 | AEBP1 | P4T-E | Human | Esophagus | ESCC | 1.08e-14 | 7.91e-01 | 0.1323 |
| 165 | AEBP1 | P5T-E | Human | Esophagus | ESCC | 9.80e-05 | 6.86e-01 | 0.1327 |
| 165 | AEBP1 | P9T-E | Human | Esophagus | ESCC | 4.07e-07 | 8.61e-01 | 0.1131 |
| 165 | AEBP1 | P10T-E | Human | Esophagus | ESCC | 3.59e-42 | 9.48e-01 | 0.116 |
| 165 | AEBP1 | P11T-E | Human | Esophagus | ESCC | 1.36e-12 | 1.11e+00 | 0.1426 |
| 165 | AEBP1 | P12T-E | Human | Esophagus | ESCC | 3.55e-18 | 4.10e-01 | 0.1122 |
| 165 | AEBP1 | P15T-E | Human | Esophagus | ESCC | 4.64e-02 | 5.91e-01 | 0.1149 |
| 165 | AEBP1 | P16T-E | Human | Esophagus | ESCC | 1.33e-52 | 8.21e-01 | 0.1153 |
| 165 | AEBP1 | P19T-E | Human | Esophagus | ESCC | 2.56e-10 | 1.39e+00 | 0.1662 |
| 165 | AEBP1 | P22T-E | Human | Esophagus | ESCC | 3.99e-02 | 7.13e-01 | 0.1236 |
| 165 | AEBP1 | P24T-E | Human | Esophagus | ESCC | 4.44e-06 | 4.50e-01 | 0.1287 |
| 165 | AEBP1 | P31T-E | Human | Esophagus | ESCC | 1.29e-03 | 2.45e-01 | 0.1251 |
| 165 | AEBP1 | P32T-E | Human | Esophagus | ESCC | 5.86e-05 | 3.35e-01 | 0.1666 |
| 165 | AEBP1 | P37T-E | Human | Esophagus | ESCC | 4.19e-02 | 5.46e-01 | 0.1371 |
| 165 | AEBP1 | P38T-E | Human | Esophagus | ESCC | 4.44e-03 | 1.43e-01 | 0.127 |
| 165 | AEBP1 | P42T-E | Human | Esophagus | ESCC | 7.32e-06 | 9.88e-01 | 0.1175 |
| 165 | AEBP1 | P44T-E | Human | Esophagus | ESCC | 3.58e-16 | 2.13e+00 | 0.1096 |
| 165 | AEBP1 | P47T-E | Human | Esophagus | ESCC | 4.86e-11 | 1.31e+00 | 0.1067 |
| 165 | AEBP1 | P49T-E | Human | Esophagus | ESCC | 5.40e-19 | 2.31e+00 | 0.1768 |
| Page: 1 2 3 |
| Tissue | Expression Dynamics | Abbreviation |
| Esophagus | 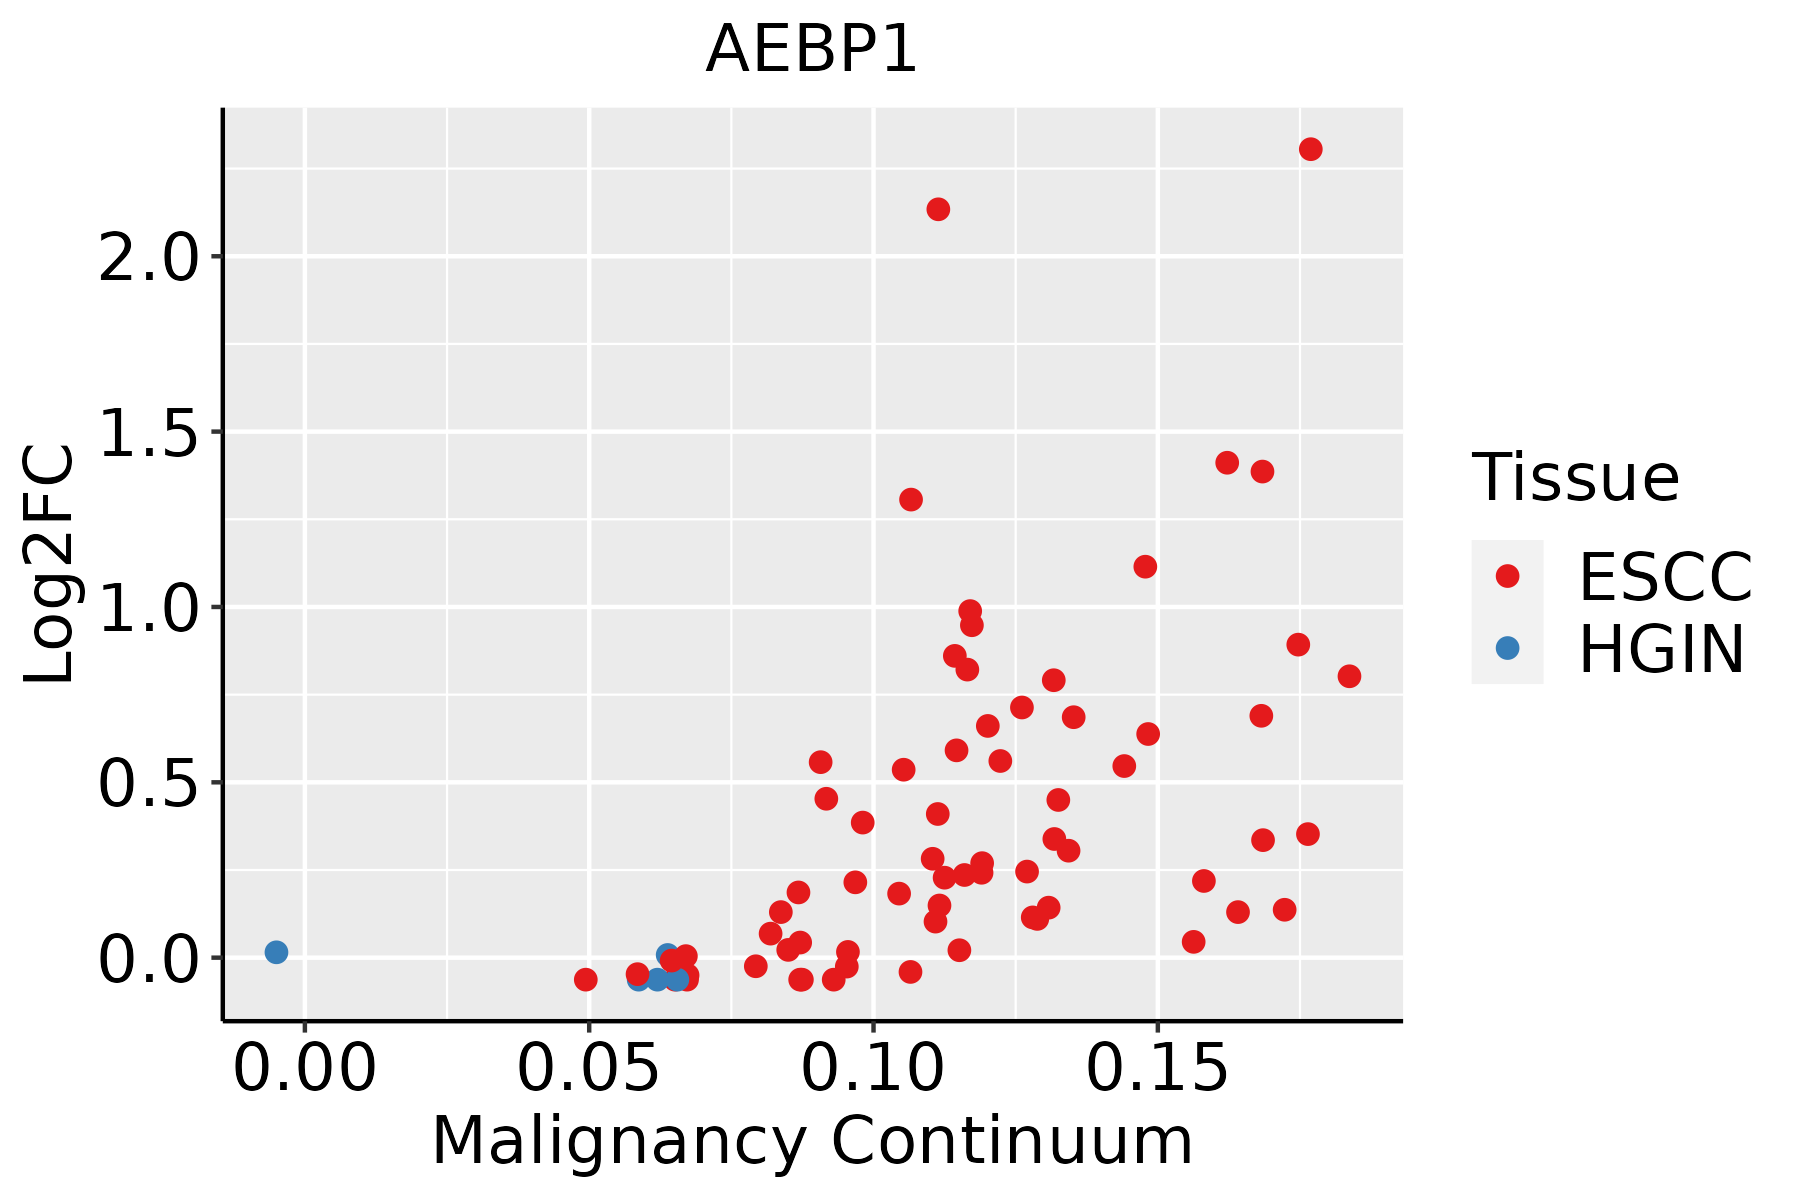 | ESCC: Esophageal squamous cell carcinoma |
| HGIN: High-grade intraepithelial neoplasias | ||
| LGIN: Low-grade intraepithelial neoplasias | ||
| Liver |  | HCC: Hepatocellular carcinoma |
| NAFLD: Non-alcoholic fatty liver disease | ||
| Thyroid | 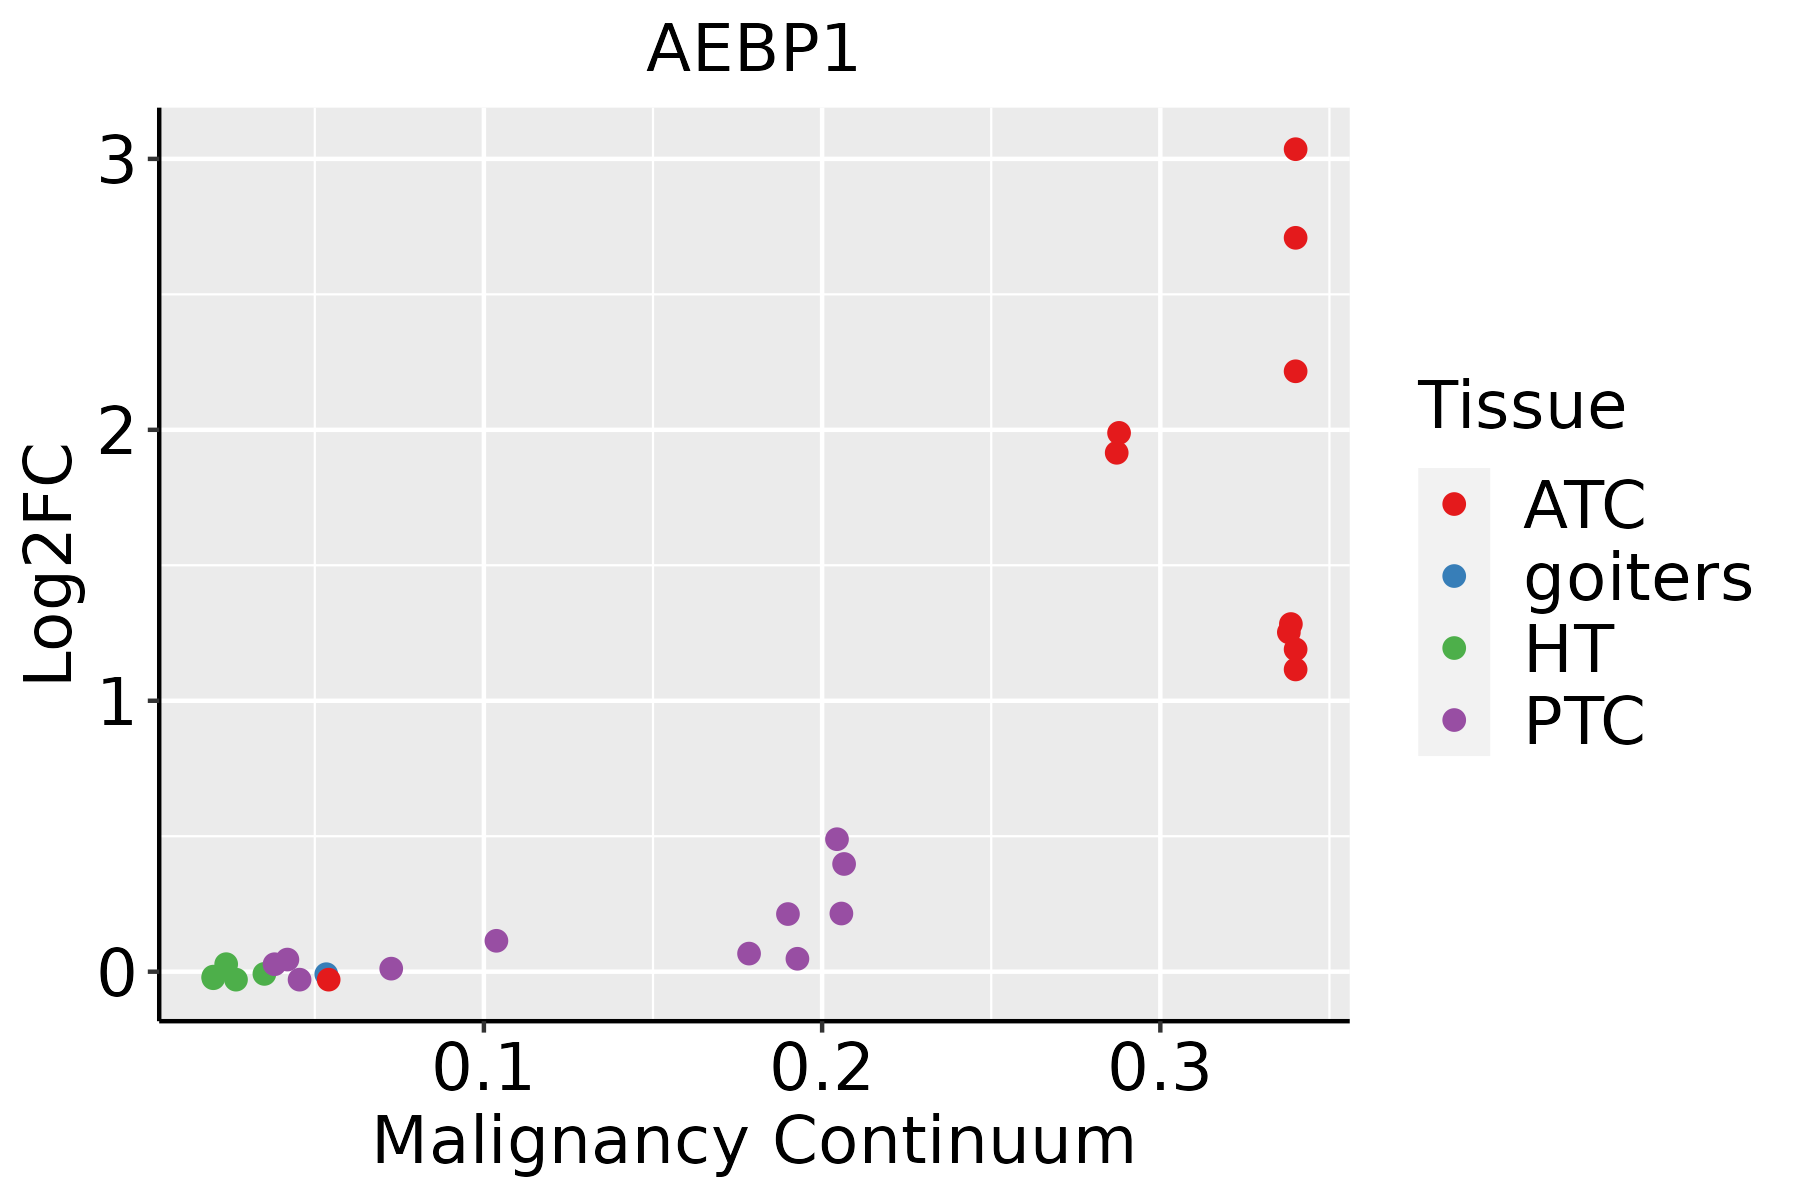 | ATC: Anaplastic thyroid cancer |
| HT: Hashimoto's thyroiditis | ||
| PTC: Papillary thyroid cancer |
| ∗log2FC in expression of this searched gene in stem-like cells from each diseased tissue sample relative to stem-like cells in normal samples in each tissue plotted against the malignancy continuum. Samples are colored based on if they are from different disease stage. |
Top |
Malignant transformation related pathway analysis |
| Find out the enriched GO biological processes and KEGG pathways involved in transition from healthy to precancer to cancer |
| Tissue | Disease Stage | Enriched GO biological Processes |
| Colorectum | AD |  |
| Colorectum | SER |  |
| Colorectum | MSS |  |
| Colorectum | MSI-H |  |
| Colorectum | FAP |  |
| ∗Top 15 enriched GO BP terms are showed in the bar plot of each disease state in each tissue. Each row represents a significant GO biological process which is colored according to the -log10(p.adjust). |
| Page: 1 2 3 4 5 6 7 8 9 |
| GO ID | Tissue | Disease Stage | Description | Gene Ratio | Bg Ratio | pvalue | p.adjust | Count |
| GO:1902903111 | Esophagus | ESCC | regulation of supramolecular fiber organization | 237/8552 | 383/18723 | 9.06e-11 | 2.75e-09 | 237 |
| GO:00301984 | Esophagus | ESCC | extracellular matrix organization | 171/8552 | 301/18723 | 6.08e-05 | 4.67e-04 | 171 |
| GO:00430624 | Esophagus | ESCC | extracellular structure organization | 171/8552 | 302/18723 | 7.73e-05 | 5.76e-04 | 171 |
| GO:00452294 | Esophagus | ESCC | external encapsulating structure organization | 172/8552 | 304/18723 | 7.80e-05 | 5.80e-04 | 172 |
| GO:00301993 | Esophagus | ESCC | collagen fibril organization | 40/8552 | 61/18723 | 1.35e-03 | 6.44e-03 | 40 |
| GO:19030532 | Esophagus | ESCC | regulation of extracellular matrix organization | 30/8552 | 48/18723 | 1.40e-02 | 4.57e-02 | 30 |
| GO:190290312 | Liver | Cirrhotic | regulation of supramolecular fiber organization | 148/4634 | 383/18723 | 8.85e-10 | 4.08e-08 | 148 |
| GO:190290322 | Liver | HCC | regulation of supramolecular fiber organization | 224/7958 | 383/18723 | 1.54e-10 | 5.33e-09 | 224 |
| GO:1902903113 | Thyroid | PTC | regulation of supramolecular fiber organization | 202/5968 | 383/18723 | 1.16e-17 | 1.15e-15 | 202 |
| GO:00301986 | Thyroid | PTC | extracellular matrix organization | 124/5968 | 301/18723 | 3.75e-04 | 2.53e-03 | 124 |
| GO:00430626 | Thyroid | PTC | extracellular structure organization | 124/5968 | 302/18723 | 4.38e-04 | 2.92e-03 | 124 |
| GO:00452296 | Thyroid | PTC | external encapsulating structure organization | 124/5968 | 304/18723 | 5.96e-04 | 3.79e-03 | 124 |
| GO:19030533 | Thyroid | PTC | regulation of extracellular matrix organization | 26/5968 | 48/18723 | 1.13e-03 | 6.59e-03 | 26 |
| GO:00301995 | Thyroid | PTC | collagen fibril organization | 29/5968 | 61/18723 | 7.57e-03 | 3.23e-02 | 29 |
| GO:1902903210 | Thyroid | ATC | regulation of supramolecular fiber organization | 210/6293 | 383/18723 | 6.20e-18 | 7.54e-16 | 210 |
| GO:003019812 | Thyroid | ATC | extracellular matrix organization | 152/6293 | 301/18723 | 8.63e-10 | 2.24e-08 | 152 |
| GO:004306212 | Thyroid | ATC | extracellular structure organization | 152/6293 | 302/18723 | 1.17e-09 | 2.94e-08 | 152 |
| GO:004522912 | Thyroid | ATC | external encapsulating structure organization | 152/6293 | 304/18723 | 2.11e-09 | 5.08e-08 | 152 |
| GO:003019911 | Thyroid | ATC | collagen fibril organization | 43/6293 | 61/18723 | 4.24e-09 | 9.57e-08 | 43 |
| GO:190305311 | Thyroid | ATC | regulation of extracellular matrix organization | 33/6293 | 48/18723 | 6.86e-07 | 9.33e-06 | 33 |
| Page: 1 |
| Pathway ID | Tissue | Disease Stage | Description | Gene Ratio | Bg Ratio | pvalue | p.adjust | qvalue | Count |
| Page: 1 |
Top |
Cell-cell communication analysis |
| Identification of potential cell-cell interactions between two cell types and their ligand-receptor pairs for different disease states |
| Ligand | Receptor | LRpair | Pathway | Tissue | Disease Stage |
| Page: 1 |
Top |
Single-cell gene regulatory network inference analysis |
| Find out the significant the regulons (TFs) and the target genes of each regulon across cell types for different disease states |
| TF | Cell Type | Tissue | Disease Stage | Target Gene | RSS | Regulon Activity |
| ∗The dot plots of a searched regulon are shown for all cell subpopulations in each disease state of each tissue based on the regulon specific score inferred using pySCENIC and by calculating the average expression. |
| Page: 1 |
Top |
Somatic mutation of malignant transformation related genes |
| Annotation of somatic variants for genes involved in malignant transformation |
| Hugo Symbol | Variant Class | Variant Classification | dbSNP RS | HGVSc | HGVSp | HGVSp Short | SWISSPROT | BIOTYPE | SIFT | PolyPhen | Tumor Sample Barcode | Tissue | Histology | Sex | Age | Stage | Therapy Types | Drugs | Outcome |
| AEBP1 | SNV | Missense_Mutation | rs779044302 | c.751N>T | p.Arg251Trp | p.R251W | Q8IUX7 | protein_coding | deleterious_low_confidence(0) | benign(0.003) | TCGA-5L-AAT1-01 | Breast | breast invasive carcinoma | Female | <65 | III/IV | Hormone Therapy | letrozol | SD |
| AEBP1 | SNV | Missense_Mutation | c.1705N>A | p.Asp569Asn | p.D569N | Q8IUX7 | protein_coding | deleterious(0) | probably_damaging(0.968) | TCGA-AC-A23H-01 | Breast | breast invasive carcinoma | Female | >=65 | I/II | Unknown | Unknown | PD | |
| AEBP1 | SNV | Missense_Mutation | c.2191N>A | p.Glu731Lys | p.E731K | Q8IUX7 | protein_coding | deleterious(0.03) | possibly_damaging(0.842) | TCGA-AC-A23H-01 | Breast | breast invasive carcinoma | Female | >=65 | I/II | Unknown | Unknown | PD | |
| AEBP1 | SNV | Missense_Mutation | c.1573N>A | p.Leu525Ile | p.L525I | Q8IUX7 | protein_coding | tolerated(0.28) | possibly_damaging(0.898) | TCGA-AO-A0JB-01 | Breast | breast invasive carcinoma | Female | <65 | III/IV | Chemotherapy | cyclophosphamide | SD | |
| AEBP1 | SNV | Missense_Mutation | rs771452124 | c.1982G>A | p.Arg661His | p.R661H | Q8IUX7 | protein_coding | deleterious(0) | probably_damaging(0.965) | TCGA-AR-A0U2-01 | Breast | breast invasive carcinoma | Female | <65 | III/IV | Hormone Therapy | tamoxiphen | PD |
| AEBP1 | SNV | Missense_Mutation | c.2933G>A | p.Cys978Tyr | p.C978Y | Q8IUX7 | protein_coding | deleterious(0) | probably_damaging(1) | TCGA-BH-A0HF-01 | Breast | breast invasive carcinoma | Female | >=65 | I/II | Hormone Therapy | arimidex | SD | |
| AEBP1 | SNV | Missense_Mutation | c.697C>G | p.Leu233Val | p.L233V | Q8IUX7 | protein_coding | deleterious_low_confidence(0) | benign(0.189) | TCGA-BH-A1EV-01 | Breast | breast invasive carcinoma | Female | <65 | III/IV | Unknown | Unknown | PD | |
| AEBP1 | SNV | Missense_Mutation | rs373830686 | c.1279N>T | p.Asp427Tyr | p.D427Y | Q8IUX7 | protein_coding | deleterious(0.03) | possibly_damaging(0.906) | TCGA-E9-A54Y-01 | Breast | breast invasive carcinoma | Female | <65 | III/IV | Unknown | Unknown | SD |
| AEBP1 | SNV | Missense_Mutation | rs768189740 | c.2000C>T | p.Ser667Leu | p.S667L | Q8IUX7 | protein_coding | deleterious(0) | probably_damaging(0.988) | TCGA-PE-A5DE-01 | Breast | breast invasive carcinoma | Female | <65 | I/II | Chemotherapy | taxotere | CR |
| AEBP1 | deletion | In_Frame_Del | rs755132794 | c.3043_3057delNNNNNNNNNNNNNNN | p.Gln1020_Gln1024del | p.Q1020_Q1024del | Q8IUX7 | protein_coding | TCGA-A7-A0DB-01 | Breast | breast invasive carcinoma | Female | <65 | I/II | Hormone Therapy | arimidex | SD |
| Page: 1 2 3 4 5 6 7 8 9 10 11 12 13 14 |
Top |
Related drugs of malignant transformation related genes |
| Identification of chemicals and drugs interact with genes involved in malignant transfromation |
| (DGIdb 4.0) |
| Entrez ID | Symbol | Category | Interaction Types | Drug Claim Name | Drug Name | PMIDs |
| Page: 1 |

Copyright 2023-Present -The University of Texas Health Science Center at Houston |