
|
|||||
|
 | |
| |
| |
| |
| |
| |
|
Gene: ADSSL1 |
Gene summary for ADSSL1 |
| Gene information | Species | Human | Gene symbol | ADSSL1 | Gene ID | 122622 |
| Gene name | adenylosuccinate synthase 1 | |
| Gene Alias | ADSSL1 | |
| Cytomap | 14q32.33 | |
| Gene Type | protein-coding | GO ID | GO:0002376 | UniProtAcc | B3KTV4 |
Top |
Malignant transformation analysis |
| Identification of the aberrant gene expression in precancerous and cancerous lesions by comparing the gene expression of stem-like cells in diseased tissues with normal stem cells |
| Entrez ID | Symbol | Replicates | Species | Organ | Tissue | Adj P-value | Log2FC | Malignancy |
| 122622 | ADSSL1 | LZE2T | Human | Esophagus | ESCC | 4.44e-02 | 3.56e-01 | 0.082 |
| 122622 | ADSSL1 | LZE8T | Human | Esophagus | ESCC | 8.15e-04 | 1.26e-01 | 0.067 |
| 122622 | ADSSL1 | LZE20T | Human | Esophagus | ESCC | 1.07e-02 | 1.46e-01 | 0.0662 |
| 122622 | ADSSL1 | P2T-E | Human | Esophagus | ESCC | 7.98e-13 | 2.51e-01 | 0.1177 |
| 122622 | ADSSL1 | P4T-E | Human | Esophagus | ESCC | 2.63e-05 | 8.76e-02 | 0.1323 |
| 122622 | ADSSL1 | P5T-E | Human | Esophagus | ESCC | 1.88e-04 | 1.00e-01 | 0.1327 |
| 122622 | ADSSL1 | P8T-E | Human | Esophagus | ESCC | 3.75e-03 | 9.23e-02 | 0.0889 |
| 122622 | ADSSL1 | P11T-E | Human | Esophagus | ESCC | 9.12e-03 | 2.15e-01 | 0.1426 |
| 122622 | ADSSL1 | P12T-E | Human | Esophagus | ESCC | 1.14e-09 | 2.16e-01 | 0.1122 |
| 122622 | ADSSL1 | P15T-E | Human | Esophagus | ESCC | 1.29e-24 | 5.37e-01 | 0.1149 |
| 122622 | ADSSL1 | P26T-E | Human | Esophagus | ESCC | 3.75e-03 | 9.91e-02 | 0.1276 |
| 122622 | ADSSL1 | P27T-E | Human | Esophagus | ESCC | 2.13e-27 | 4.45e-01 | 0.1055 |
| 122622 | ADSSL1 | P28T-E | Human | Esophagus | ESCC | 1.61e-32 | 5.66e-01 | 0.1149 |
| 122622 | ADSSL1 | P30T-E | Human | Esophagus | ESCC | 3.44e-05 | 2.35e-01 | 0.137 |
| 122622 | ADSSL1 | P32T-E | Human | Esophagus | ESCC | 2.16e-19 | 3.65e-01 | 0.1666 |
| 122622 | ADSSL1 | P37T-E | Human | Esophagus | ESCC | 7.04e-15 | 3.14e-01 | 0.1371 |
| 122622 | ADSSL1 | P39T-E | Human | Esophagus | ESCC | 1.02e-05 | 1.26e-01 | 0.0894 |
| 122622 | ADSSL1 | P42T-E | Human | Esophagus | ESCC | 6.41e-04 | 1.37e-01 | 0.1175 |
| 122622 | ADSSL1 | P47T-E | Human | Esophagus | ESCC | 1.33e-08 | 1.62e-01 | 0.1067 |
| 122622 | ADSSL1 | P48T-E | Human | Esophagus | ESCC | 3.50e-02 | 8.35e-02 | 0.0959 |
| Page: 1 2 3 |
| Tissue | Expression Dynamics | Abbreviation |
| Esophagus | 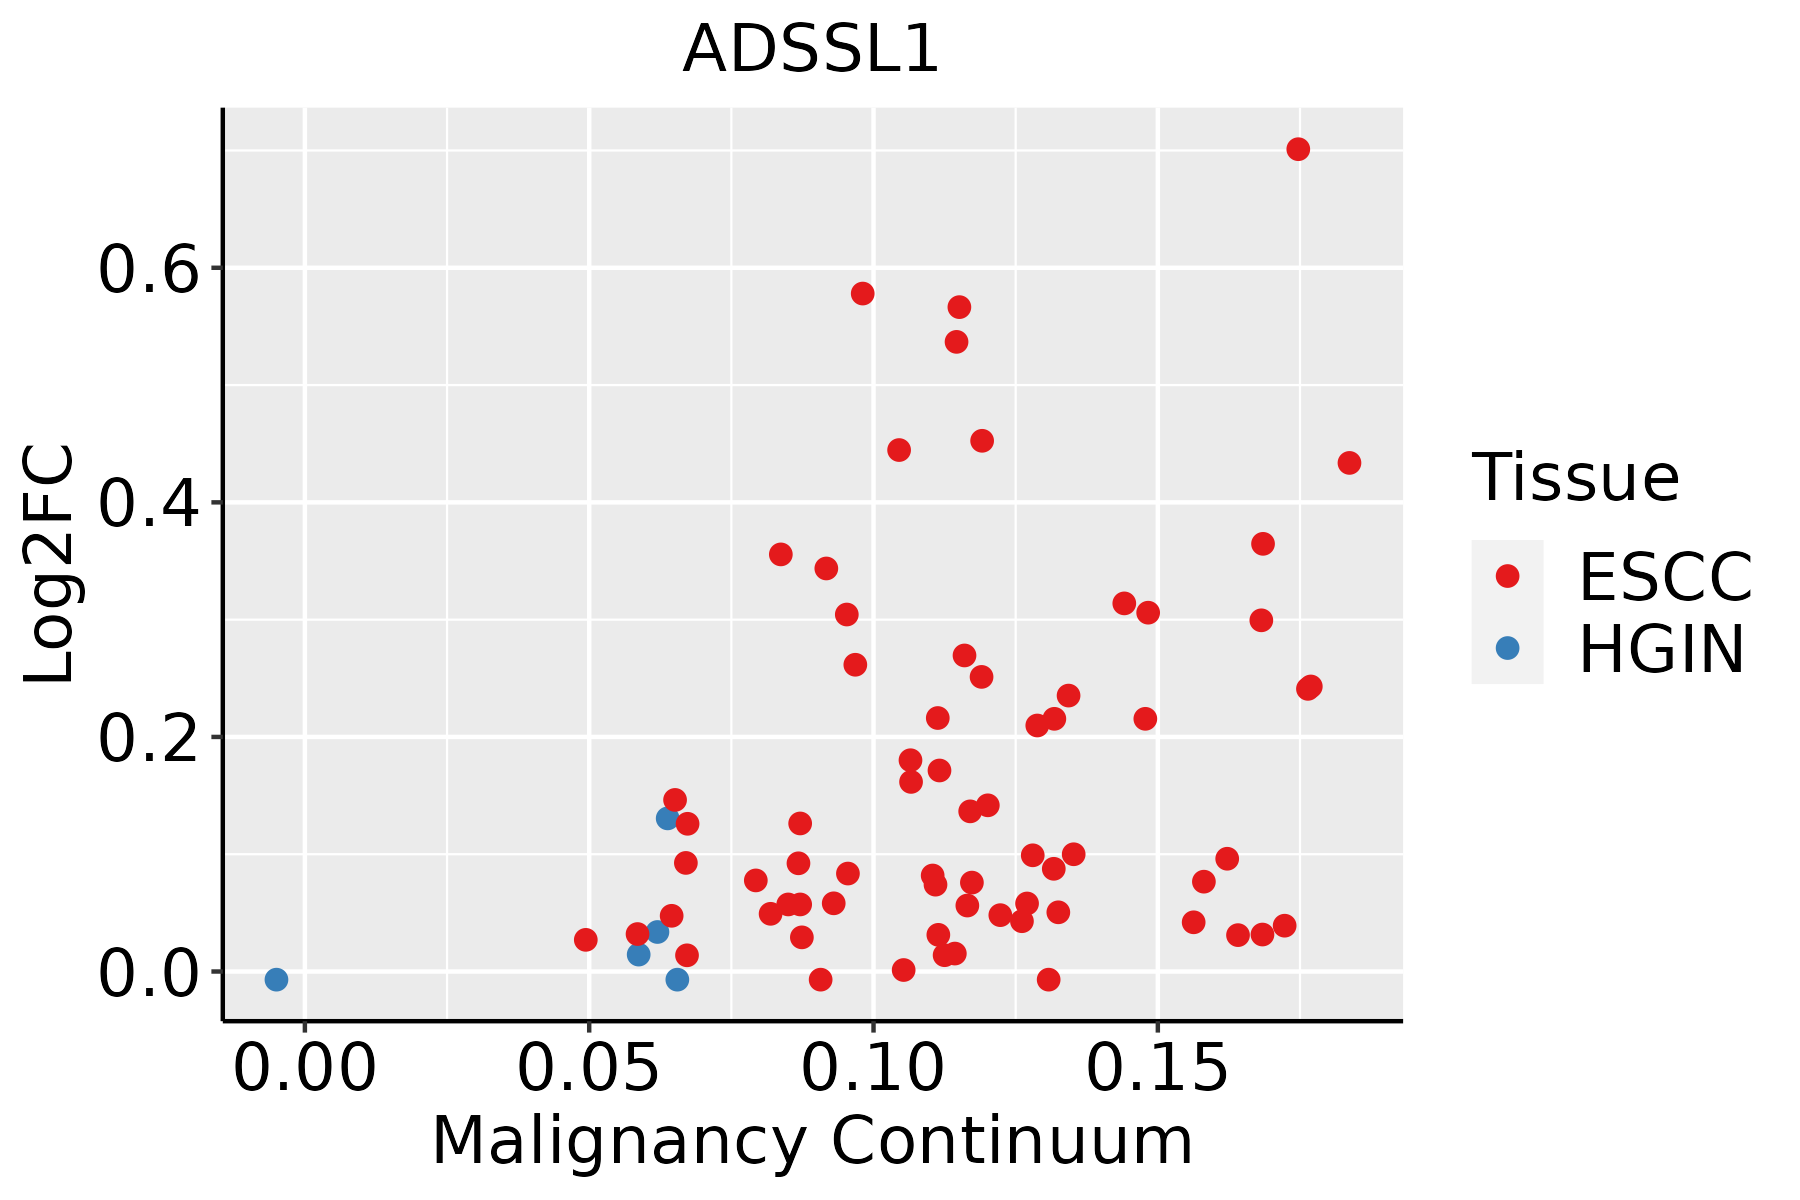 | ESCC: Esophageal squamous cell carcinoma |
| HGIN: High-grade intraepithelial neoplasias | ||
| LGIN: Low-grade intraepithelial neoplasias | ||
| Liver | 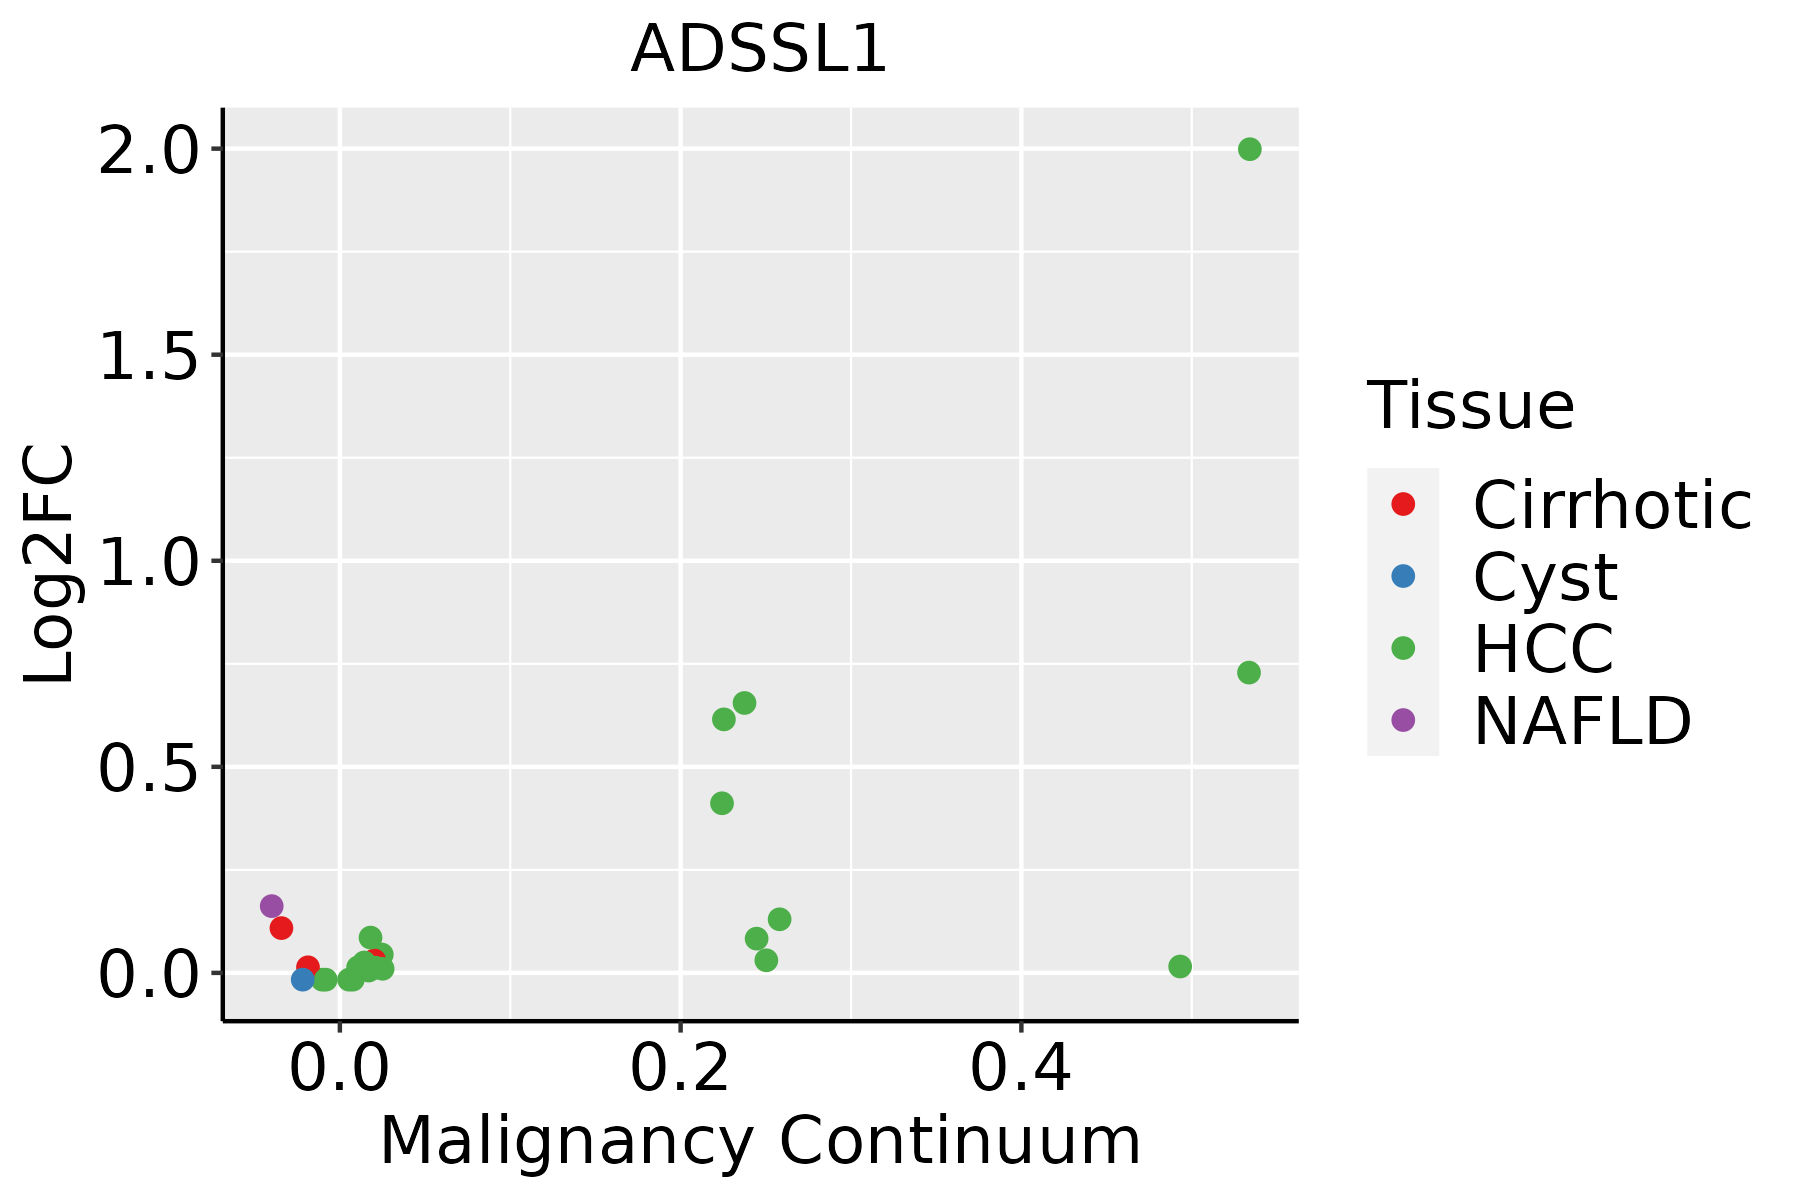 | HCC: Hepatocellular carcinoma |
| NAFLD: Non-alcoholic fatty liver disease | ||
| Oral Cavity | 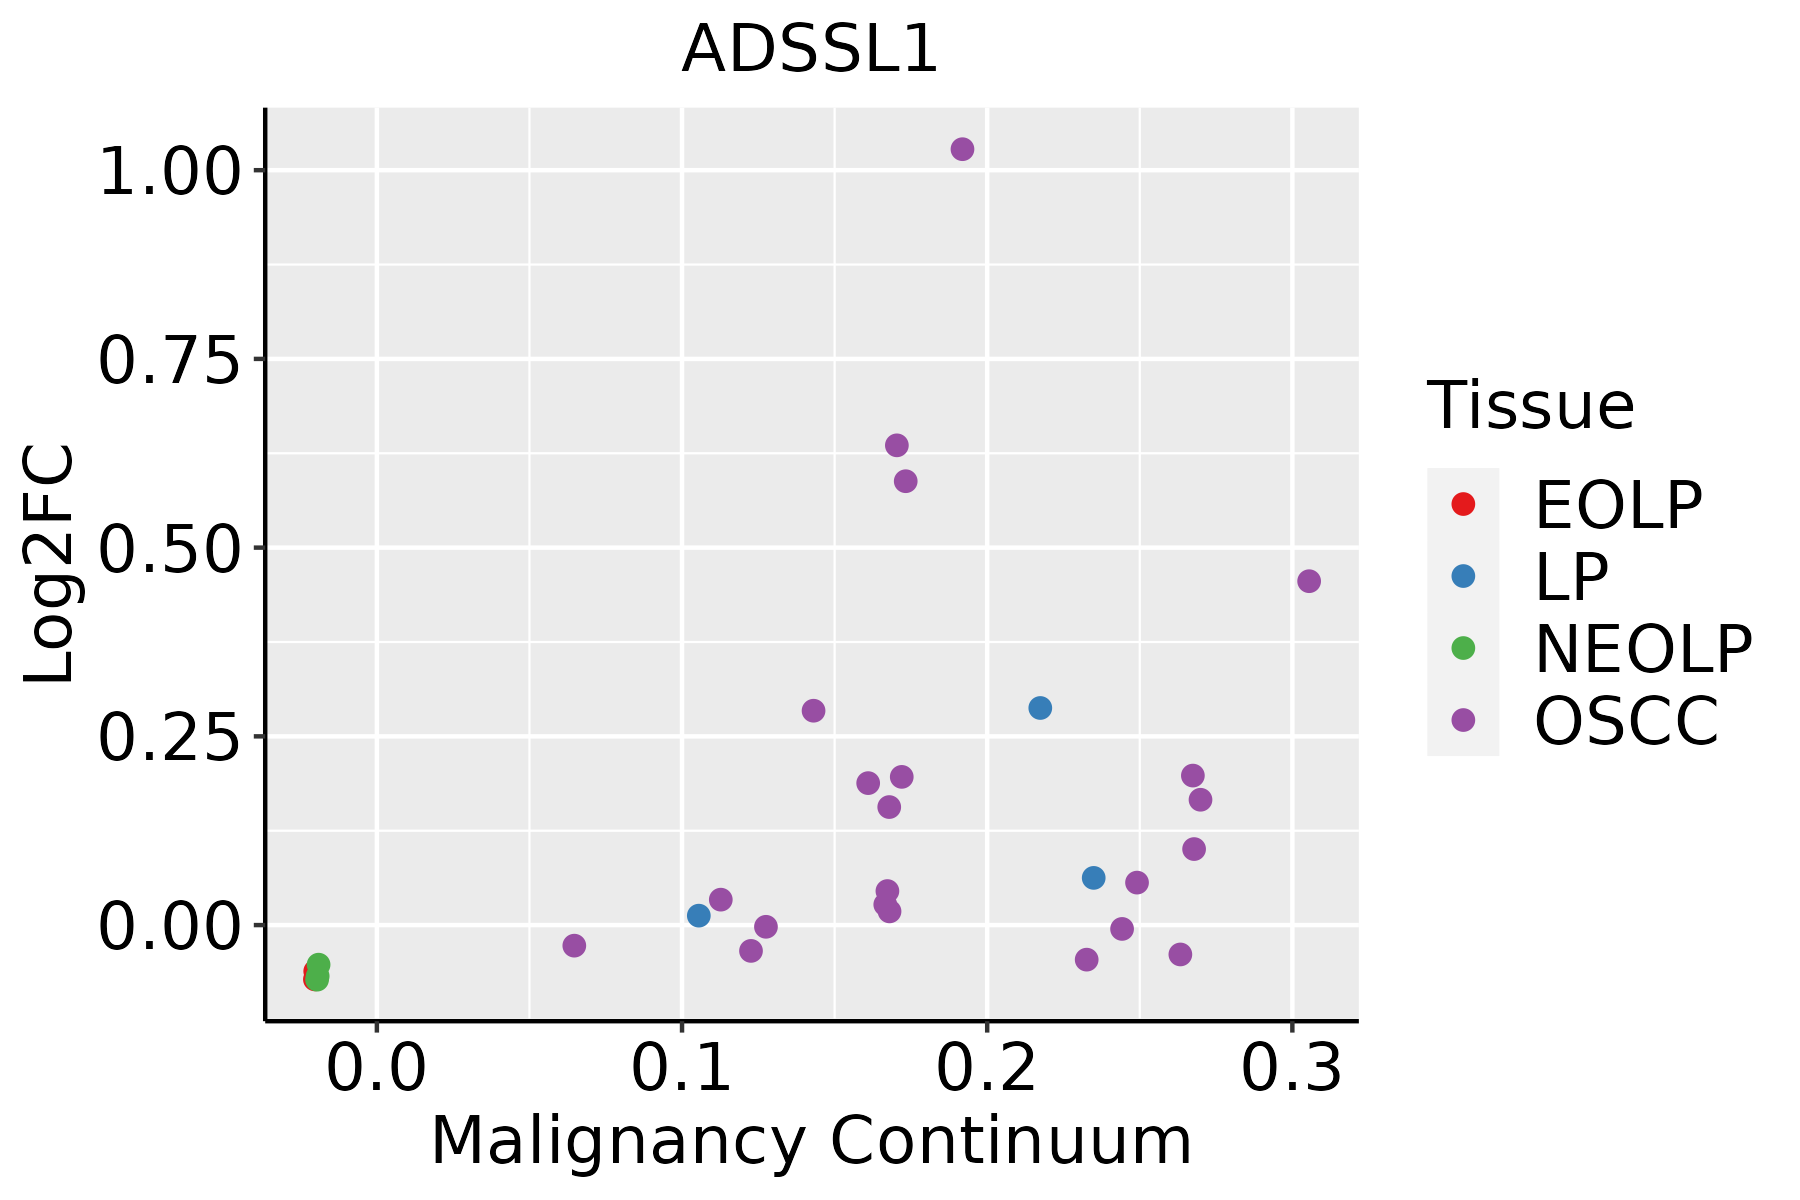 | EOLP: Erosive Oral lichen planus |
| LP: leukoplakia | ||
| NEOLP: Non-erosive oral lichen planus | ||
| OSCC: Oral squamous cell carcinoma |
| ∗log2FC in expression of this searched gene in stem-like cells from each diseased tissue sample relative to stem-like cells in normal samples in each tissue plotted against the malignancy continuum. Samples are colored based on if they are from different disease stage. |
Top |
Malignant transformation related pathway analysis |
| Find out the enriched GO biological processes and KEGG pathways involved in transition from healthy to precancer to cancer |
| Tissue | Disease Stage | Enriched GO biological Processes |
| Colorectum | AD |  |
| Colorectum | SER |  |
| Colorectum | MSS |  |
| Colorectum | MSI-H |  |
| Colorectum | FAP |  |
| ∗Top 15 enriched GO BP terms are showed in the bar plot of each disease state in each tissue. Each row represents a significant GO biological process which is colored according to the -log10(p.adjust). |
| Page: 1 2 3 4 5 6 7 8 9 |
| GO ID | Tissue | Disease Stage | Description | Gene Ratio | Bg Ratio | pvalue | p.adjust | Count |
| Page: 1 |
| Pathway ID | Tissue | Disease Stage | Description | Gene Ratio | Bg Ratio | pvalue | p.adjust | qvalue | Count |
| Page: 1 |
Top |
Cell-cell communication analysis |
| Identification of potential cell-cell interactions between two cell types and their ligand-receptor pairs for different disease states |
| Ligand | Receptor | LRpair | Pathway | Tissue | Disease Stage |
| Page: 1 |
Top |
Single-cell gene regulatory network inference analysis |
| Find out the significant the regulons (TFs) and the target genes of each regulon across cell types for different disease states |
| TF | Cell Type | Tissue | Disease Stage | Target Gene | RSS | Regulon Activity |
| ∗The dot plots of a searched regulon are shown for all cell subpopulations in each disease state of each tissue based on the regulon specific score inferred using pySCENIC and by calculating the average expression. |
| Page: 1 |
Top |
Somatic mutation of malignant transformation related genes |
| Annotation of somatic variants for genes involved in malignant transformation |
| Hugo Symbol | Variant Class | Variant Classification | dbSNP RS | HGVSc | HGVSp | HGVSp Short | SWISSPROT | BIOTYPE | SIFT | PolyPhen | Tumor Sample Barcode | Tissue | Histology | Sex | Age | Stage | Therapy Types | Drugs | Outcome |
| ADSSL1 | SNV | Missense_Mutation | c.236N>A | p.Arg79Lys | p.R79K | Q8N142 | protein_coding | tolerated_low_confidence(0.21) | benign(0) | TCGA-AC-A23H-01 | Breast | breast invasive carcinoma | Female | >=65 | I/II | Unknown | Unknown | PD | |
| ADSSL1 | insertion | Frame_Shift_Ins | novel | c.815_816insGT | p.Pro273TyrfsTer42 | p.P273Yfs*42 | Q8N142 | protein_coding | TCGA-A2-A0D4-01 | Breast | breast invasive carcinoma | Female | <65 | I/II | Chemotherapy | adriamycin | SD | ||
| ADSSL1 | SNV | Missense_Mutation | c.121C>T | p.Pro41Ser | p.P41S | Q8N142 | protein_coding | deleterious_low_confidence(0) | benign(0.039) | TCGA-BI-A0VR-01 | Cervix | cervical & endocervical cancer | Female | <65 | III/IV | Unknown | Unknown | SD | |
| ADSSL1 | SNV | Missense_Mutation | novel | c.239G>T | p.Ser80Ile | p.S80I | Q8N142 | protein_coding | deleterious_low_confidence(0.02) | benign(0) | TCGA-VS-A9V4-01 | Cervix | cervical & endocervical cancer | Female | <65 | I/II | Chemotherapy | cisplatin | PD |
| ADSSL1 | SNV | Missense_Mutation | novel | c.1147N>A | p.Gly383Ser | p.G383S | Q8N142 | protein_coding | deleterious(0) | probably_damaging(0.995) | TCGA-5M-AAT6-01 | Colorectum | colon adenocarcinoma | Female | <65 | III/IV | Unknown | Unknown | PD |
| ADSSL1 | SNV | Missense_Mutation | c.1251A>T | p.Lys417Asn | p.K417N | Q8N142 | protein_coding | deleterious(0) | probably_damaging(0.982) | TCGA-AA-3713-01 | Colorectum | colon adenocarcinoma | Male | >=65 | III/IV | Chemotherapy | 5-fluorouracil | PR | |
| ADSSL1 | SNV | Missense_Mutation | c.1361N>T | p.Ala454Val | p.A454V | Q8N142 | protein_coding | tolerated(0.08) | benign(0.001) | TCGA-AD-6889-01 | Colorectum | colon adenocarcinoma | Male | >=65 | I/II | Chemotherapy | xeloda | PD | |
| ADSSL1 | SNV | Missense_Mutation | c.976N>T | p.Gly326Cys | p.G326C | Q8N142 | protein_coding | deleterious(0) | probably_damaging(1) | TCGA-AU-6004-01 | Colorectum | colon adenocarcinoma | Female | >=65 | I/II | Unknown | Unknown | SD | |
| ADSSL1 | SNV | Missense_Mutation | novel | c.1498T>C | p.Phe500Leu | p.F500L | Q8N142 | protein_coding | tolerated_low_confidence(0.07) | possibly_damaging(0.876) | TCGA-CA-6717-01 | Colorectum | colon adenocarcinoma | Male | <65 | I/II | Chemotherapy | oxaliplatin | CR |
| ADSSL1 | SNV | Missense_Mutation | c.364N>A | p.Glu122Lys | p.E122K | Q8N142 | protein_coding | tolerated(0.61) | benign(0.031) | TCGA-CK-4951-01 | Colorectum | colon adenocarcinoma | Female | >=65 | I/II | Unknown | Unknown | PD |
| Page: 1 2 3 4 5 |
Top |
Related drugs of malignant transformation related genes |
| Identification of chemicals and drugs interact with genes involved in malignant transfromation |
| (DGIdb 4.0) |
| Entrez ID | Symbol | Category | Interaction Types | Drug Claim Name | Drug Name | PMIDs |
| Page: 1 |

Copyright 2023-Present -The University of Texas Health Science Center at Houston |