
|
|||||
|
 | |
| |
| |
| |
| |
| |
|
Gene: ADSS |
Gene summary for ADSS |
| Gene information | Species | Human | Gene symbol | ADSS | Gene ID | 159 |
| Gene name | adenylosuccinate synthase 2 | |
| Gene Alias | ADEH | |
| Cytomap | 1q44 | |
| Gene Type | protein-coding | GO ID | GO:0002376 | UniProtAcc | A0A024R5Q7 |
Top |
Malignant transformation analysis |
| Identification of the aberrant gene expression in precancerous and cancerous lesions by comparing the gene expression of stem-like cells in diseased tissues with normal stem cells |
| Entrez ID | Symbol | Replicates | Species | Organ | Tissue | Adj P-value | Log2FC | Malignancy |
| 159 | ADSS | CCI_1 | Human | Cervix | CC | 2.30e-07 | 4.71e-01 | 0.528 |
| 159 | ADSS | CCI_2 | Human | Cervix | CC | 1.21e-16 | 7.72e-01 | 0.5249 |
| 159 | ADSS | CCI_3 | Human | Cervix | CC | 1.09e-21 | 6.72e-01 | 0.516 |
| 159 | ADSS | Tumor | Human | Cervix | CC | 2.75e-23 | 3.75e-01 | 0.1241 |
| 159 | ADSS | sample1 | Human | Cervix | CC | 1.79e-10 | 3.45e-01 | 0.0959 |
| 159 | ADSS | sample3 | Human | Cervix | CC | 1.54e-22 | 3.51e-01 | 0.1387 |
| 159 | ADSS | H2 | Human | Cervix | HSIL_HPV | 1.49e-13 | 2.81e-01 | 0.0632 |
| 159 | ADSS | L1 | Human | Cervix | CC | 2.73e-08 | 3.40e-01 | 0.0802 |
| 159 | ADSS | T1 | Human | Cervix | CC | 3.80e-12 | 2.45e-01 | 0.0918 |
| 159 | ADSS | T2 | Human | Cervix | CC | 1.25e-04 | 2.40e-01 | 0.0709 |
| 159 | ADSS | T3 | Human | Cervix | CC | 4.88e-24 | 3.29e-01 | 0.1389 |
| 159 | ADSS | LZE2D | Human | Esophagus | HGIN | 2.86e-02 | 1.58e-01 | 0.0642 |
| 159 | ADSS | LZE2T | Human | Esophagus | ESCC | 2.24e-03 | 8.14e-01 | 0.082 |
| 159 | ADSS | LZE4T | Human | Esophagus | ESCC | 1.39e-19 | 8.31e-01 | 0.0811 |
| 159 | ADSS | LZE7T | Human | Esophagus | ESCC | 1.61e-15 | 1.35e+00 | 0.0667 |
| 159 | ADSS | LZE8T | Human | Esophagus | ESCC | 1.87e-07 | 3.22e-01 | 0.067 |
| 159 | ADSS | LZE22D1 | Human | Esophagus | HGIN | 1.47e-03 | 3.57e-02 | 0.0595 |
| 159 | ADSS | LZE22T | Human | Esophagus | ESCC | 2.50e-09 | 8.79e-01 | 0.068 |
| 159 | ADSS | LZE24T | Human | Esophagus | ESCC | 6.72e-23 | 8.19e-01 | 0.0596 |
| 159 | ADSS | LZE6T | Human | Esophagus | ESCC | 1.83e-03 | 2.71e-01 | 0.0845 |
| Page: 1 2 3 4 5 6 7 |
| Tissue | Expression Dynamics | Abbreviation |
| Cervix |  | CC: Cervix cancer |
| HSIL_HPV: HPV-infected high-grade squamous intraepithelial lesions | ||
| N_HPV: HPV-infected normal cervix | ||
| Esophagus | 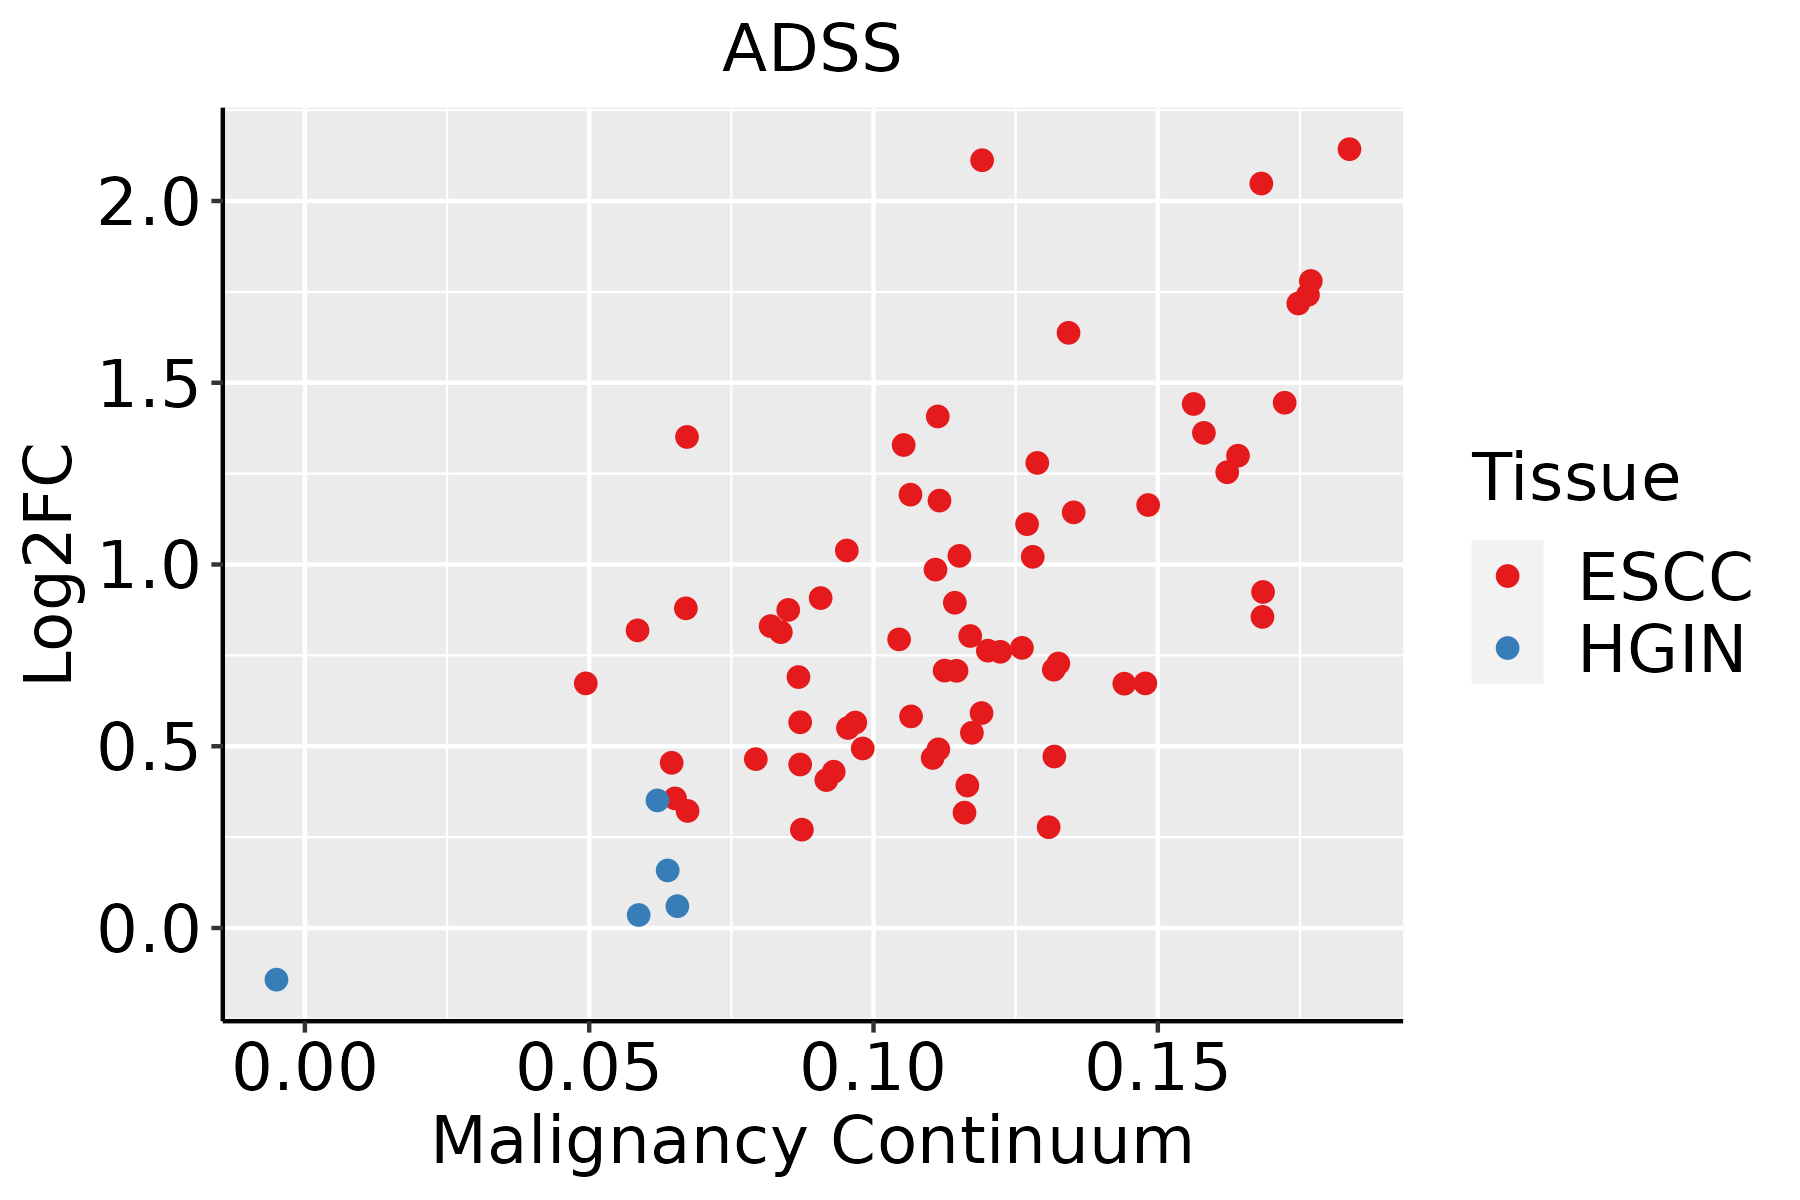 | ESCC: Esophageal squamous cell carcinoma |
| HGIN: High-grade intraepithelial neoplasias | ||
| LGIN: Low-grade intraepithelial neoplasias | ||
| Liver | 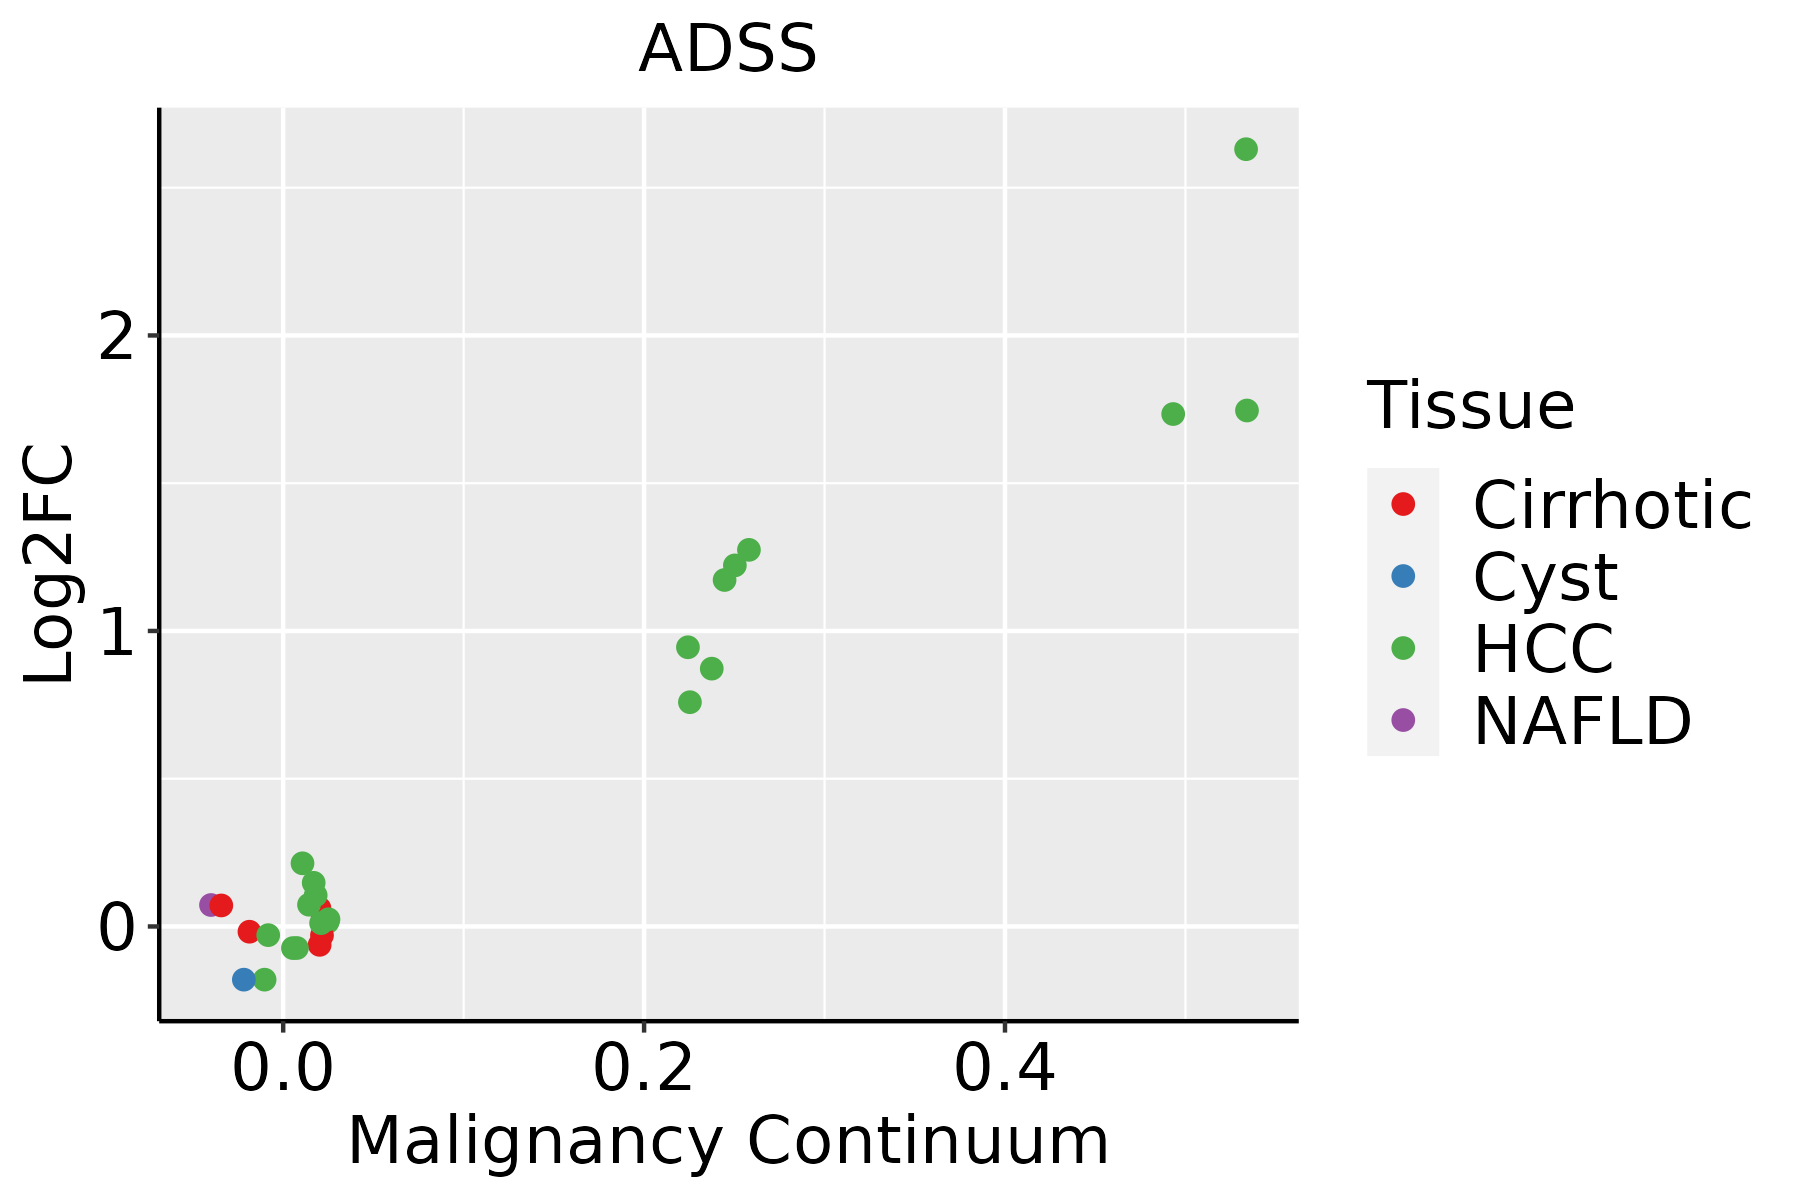 | HCC: Hepatocellular carcinoma |
| NAFLD: Non-alcoholic fatty liver disease | ||
| Oral Cavity | 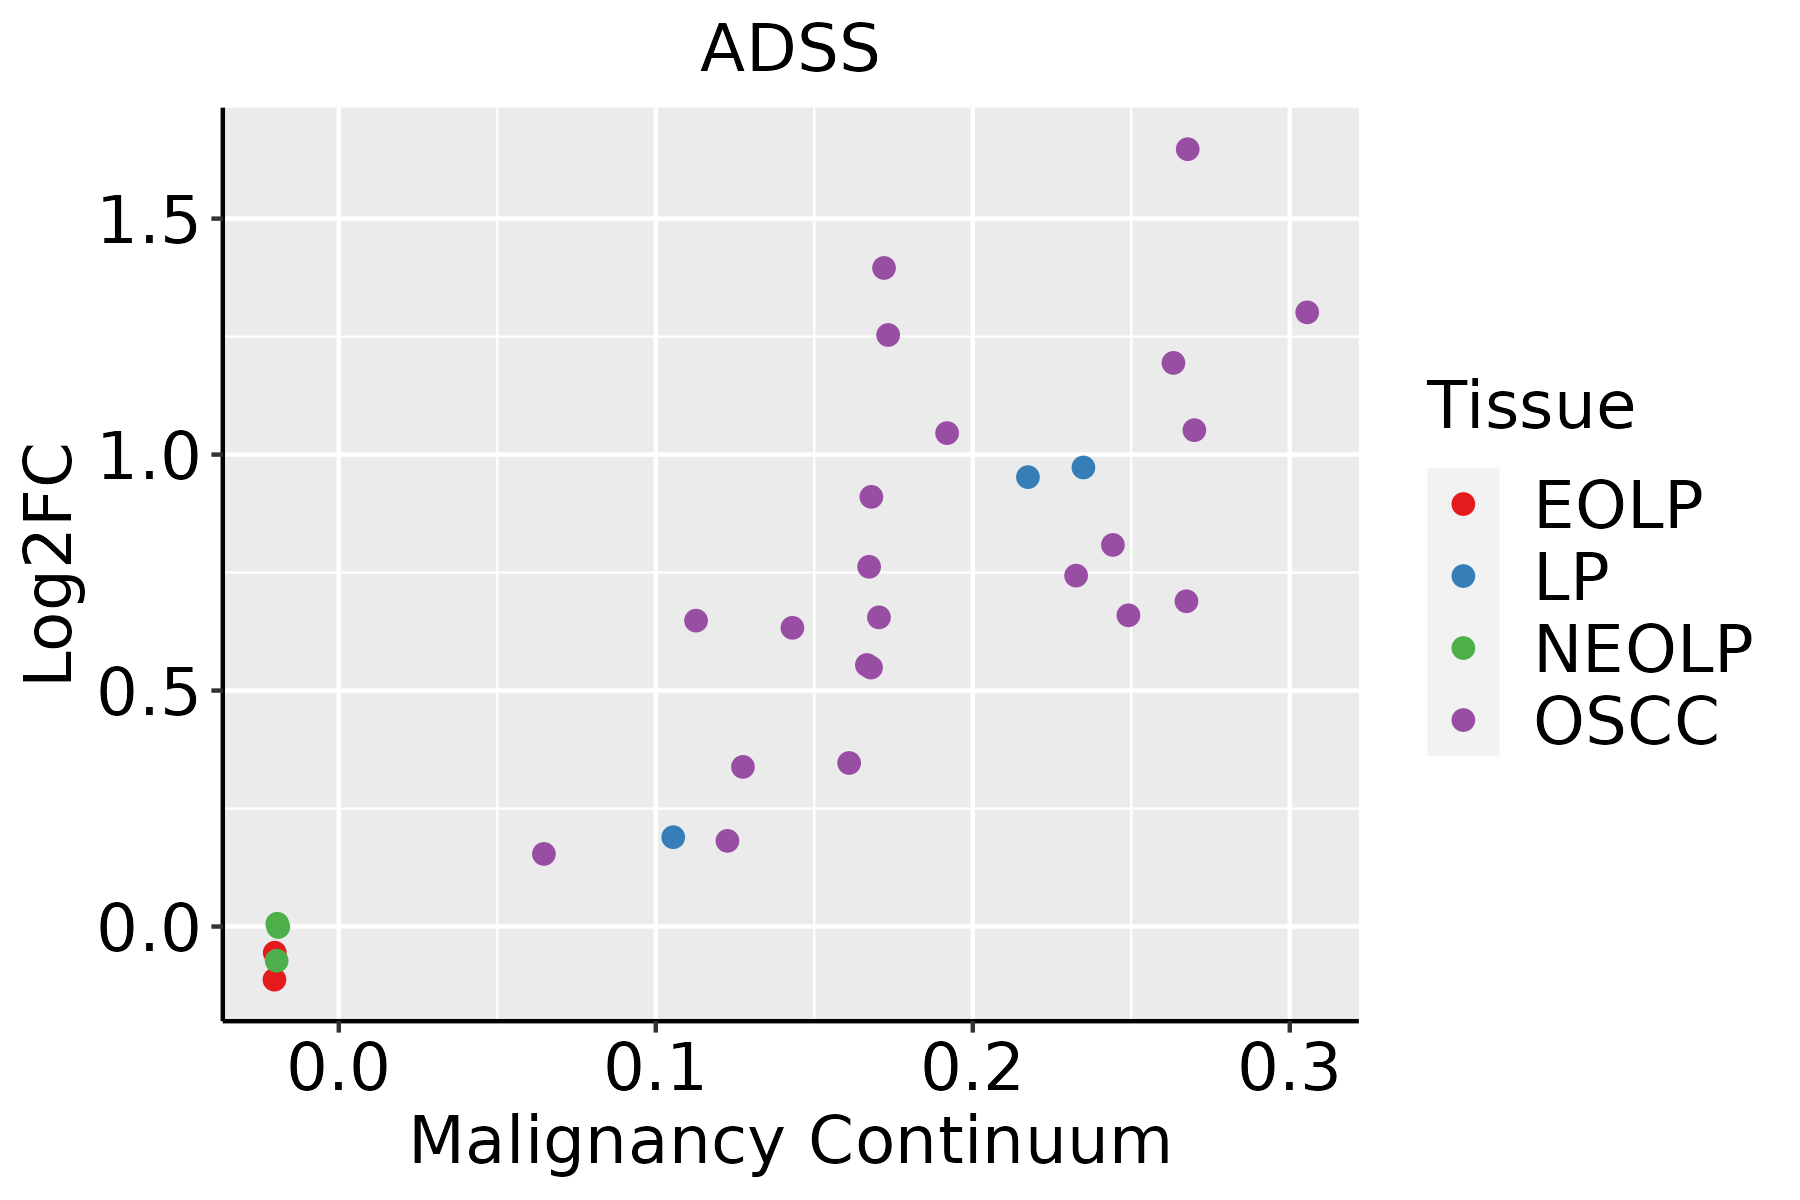 | EOLP: Erosive Oral lichen planus |
| LP: leukoplakia | ||
| NEOLP: Non-erosive oral lichen planus | ||
| OSCC: Oral squamous cell carcinoma | ||
| Skin | 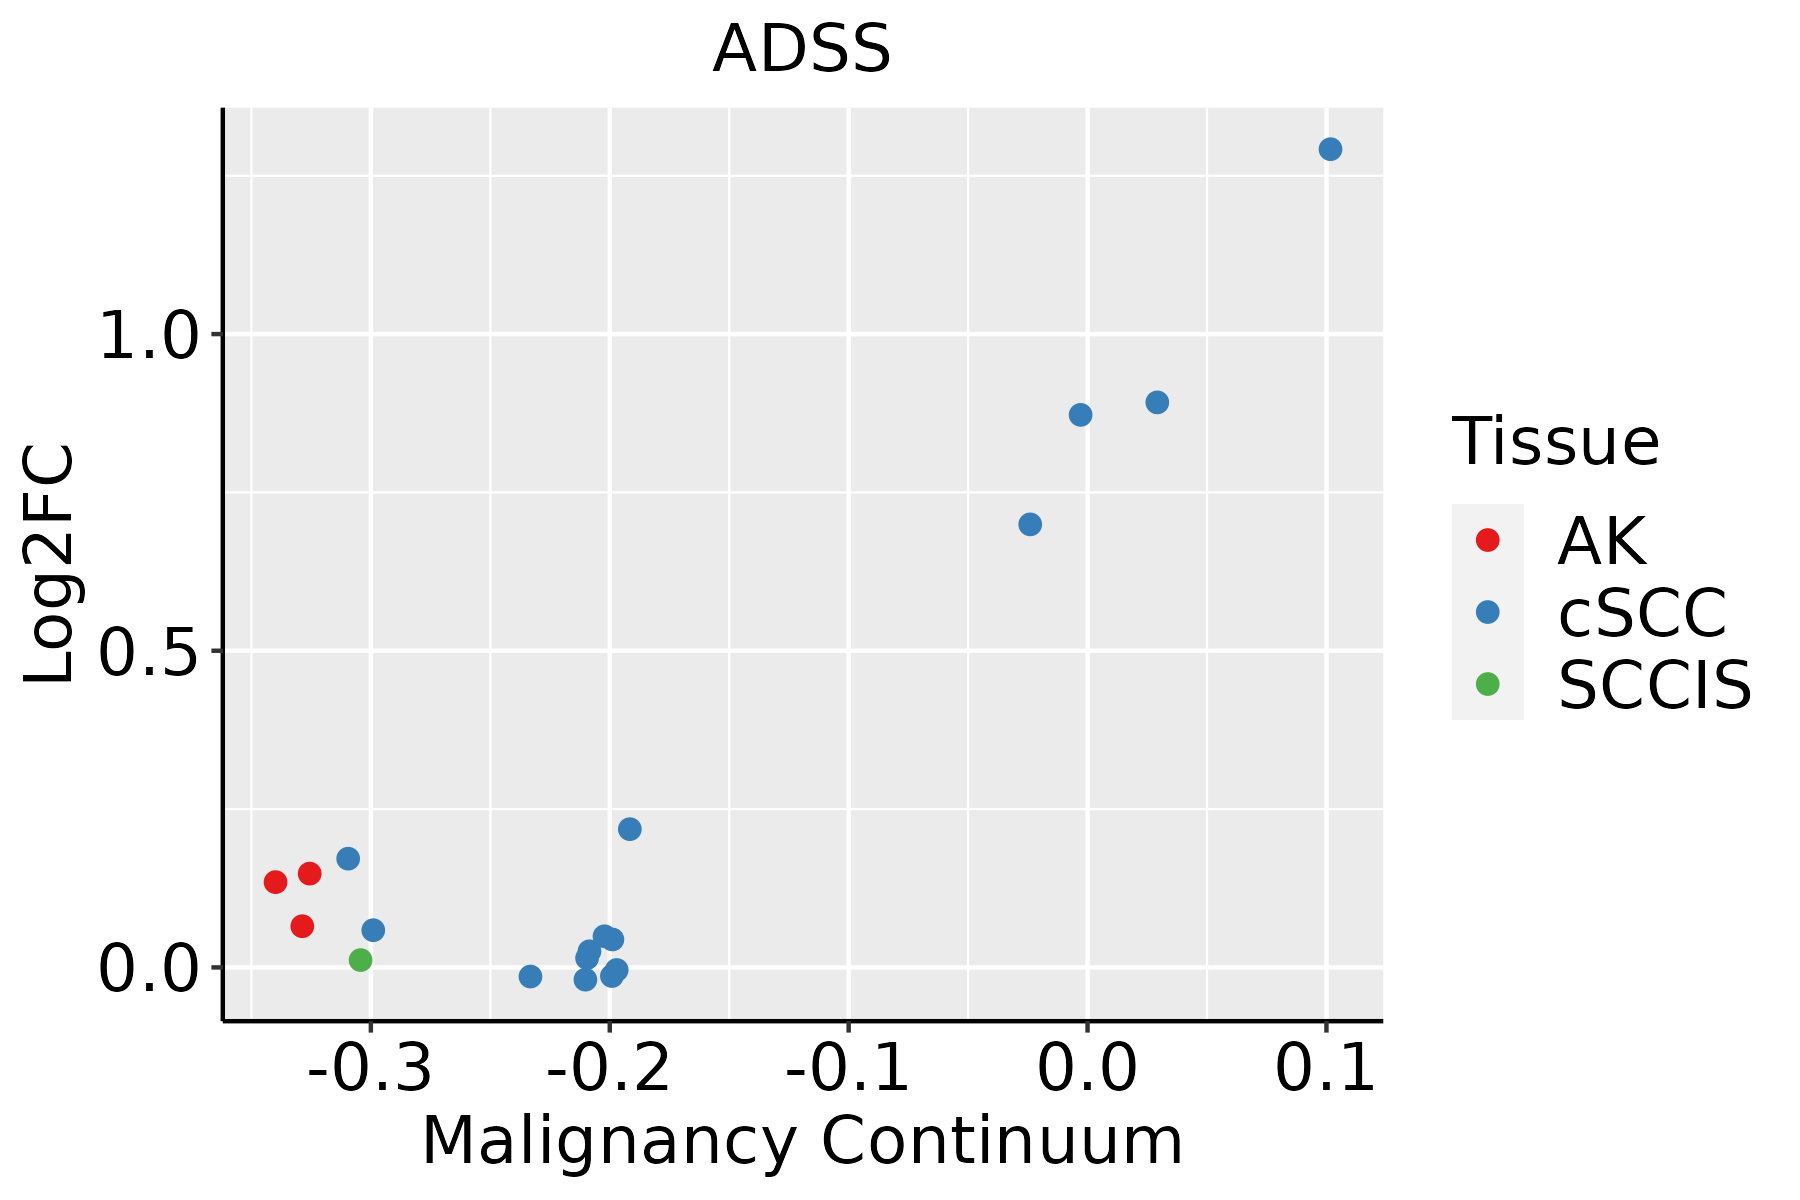 | AK: Actinic keratosis |
| cSCC: Cutaneous squamous cell carcinoma | ||
| SCCIS:squamous cell carcinoma in situ | ||
| Thyroid |  | ATC: Anaplastic thyroid cancer |
| HT: Hashimoto's thyroiditis | ||
| PTC: Papillary thyroid cancer |
| ∗log2FC in expression of this searched gene in stem-like cells from each diseased tissue sample relative to stem-like cells in normal samples in each tissue plotted against the malignancy continuum. Samples are colored based on if they are from different disease stage. |
Top |
Malignant transformation related pathway analysis |
| Find out the enriched GO biological processes and KEGG pathways involved in transition from healthy to precancer to cancer |
| Tissue | Disease Stage | Enriched GO biological Processes |
| Colorectum | AD |  |
| Colorectum | SER |  |
| Colorectum | MSS |  |
| Colorectum | MSI-H |  |
| Colorectum | FAP |  |
| ∗Top 15 enriched GO BP terms are showed in the bar plot of each disease state in each tissue. Each row represents a significant GO biological process which is colored according to the -log10(p.adjust). |
| Page: 1 2 3 4 5 6 7 8 9 |
| GO ID | Tissue | Disease Stage | Description | Gene Ratio | Bg Ratio | pvalue | p.adjust | Count |
| Page: 1 |
| Pathway ID | Tissue | Disease Stage | Description | Gene Ratio | Bg Ratio | pvalue | p.adjust | qvalue | Count |
| Page: 1 |
Top |
Cell-cell communication analysis |
| Identification of potential cell-cell interactions between two cell types and their ligand-receptor pairs for different disease states |
| Ligand | Receptor | LRpair | Pathway | Tissue | Disease Stage |
| Page: 1 |
Top |
Single-cell gene regulatory network inference analysis |
| Find out the significant the regulons (TFs) and the target genes of each regulon across cell types for different disease states |
| TF | Cell Type | Tissue | Disease Stage | Target Gene | RSS | Regulon Activity |
| ∗The dot plots of a searched regulon are shown for all cell subpopulations in each disease state of each tissue based on the regulon specific score inferred using pySCENIC and by calculating the average expression. |
| Page: 1 |
Top |
Somatic mutation of malignant transformation related genes |
| Annotation of somatic variants for genes involved in malignant transformation |
| Hugo Symbol | Variant Class | Variant Classification | dbSNP RS | HGVSc | HGVSp | HGVSp Short | SWISSPROT | BIOTYPE | SIFT | PolyPhen | Tumor Sample Barcode | Tissue | Histology | Sex | Age | Stage | Therapy Types | Drugs | Outcome |
| ADSS | SNV | Missense_Mutation | c.1152C>G | p.Ile384Met | p.I384M | P30520 | protein_coding | tolerated(0.1) | benign(0.007) | TCGA-A8-A06R-01 | Breast | breast invasive carcinoma | Female | >=65 | I/II | Chemotherapy | 5-fluorouracil | CR | |
| ADSS | SNV | Missense_Mutation | rs749735276 | c.512C>T | p.Ser171Leu | p.S171L | P30520 | protein_coding | deleterious(0) | probably_damaging(0.942) | TCGA-AN-A046-01 | Breast | breast invasive carcinoma | Female | >=65 | I/II | Unknown | Unknown | SD |
| ADSS | SNV | Missense_Mutation | c.640N>C | p.Glu214Gln | p.E214Q | P30520 | protein_coding | deleterious(0.01) | possibly_damaging(0.659) | TCGA-D8-A27G-01 | Breast | breast invasive carcinoma | Female | >=65 | I/II | Unknown | Unknown | SD | |
| ADSS | insertion | In_Frame_Ins | novel | c.968_969insTGG | p.Thr323_Arg324insGly | p.T323_R324insG | P30520 | protein_coding | TCGA-AN-A03X-01 | Breast | breast invasive carcinoma | Female | >=65 | I/II | Unknown | Unknown | SD | ||
| ADSS | insertion | Frame_Shift_Ins | novel | c.966_967insGCCAGCAGGCAAGGAATGGAGTC | p.Thr323AlafsTer16 | p.T323Afs*16 | P30520 | protein_coding | TCGA-AN-A03X-01 | Breast | breast invasive carcinoma | Female | >=65 | I/II | Unknown | Unknown | SD | ||
| ADSS | SNV | Missense_Mutation | novel | c.1274C>T | p.Ala425Val | p.A425V | P30520 | protein_coding | deleterious(0) | probably_damaging(0.991) | TCGA-2W-A8YY-01 | Cervix | cervical & endocervical cancer | Female | <65 | I/II | Chemotherapy | cisplatin | CR |
| ADSS | insertion | Frame_Shift_Ins | novel | c.656_657dupAA | p.Leu220AsnfsTer13 | p.L220Nfs*13 | P30520 | protein_coding | TCGA-Q1-A73O-01 | Cervix | cervical & endocervical cancer | Female | <65 | I/II | Chemotherapy | cisplatin | CR | ||
| ADSS | SNV | Missense_Mutation | c.1151T>A | p.Ile384Asn | p.I384N | P30520 | protein_coding | tolerated(0.43) | benign(0.001) | TCGA-CK-4951-01 | Colorectum | colon adenocarcinoma | Female | >=65 | I/II | Unknown | Unknown | PD | |
| ADSS | SNV | Missense_Mutation | rs769147508 | c.26C>T | p.Ala9Val | p.A9V | P30520 | protein_coding | tolerated_low_confidence(0.15) | benign(0.017) | TCGA-CM-5861-01 | Colorectum | colon adenocarcinoma | Female | <65 | I/II | Unknown | Unknown | PD |
| ADSS | SNV | Missense_Mutation | c.1289G>A | p.Arg430Gln | p.R430Q | P30520 | protein_coding | tolerated(0.26) | benign(0.011) | TCGA-AG-A002-01 | Colorectum | rectum adenocarcinoma | Male | <65 | I/II | Unknown | Unknown | SD |
| Page: 1 2 3 4 5 |
Top |
Related drugs of malignant transformation related genes |
| Identification of chemicals and drugs interact with genes involved in malignant transfromation |
| (DGIdb 4.0) |
| Entrez ID | Symbol | Category | Interaction Types | Drug Claim Name | Drug Name | PMIDs |
| Page: 1 |

Copyright 2023-Present -The University of Texas Health Science Center at Houston |