
|
|||||
|
 | |
| |
| |
| |
| |
| |
|
Gene: ADSL |
Gene summary for ADSL |
| Gene information | Species | Human | Gene symbol | ADSL | Gene ID | 158 |
| Gene name | adenylosuccinate lyase | |
| Gene Alias | AMPS | |
| Cytomap | 22q13.1 | |
| Gene Type | protein-coding | GO ID | GO:0001666 | UniProtAcc | P30566 |
Top |
Malignant transformation analysis |
| Identification of the aberrant gene expression in precancerous and cancerous lesions by comparing the gene expression of stem-like cells in diseased tissues with normal stem cells |
| Entrez ID | Symbol | Replicates | Species | Organ | Tissue | Adj P-value | Log2FC | Malignancy |
| 158 | ADSL | HTA11_3410_2000001011 | Human | Colorectum | AD | 5.90e-11 | 2.51e-01 | 0.0155 |
| 158 | ADSL | HTA11_2487_2000001011 | Human | Colorectum | SER | 2.44e-05 | 1.89e-01 | -0.1808 |
| 158 | ADSL | HTA11_2951_2000001011 | Human | Colorectum | AD | 3.34e-04 | 3.63e-01 | 0.0216 |
| 158 | ADSL | HTA11_1938_2000001011 | Human | Colorectum | AD | 3.43e-08 | 2.98e-01 | -0.0811 |
| 158 | ADSL | HTA11_78_2000001011 | Human | Colorectum | AD | 2.64e-09 | 3.12e-01 | -0.1088 |
| 158 | ADSL | HTA11_347_2000001011 | Human | Colorectum | AD | 6.75e-13 | 2.66e-01 | -0.1954 |
| 158 | ADSL | HTA11_411_2000001011 | Human | Colorectum | SER | 1.86e-06 | 4.38e-01 | -0.2602 |
| 158 | ADSL | HTA11_3361_2000001011 | Human | Colorectum | AD | 2.57e-07 | 3.50e-01 | -0.1207 |
| 158 | ADSL | HTA11_83_2000001011 | Human | Colorectum | SER | 2.70e-12 | 3.34e-01 | -0.1526 |
| 158 | ADSL | HTA11_696_2000001011 | Human | Colorectum | AD | 1.42e-14 | 3.33e-01 | -0.1464 |
| 158 | ADSL | HTA11_866_2000001011 | Human | Colorectum | AD | 2.07e-08 | 2.13e-01 | -0.1001 |
| 158 | ADSL | HTA11_1391_2000001011 | Human | Colorectum | AD | 4.56e-17 | 4.73e-01 | -0.059 |
| 158 | ADSL | HTA11_2992_2000001011 | Human | Colorectum | SER | 1.09e-02 | 2.39e-01 | -0.1706 |
| 158 | ADSL | HTA11_5212_2000001011 | Human | Colorectum | AD | 2.28e-02 | 1.93e-01 | -0.2061 |
| 158 | ADSL | HTA11_5216_2000001011 | Human | Colorectum | SER | 3.40e-03 | 3.63e-01 | -0.1462 |
| 158 | ADSL | HTA11_546_2000001011 | Human | Colorectum | AD | 2.76e-07 | 3.18e-01 | -0.0842 |
| 158 | ADSL | HTA11_7862_2000001011 | Human | Colorectum | AD | 2.47e-08 | 3.55e-01 | -0.0179 |
| 158 | ADSL | HTA11_866_3004761011 | Human | Colorectum | AD | 4.00e-26 | 5.50e-01 | 0.096 |
| 158 | ADSL | HTA11_4255_2000001011 | Human | Colorectum | SER | 2.49e-08 | 5.15e-01 | 0.0446 |
| 158 | ADSL | HTA11_8622_2000001021 | Human | Colorectum | SER | 1.95e-07 | 3.65e-01 | 0.0528 |
| Page: 1 2 3 4 5 6 7 |
| Tissue | Expression Dynamics | Abbreviation |
| Colorectum (GSE201348) |  | FAP: Familial adenomatous polyposis |
| CRC: Colorectal cancer | ||
| Colorectum (HTA11) |  | AD: Adenomas |
| SER: Sessile serrated lesions | ||
| MSI-H: Microsatellite-high colorectal cancer | ||
| MSS: Microsatellite stable colorectal cancer | ||
| Esophagus | 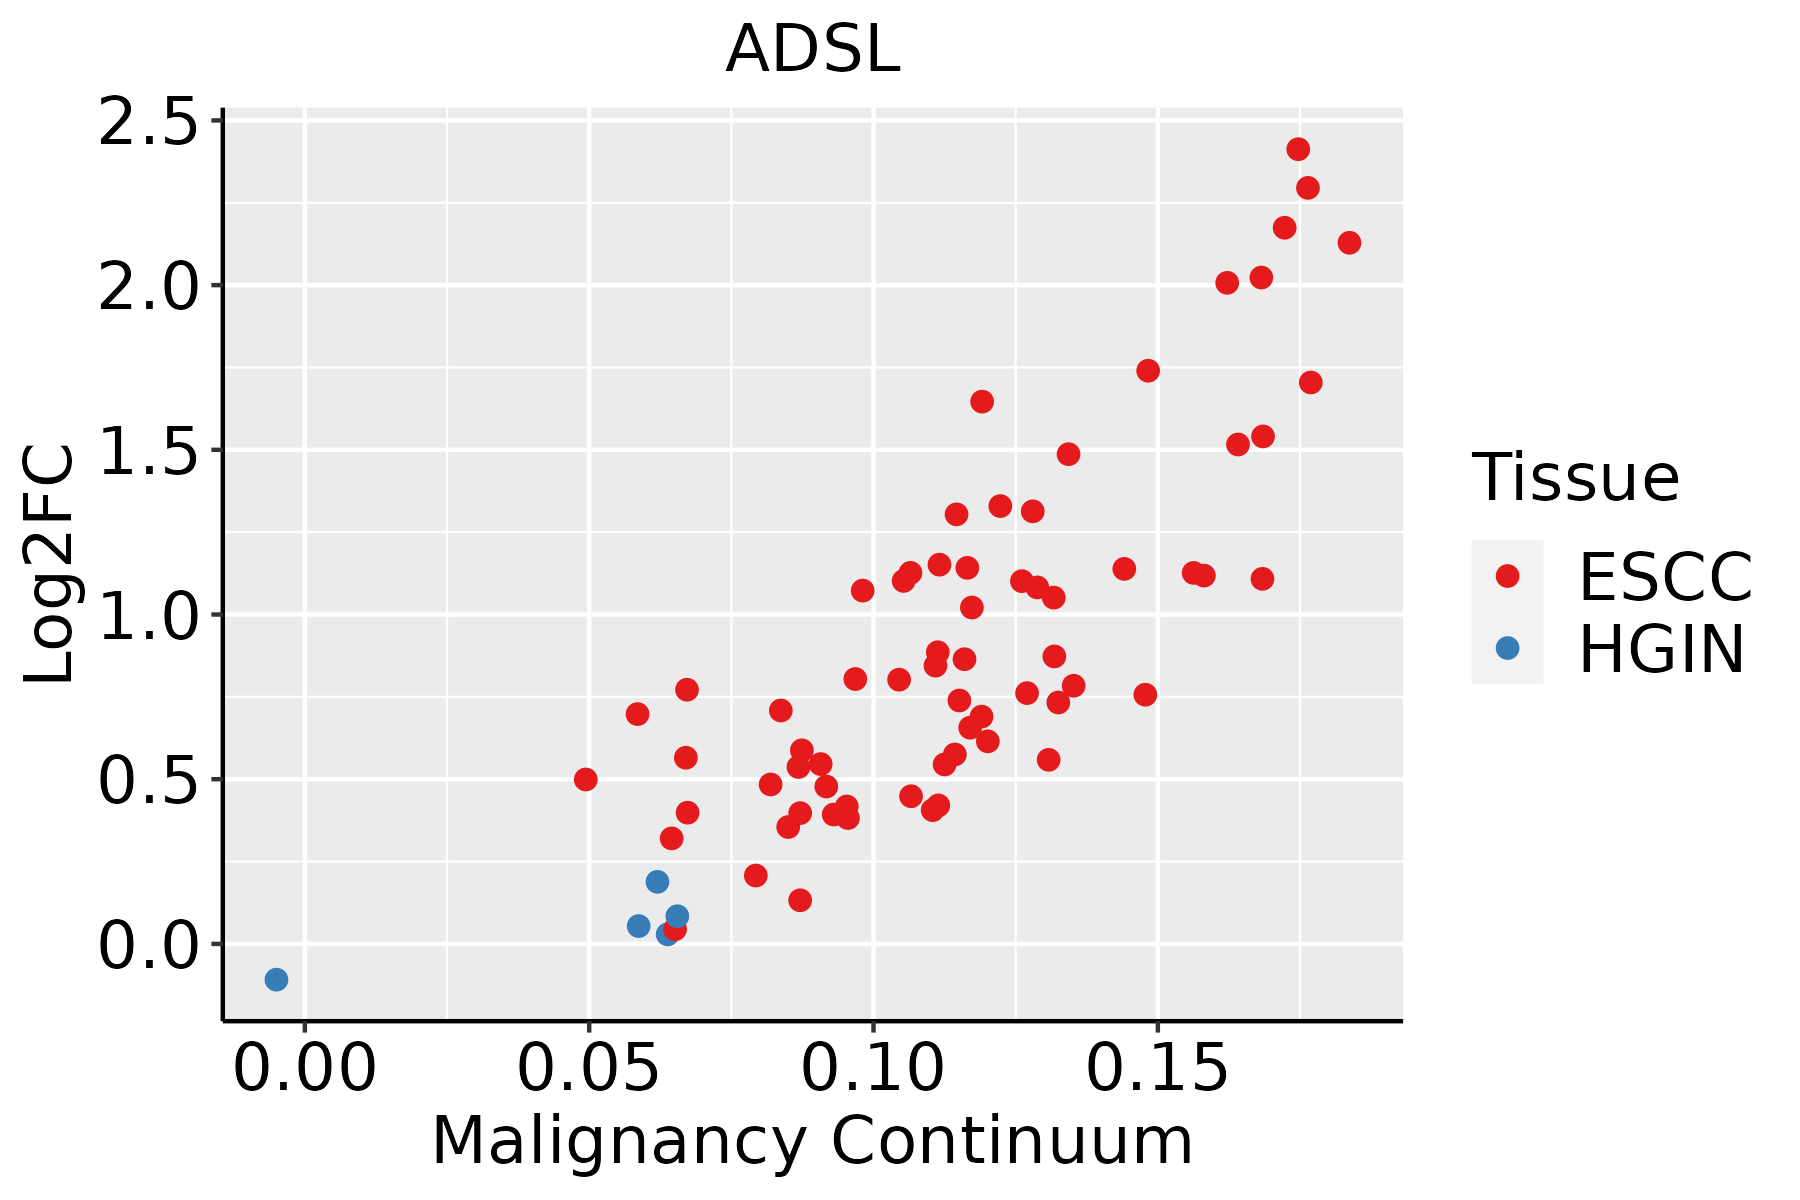 | ESCC: Esophageal squamous cell carcinoma |
| HGIN: High-grade intraepithelial neoplasias | ||
| LGIN: Low-grade intraepithelial neoplasias | ||
| Liver | 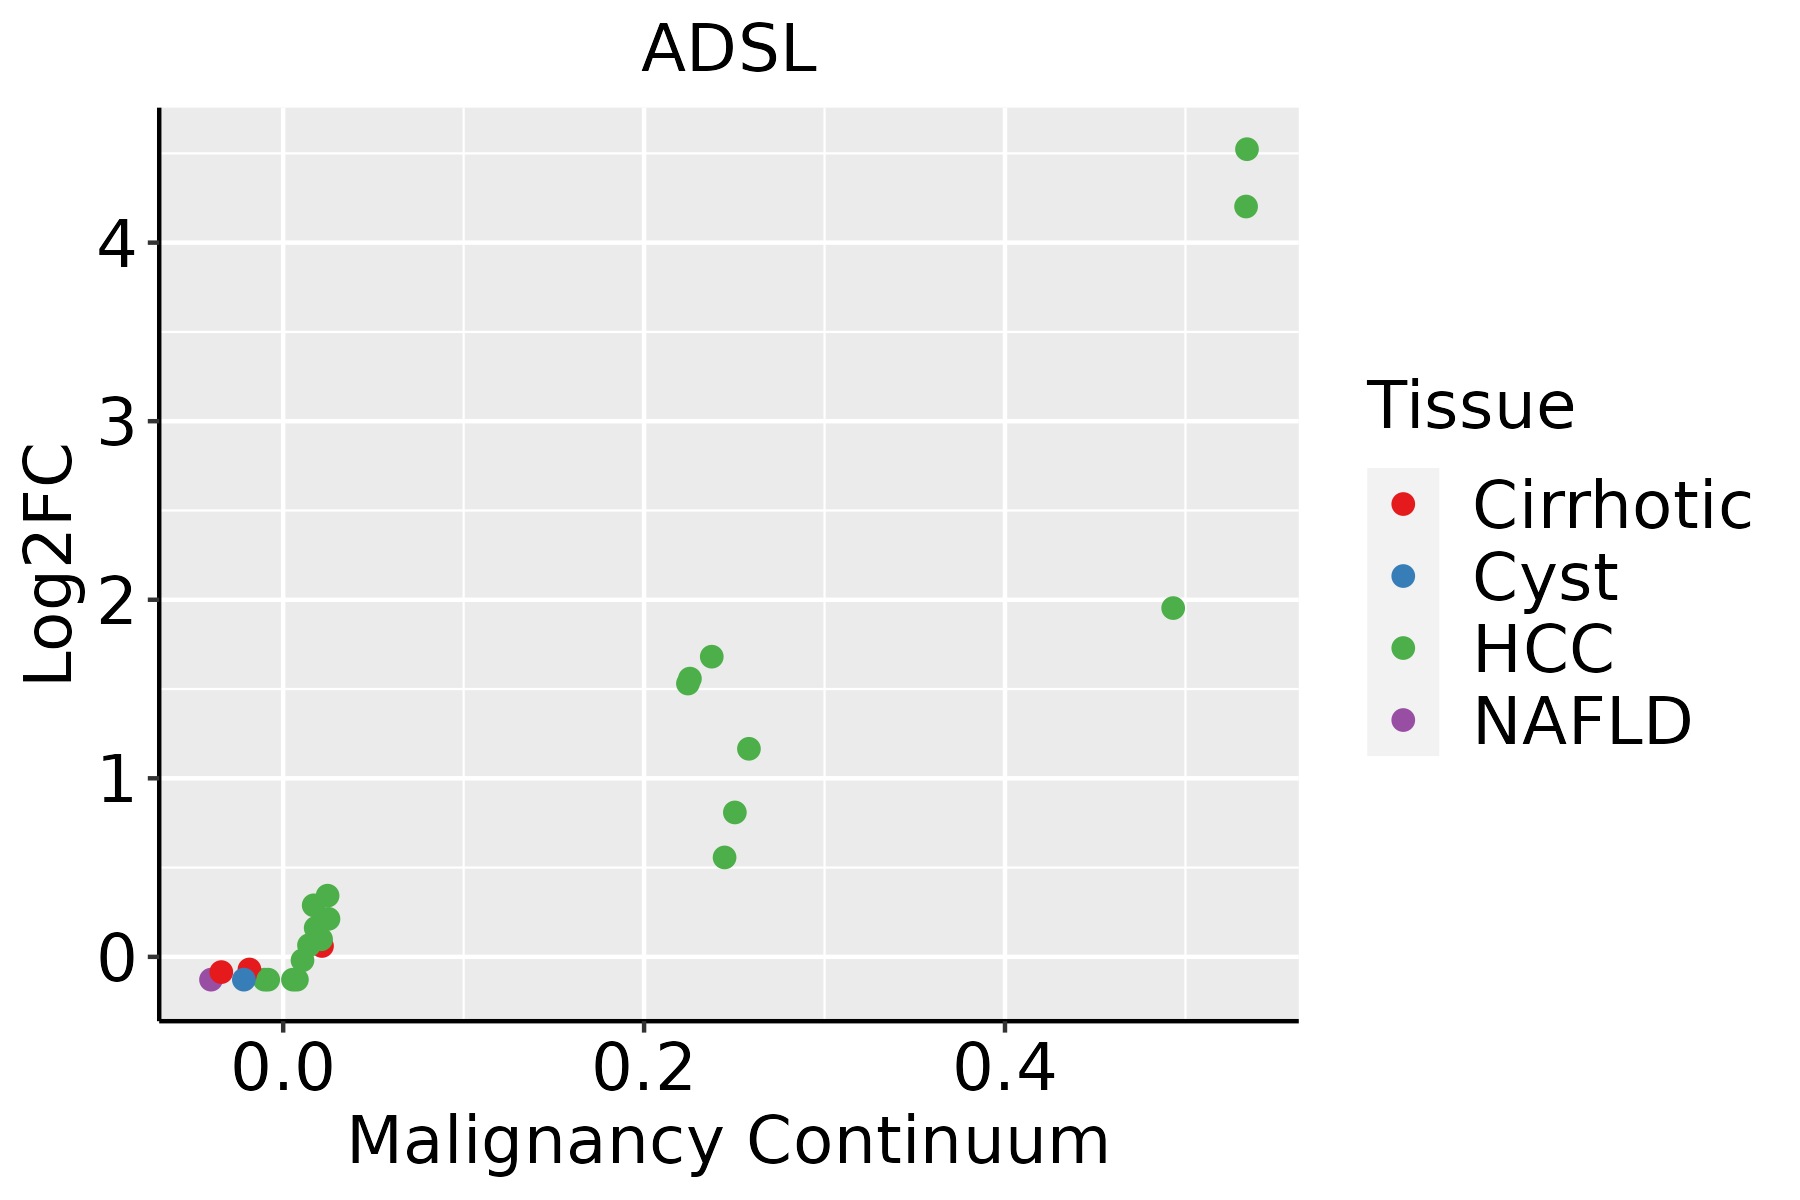 | HCC: Hepatocellular carcinoma |
| NAFLD: Non-alcoholic fatty liver disease | ||
| Oral Cavity |  | EOLP: Erosive Oral lichen planus |
| LP: leukoplakia | ||
| NEOLP: Non-erosive oral lichen planus | ||
| OSCC: Oral squamous cell carcinoma | ||
| Skin | 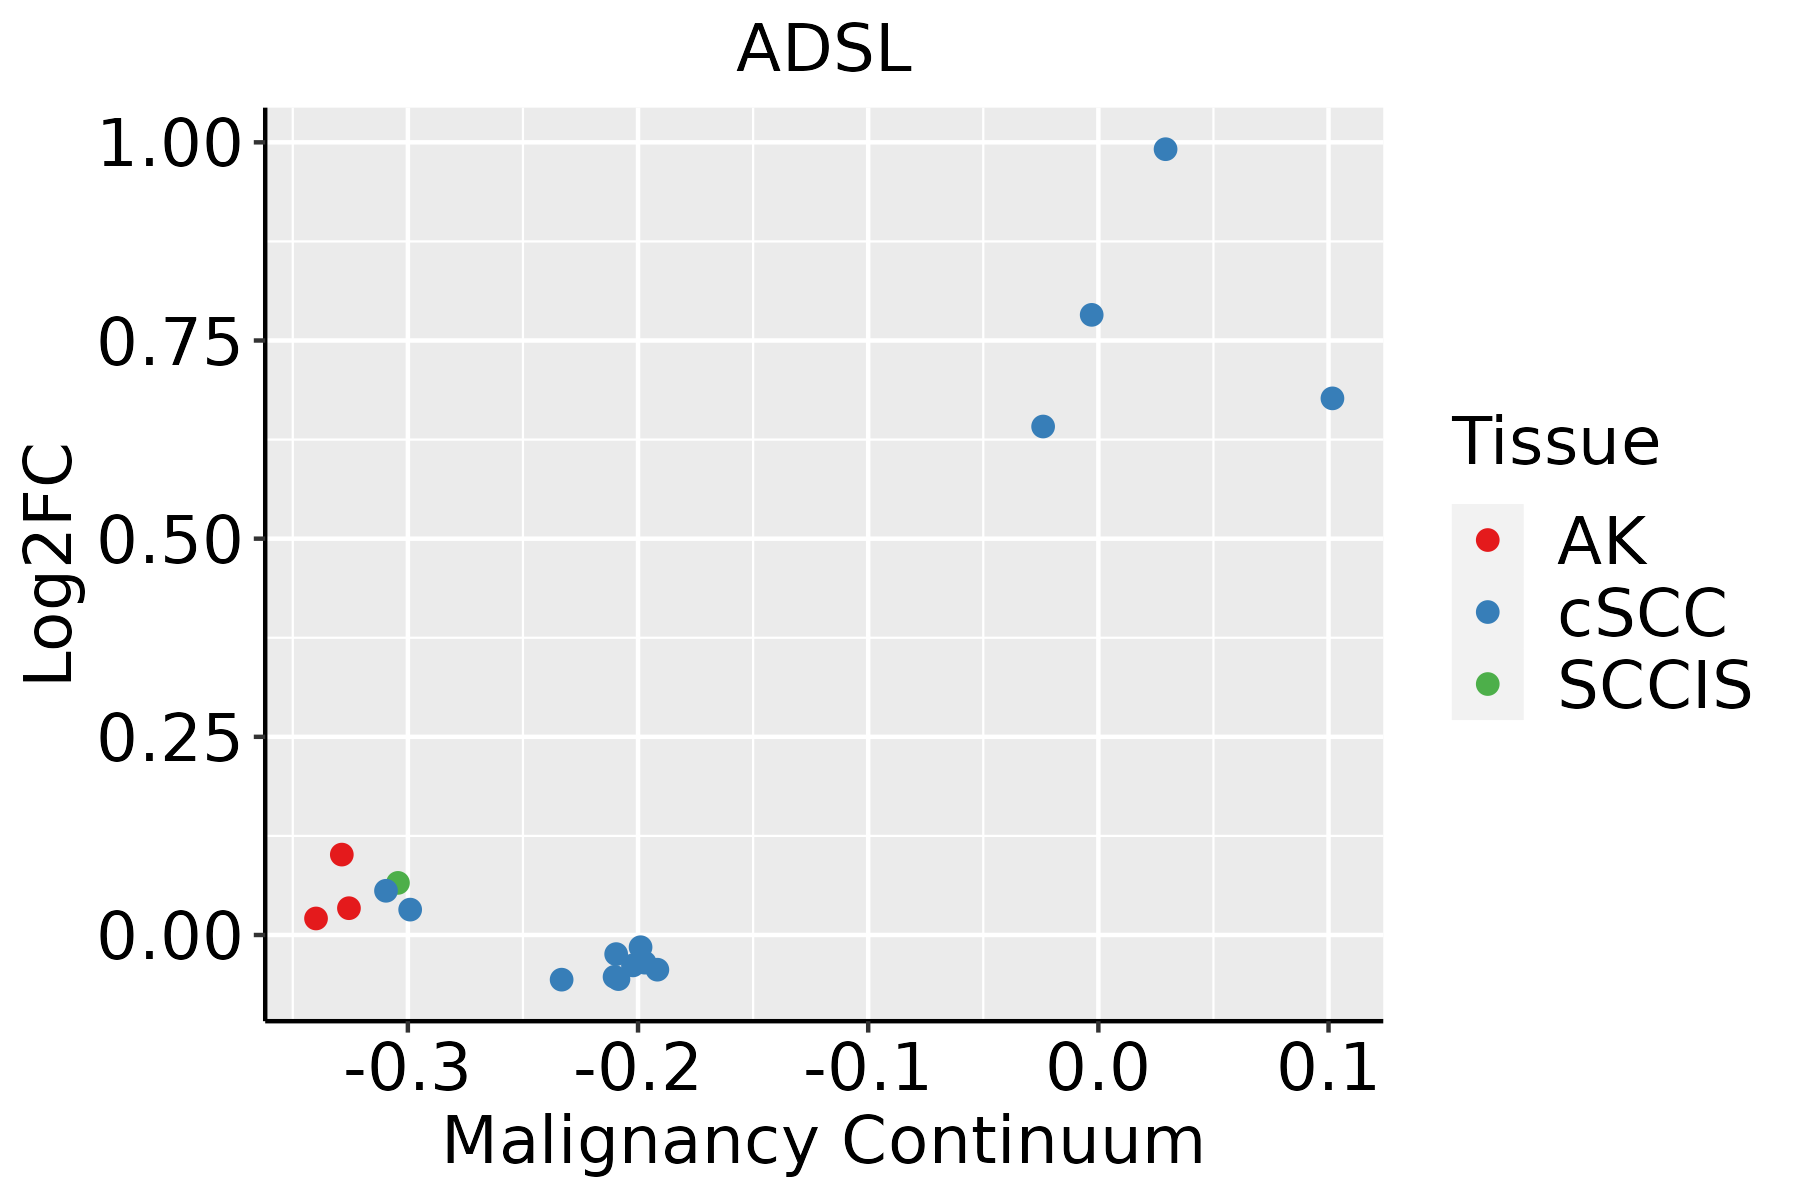 | AK: Actinic keratosis |
| cSCC: Cutaneous squamous cell carcinoma | ||
| SCCIS:squamous cell carcinoma in situ |
| ∗log2FC in expression of this searched gene in stem-like cells from each diseased tissue sample relative to stem-like cells in normal samples in each tissue plotted against the malignancy continuum. Samples are colored based on if they are from different disease stage. |
Top |
Malignant transformation related pathway analysis |
| Find out the enriched GO biological processes and KEGG pathways involved in transition from healthy to precancer to cancer |
| Tissue | Disease Stage | Enriched GO biological Processes |
| Colorectum | AD |  |
| Colorectum | SER |  |
| Colorectum | MSS |  |
| Colorectum | MSI-H |  |
| Colorectum | FAP |  |
| ∗Top 15 enriched GO BP terms are showed in the bar plot of each disease state in each tissue. Each row represents a significant GO biological process which is colored according to the -log10(p.adjust). |
| Page: 1 2 3 4 5 6 7 8 9 |
| GO ID | Tissue | Disease Stage | Description | Gene Ratio | Bg Ratio | pvalue | p.adjust | Count |
| GO:0006091 | Colorectum | AD | generation of precursor metabolites and energy | 209/3918 | 490/18723 | 3.17e-28 | 6.61e-25 | 209 |
| GO:0009060 | Colorectum | AD | aerobic respiration | 108/3918 | 189/18723 | 9.14e-28 | 1.43e-24 | 108 |
| GO:0045333 | Colorectum | AD | cellular respiration | 119/3918 | 230/18723 | 3.21e-25 | 4.02e-22 | 119 |
| GO:0015980 | Colorectum | AD | energy derivation by oxidation of organic compounds | 143/3918 | 318/18723 | 2.78e-22 | 2.49e-19 | 143 |
| GO:0009150 | Colorectum | AD | purine ribonucleotide metabolic process | 142/3918 | 368/18723 | 4.29e-15 | 1.17e-12 | 142 |
| GO:0006163 | Colorectum | AD | purine nucleotide metabolic process | 149/3918 | 396/18723 | 1.08e-14 | 2.80e-12 | 149 |
| GO:0072521 | Colorectum | AD | purine-containing compound metabolic process | 153/3918 | 416/18723 | 4.34e-14 | 1.01e-11 | 153 |
| GO:0009259 | Colorectum | AD | ribonucleotide metabolic process | 144/3918 | 385/18723 | 5.25e-14 | 1.13e-11 | 144 |
| GO:0019693 | Colorectum | AD | ribose phosphate metabolic process | 145/3918 | 396/18723 | 3.01e-13 | 5.71e-11 | 145 |
| GO:0009117 | Colorectum | AD | nucleotide metabolic process | 168/3918 | 489/18723 | 2.20e-12 | 3.36e-10 | 168 |
| GO:0006753 | Colorectum | AD | nucleoside phosphate metabolic process | 169/3918 | 497/18723 | 4.99e-12 | 6.98e-10 | 169 |
| GO:0009152 | Colorectum | AD | purine ribonucleotide biosynthetic process | 64/3918 | 169/18723 | 3.09e-07 | 1.22e-05 | 64 |
| GO:0009260 | Colorectum | AD | ribonucleotide biosynthetic process | 66/3918 | 182/18723 | 1.25e-06 | 4.02e-05 | 66 |
| GO:0046390 | Colorectum | AD | ribose phosphate biosynthetic process | 67/3918 | 190/18723 | 3.21e-06 | 9.05e-05 | 67 |
| GO:0006164 | Colorectum | AD | purine nucleotide biosynthetic process | 66/3918 | 191/18723 | 8.22e-06 | 1.97e-04 | 66 |
| GO:0072522 | Colorectum | AD | purine-containing compound biosynthetic process | 68/3918 | 200/18723 | 1.12e-05 | 2.55e-04 | 68 |
| GO:0031667 | Colorectum | AD | response to nutrient levels | 138/3918 | 474/18723 | 1.22e-05 | 2.68e-04 | 138 |
| GO:1901293 | Colorectum | AD | nucleoside phosphate biosynthetic process | 80/3918 | 256/18723 | 6.31e-05 | 1.05e-03 | 80 |
| GO:0009165 | Colorectum | AD | nucleotide biosynthetic process | 79/3918 | 254/18723 | 8.33e-05 | 1.30e-03 | 79 |
| GO:0042594 | Colorectum | AD | response to starvation | 63/3918 | 197/18723 | 1.77e-04 | 2.38e-03 | 63 |
| Page: 1 2 3 4 5 6 7 8 9 10 11 12 13 14 |
| Pathway ID | Tissue | Disease Stage | Description | Gene Ratio | Bg Ratio | pvalue | p.adjust | qvalue | Count |
| hsa01240 | Liver | Cirrhotic | Biosynthesis of cofactors | 66/2530 | 153/8465 | 3.11e-04 | 1.99e-03 | 1.23e-03 | 66 |
| hsa01232 | Liver | Cirrhotic | Nucleotide metabolism | 39/2530 | 85/8465 | 1.27e-03 | 6.73e-03 | 4.15e-03 | 39 |
| hsa012401 | Liver | Cirrhotic | Biosynthesis of cofactors | 66/2530 | 153/8465 | 3.11e-04 | 1.99e-03 | 1.23e-03 | 66 |
| hsa012321 | Liver | Cirrhotic | Nucleotide metabolism | 39/2530 | 85/8465 | 1.27e-03 | 6.73e-03 | 4.15e-03 | 39 |
| hsa012402 | Liver | HCC | Biosynthesis of cofactors | 103/4020 | 153/8465 | 4.67e-07 | 5.05e-06 | 2.81e-06 | 103 |
| hsa012322 | Liver | HCC | Nucleotide metabolism | 59/4020 | 85/8465 | 3.30e-05 | 1.88e-04 | 1.04e-04 | 59 |
| hsa012403 | Liver | HCC | Biosynthesis of cofactors | 103/4020 | 153/8465 | 4.67e-07 | 5.05e-06 | 2.81e-06 | 103 |
| hsa012323 | Liver | HCC | Nucleotide metabolism | 59/4020 | 85/8465 | 3.30e-05 | 1.88e-04 | 1.04e-04 | 59 |
| hsa012324 | Oral cavity | OSCC | Nucleotide metabolism | 54/3704 | 85/8465 | 1.78e-04 | 5.95e-04 | 3.03e-04 | 54 |
| hsa0123211 | Oral cavity | OSCC | Nucleotide metabolism | 54/3704 | 85/8465 | 1.78e-04 | 5.95e-04 | 3.03e-04 | 54 |
| hsa0123221 | Oral cavity | LP | Nucleotide metabolism | 42/2418 | 85/8465 | 3.62e-05 | 2.36e-04 | 1.52e-04 | 42 |
| hsa0123231 | Oral cavity | LP | Nucleotide metabolism | 42/2418 | 85/8465 | 3.62e-05 | 2.36e-04 | 1.52e-04 | 42 |
| Page: 1 |
Top |
Cell-cell communication analysis |
| Identification of potential cell-cell interactions between two cell types and their ligand-receptor pairs for different disease states |
| Ligand | Receptor | LRpair | Pathway | Tissue | Disease Stage |
| Page: 1 |
Top |
Single-cell gene regulatory network inference analysis |
| Find out the significant the regulons (TFs) and the target genes of each regulon across cell types for different disease states |
| TF | Cell Type | Tissue | Disease Stage | Target Gene | RSS | Regulon Activity |
| ∗The dot plots of a searched regulon are shown for all cell subpopulations in each disease state of each tissue based on the regulon specific score inferred using pySCENIC and by calculating the average expression. |
| Page: 1 |
Top |
Somatic mutation of malignant transformation related genes |
| Annotation of somatic variants for genes involved in malignant transformation |
| Hugo Symbol | Variant Class | Variant Classification | dbSNP RS | HGVSc | HGVSp | HGVSp Short | SWISSPROT | BIOTYPE | SIFT | PolyPhen | Tumor Sample Barcode | Tissue | Histology | Sex | Age | Stage | Therapy Types | Drugs | Outcome |
| ADSL | SNV | Missense_Mutation | c.335N>A | p.Ser112Tyr | p.S112Y | P30566 | protein_coding | deleterious(0) | probably_damaging(1) | TCGA-A2-A0T0-01 | Breast | breast invasive carcinoma | Female | <65 | I/II | Chemotherapy | taxotere | SD | |
| ADSL | SNV | Missense_Mutation | c.7G>T | p.Ala3Ser | p.A3S | P30566 | protein_coding | tolerated_low_confidence(0.2) | benign(0.007) | TCGA-AC-A3OD-01 | Breast | breast invasive carcinoma | Female | >=65 | I/II | Unknown | Unknown | SD | |
| ADSL | SNV | Missense_Mutation | c.898C>T | p.Arg300Cys | p.R300C | P30566 | protein_coding | deleterious(0) | probably_damaging(1) | TCGA-AN-A0AK-01 | Breast | breast invasive carcinoma | Female | >=65 | I/II | Unknown | Unknown | SD | |
| ADSL | SNV | Missense_Mutation | c.1161G>C | p.Met387Ile | p.M387I | P30566 | protein_coding | deleterious(0.02) | benign(0.07) | TCGA-BH-A0DK-01 | Breast | breast invasive carcinoma | Female | <65 | I/II | Hormone Therapy | tamoxiphen | SD | |
| ADSL | SNV | Missense_Mutation | rs746501563 | c.802G>A | p.Asp268Asn | p.D268N | P30566 | protein_coding | deleterious(0) | probably_damaging(1) | TCGA-D8-A1J8-01 | Breast | breast invasive carcinoma | Female | >=65 | I/II | Hormone Therapy | nolvadex | SD |
| ADSL | SNV | Missense_Mutation | rs796052248 | c.1276N>T | p.Arg426Cys | p.R426C | P30566 | protein_coding | deleterious(0) | probably_damaging(0.994) | TCGA-D8-A1XQ-01 | Breast | breast invasive carcinoma | Female | >=65 | I/II | Unknown | Unknown | SD |
| ADSL | SNV | Missense_Mutation | novel | c.412G>T | p.Val138Leu | p.V138L | P30566 | protein_coding | tolerated(0.14) | benign(0.007) | TCGA-OK-A5Q2-01 | Breast | breast invasive carcinoma | Female | <65 | I/II | Unknown | Unknown | SD |
| ADSL | SNV | Missense_Mutation | novel | c.1013N>A | p.Arg338Gln | p.R338Q | P30566 | protein_coding | deleterious(0) | probably_damaging(0.994) | TCGA-2W-A8YY-01 | Cervix | cervical & endocervical cancer | Female | <65 | I/II | Chemotherapy | cisplatin | CR |
| ADSL | SNV | Missense_Mutation | rs752238667 | c.1061N>T | p.Thr354Met | p.T354M | P30566 | protein_coding | tolerated(0.18) | benign(0.368) | TCGA-AA-3821-01 | Colorectum | colon adenocarcinoma | Female | >=65 | I/II | Unknown | Unknown | SD |
| ADSL | SNV | Missense_Mutation | c.1142N>T | p.Ala381Val | p.A381V | P30566 | protein_coding | deleterious(0.01) | benign(0.121) | TCGA-AA-3930-01 | Colorectum | colon adenocarcinoma | Male | >=65 | III/IV | Chemotherapy | capecitabine | PD |
| Page: 1 2 3 4 5 6 |
Top |
Related drugs of malignant transformation related genes |
| Identification of chemicals and drugs interact with genes involved in malignant transfromation |
| (DGIdb 4.0) |
| Entrez ID | Symbol | Category | Interaction Types | Drug Claim Name | Drug Name | PMIDs |
| Page: 1 |

Copyright 2023-Present -The University of Texas Health Science Center at Houston |