
|
|||||
|
 | |
| |
| |
| |
| |
| |
|
Gene: ADORA2B |
Gene summary for ADORA2B |
| Gene information | Species | Human | Gene symbol | ADORA2B | Gene ID | 136 |
| Gene name | adenosine A2b receptor | |
| Gene Alias | ADORA2 | |
| Cytomap | 17p12 | |
| Gene Type | protein-coding | GO ID | GO:0000165 | UniProtAcc | P29275 |
Top |
Malignant transformation analysis |
| Identification of the aberrant gene expression in precancerous and cancerous lesions by comparing the gene expression of stem-like cells in diseased tissues with normal stem cells |
| Entrez ID | Symbol | Replicates | Species | Organ | Tissue | Adj P-value | Log2FC | Malignancy |
| 136 | ADORA2B | LZE4T | Human | Esophagus | ESCC | 2.82e-13 | 3.09e-01 | 0.0811 |
| 136 | ADORA2B | LZE8T | Human | Esophagus | ESCC | 6.25e-05 | 1.52e-01 | 0.067 |
| 136 | ADORA2B | LZE20T | Human | Esophagus | ESCC | 2.57e-03 | -2.27e-02 | 0.0662 |
| 136 | ADORA2B | LZE24T | Human | Esophagus | ESCC | 4.60e-05 | 3.08e-01 | 0.0596 |
| 136 | ADORA2B | P2T-E | Human | Esophagus | ESCC | 2.70e-17 | 3.78e-01 | 0.1177 |
| 136 | ADORA2B | P4T-E | Human | Esophagus | ESCC | 1.74e-31 | 9.71e-01 | 0.1323 |
| 136 | ADORA2B | P5T-E | Human | Esophagus | ESCC | 5.84e-09 | 1.05e-01 | 0.1327 |
| 136 | ADORA2B | P8T-E | Human | Esophagus | ESCC | 2.70e-21 | 6.32e-01 | 0.0889 |
| 136 | ADORA2B | P9T-E | Human | Esophagus | ESCC | 6.63e-07 | 1.79e-01 | 0.1131 |
| 136 | ADORA2B | P10T-E | Human | Esophagus | ESCC | 4.76e-03 | 8.14e-03 | 0.116 |
| 136 | ADORA2B | P11T-E | Human | Esophagus | ESCC | 2.85e-05 | 1.43e-01 | 0.1426 |
| 136 | ADORA2B | P12T-E | Human | Esophagus | ESCC | 1.13e-21 | 5.41e-01 | 0.1122 |
| 136 | ADORA2B | P15T-E | Human | Esophagus | ESCC | 2.55e-19 | 2.50e-01 | 0.1149 |
| 136 | ADORA2B | P16T-E | Human | Esophagus | ESCC | 7.97e-14 | 2.73e-01 | 0.1153 |
| 136 | ADORA2B | P20T-E | Human | Esophagus | ESCC | 5.51e-23 | 6.04e-01 | 0.1124 |
| 136 | ADORA2B | P21T-E | Human | Esophagus | ESCC | 6.43e-24 | 6.89e-01 | 0.1617 |
| 136 | ADORA2B | P22T-E | Human | Esophagus | ESCC | 2.55e-26 | 5.76e-01 | 0.1236 |
| 136 | ADORA2B | P23T-E | Human | Esophagus | ESCC | 2.68e-07 | 4.87e-01 | 0.108 |
| 136 | ADORA2B | P24T-E | Human | Esophagus | ESCC | 5.44e-18 | 7.01e-01 | 0.1287 |
| 136 | ADORA2B | P26T-E | Human | Esophagus | ESCC | 2.25e-14 | 1.95e-01 | 0.1276 |
| Page: 1 2 3 4 |
| Tissue | Expression Dynamics | Abbreviation |
| Esophagus | 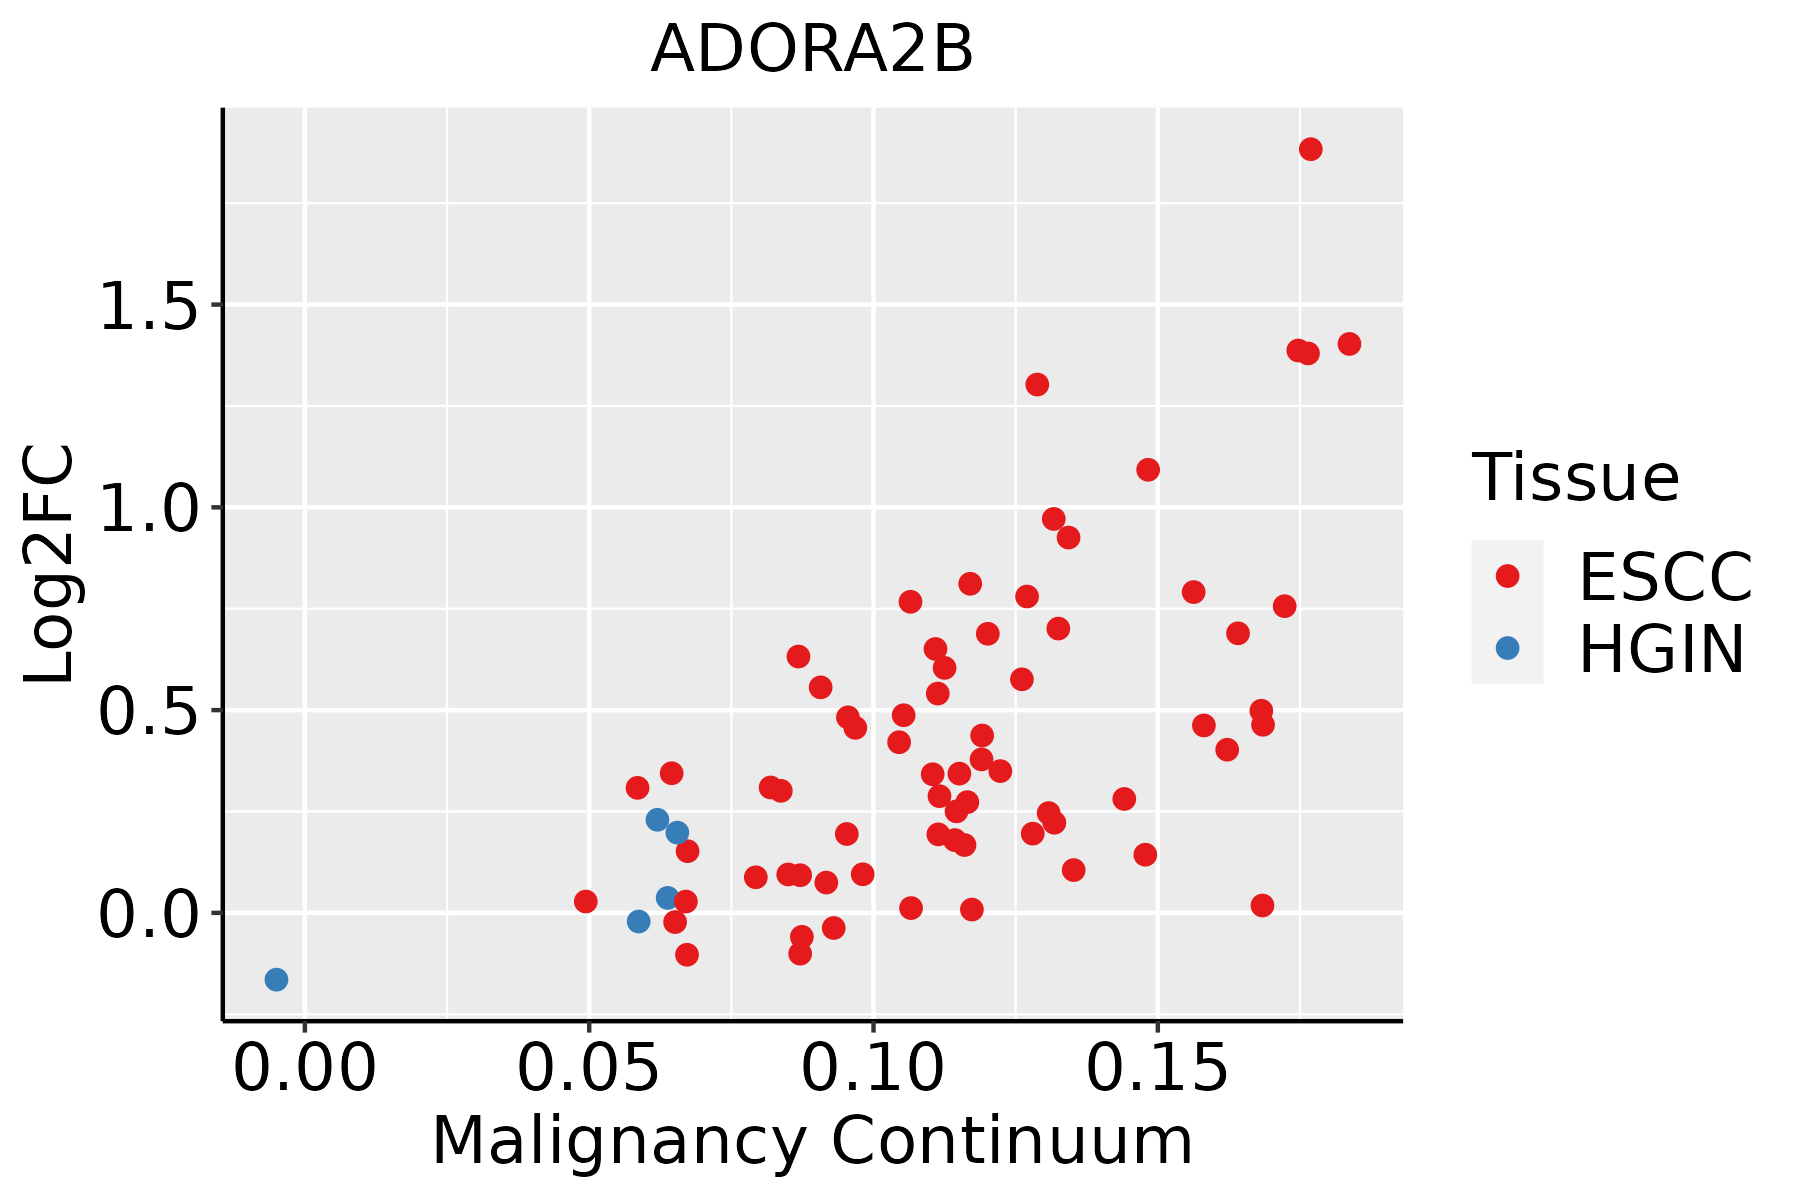 | ESCC: Esophageal squamous cell carcinoma |
| HGIN: High-grade intraepithelial neoplasias | ||
| LGIN: Low-grade intraepithelial neoplasias | ||
| Oral Cavity | 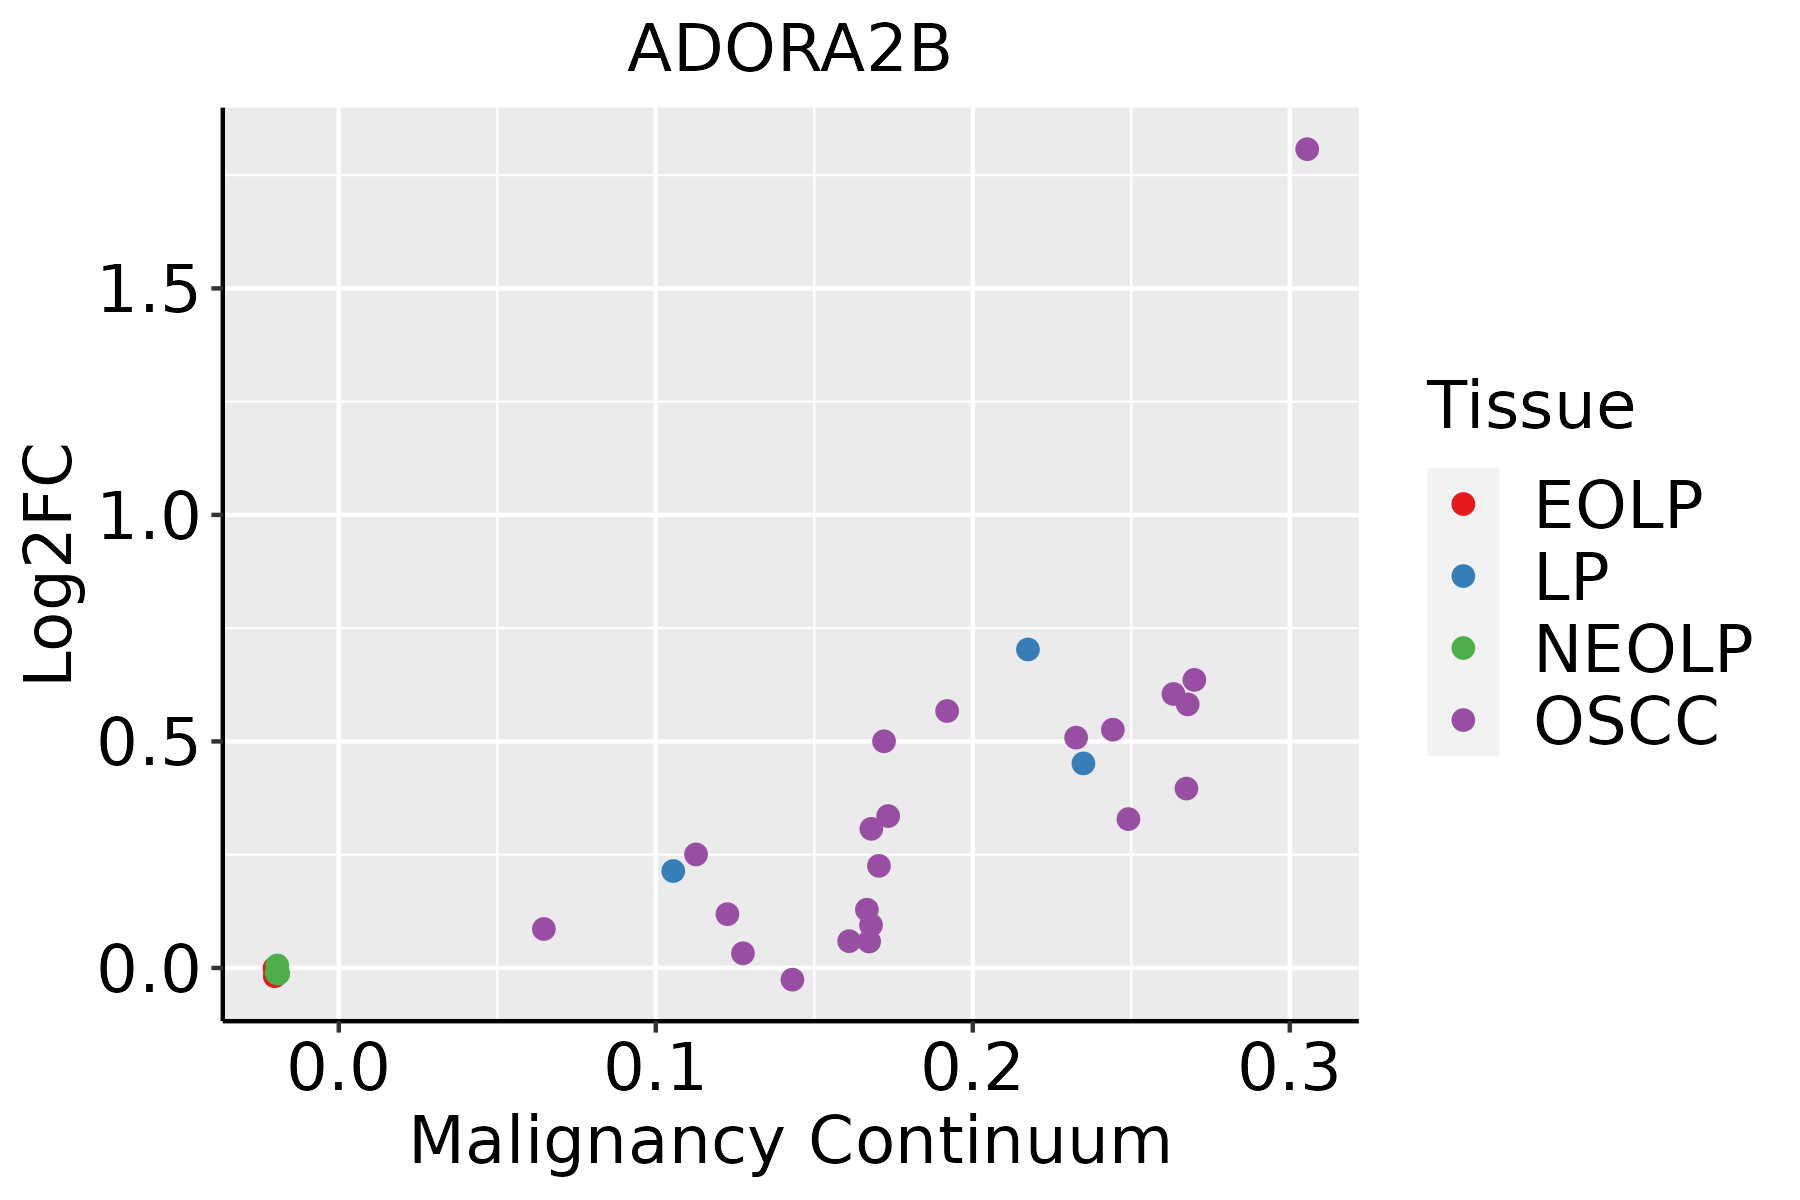 | EOLP: Erosive Oral lichen planus |
| LP: leukoplakia | ||
| NEOLP: Non-erosive oral lichen planus | ||
| OSCC: Oral squamous cell carcinoma | ||
| Skin | 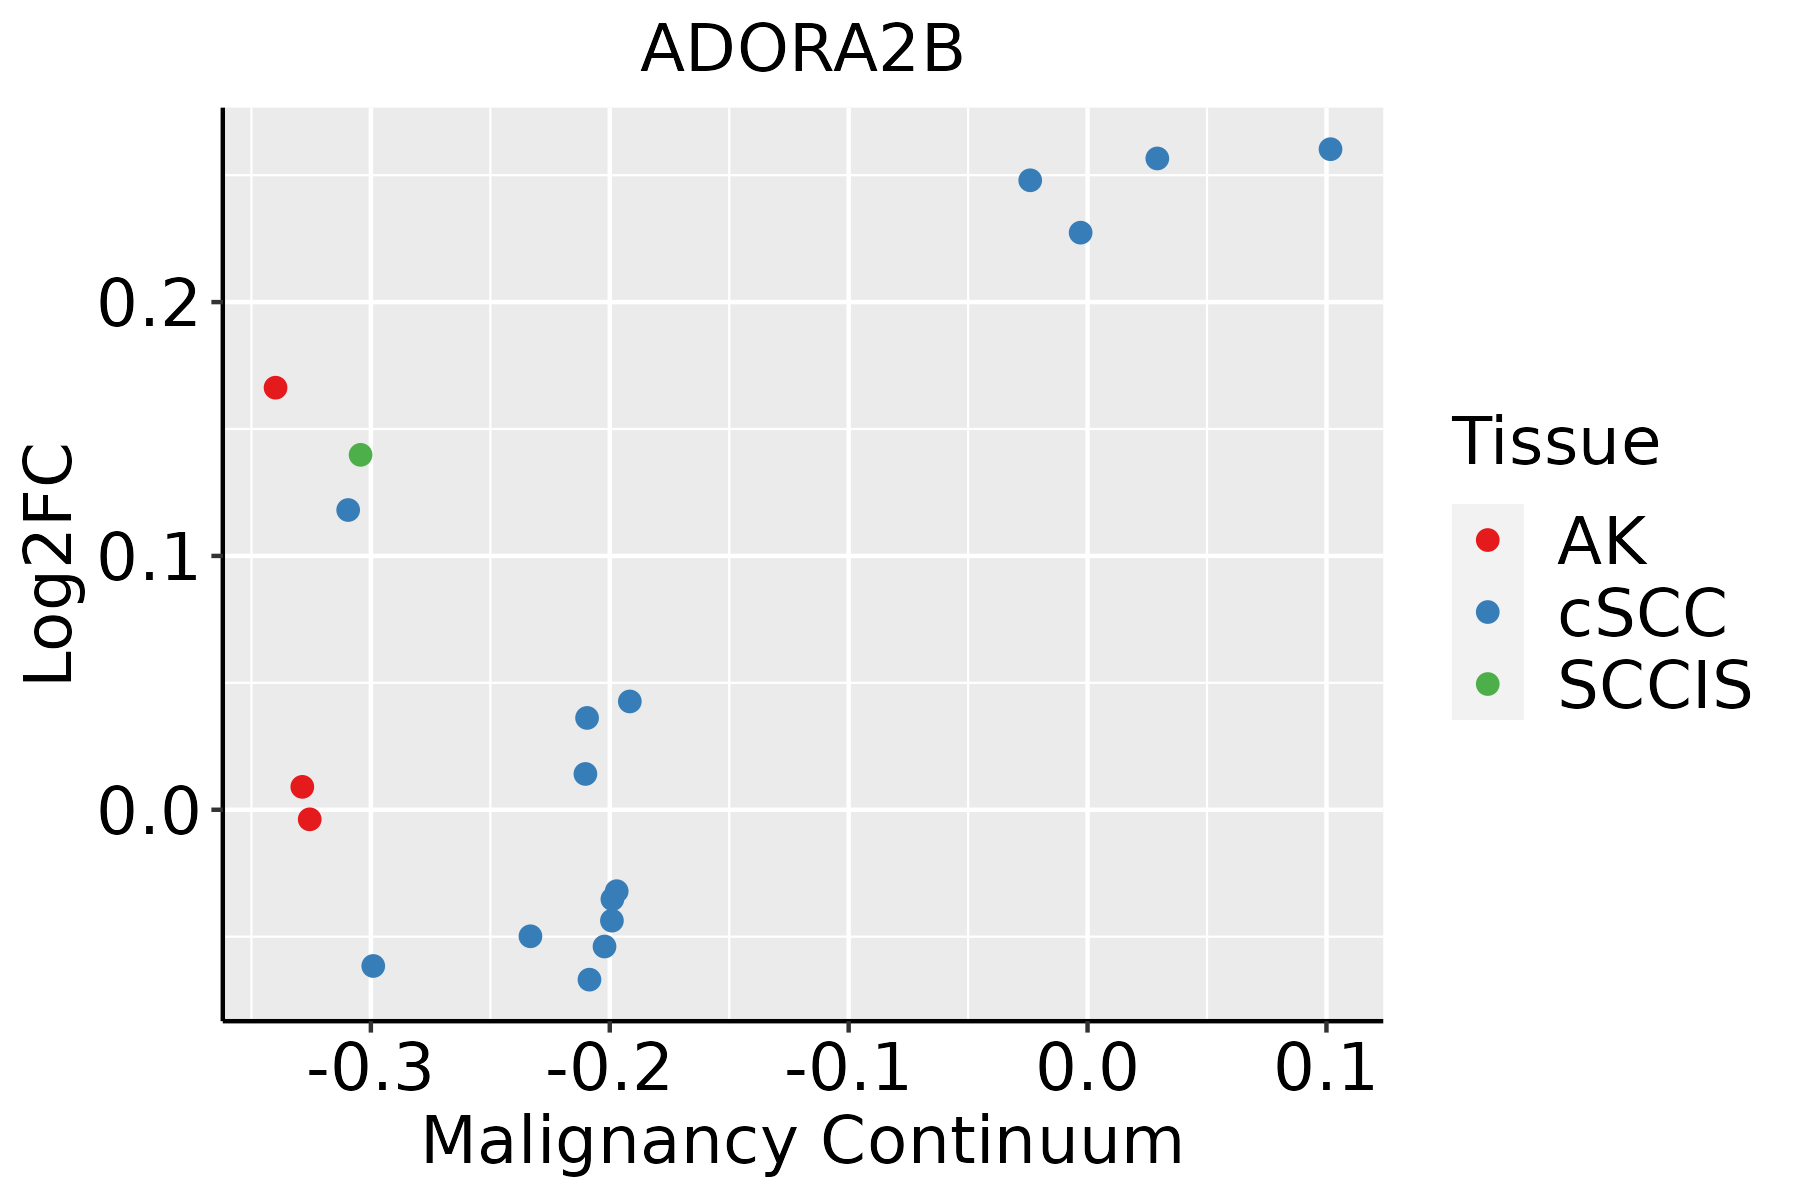 | AK: Actinic keratosis |
| cSCC: Cutaneous squamous cell carcinoma | ||
| SCCIS:squamous cell carcinoma in situ |
| ∗log2FC in expression of this searched gene in stem-like cells from each diseased tissue sample relative to stem-like cells in normal samples in each tissue plotted against the malignancy continuum. Samples are colored based on if they are from different disease stage. |
Top |
Malignant transformation related pathway analysis |
| Find out the enriched GO biological processes and KEGG pathways involved in transition from healthy to precancer to cancer |
| Tissue | Disease Stage | Enriched GO biological Processes |
| Colorectum | AD |  |
| Colorectum | SER |  |
| Colorectum | MSS |  |
| Colorectum | MSI-H |  |
| Colorectum | FAP |  |
| ∗Top 15 enriched GO BP terms are showed in the bar plot of each disease state in each tissue. Each row represents a significant GO biological process which is colored according to the -log10(p.adjust). |
| Page: 1 2 3 4 5 6 7 8 9 |
| GO ID | Tissue | Disease Stage | Description | Gene Ratio | Bg Ratio | pvalue | p.adjust | Count |
| GO:003109818 | Esophagus | ESCC | stress-activated protein kinase signaling cascade | 154/8552 | 247/18723 | 8.53e-08 | 1.44e-06 | 154 |
| GO:005140318 | Esophagus | ESCC | stress-activated MAPK cascade | 147/8552 | 239/18723 | 5.43e-07 | 7.18e-06 | 147 |
| GO:00072549 | Esophagus | ESCC | JNK cascade | 102/8552 | 167/18723 | 4.22e-05 | 3.39e-04 | 102 |
| GO:003109816 | Oral cavity | OSCC | stress-activated protein kinase signaling cascade | 141/7305 | 247/18723 | 5.74e-09 | 1.25e-07 | 141 |
| GO:005140316 | Oral cavity | OSCC | stress-activated MAPK cascade | 134/7305 | 239/18723 | 6.02e-08 | 1.09e-06 | 134 |
| GO:00072548 | Oral cavity | OSCC | JNK cascade | 90/7305 | 167/18723 | 6.49e-05 | 5.26e-04 | 90 |
| GO:003109817 | Oral cavity | LP | stress-activated protein kinase signaling cascade | 88/4623 | 247/18723 | 7.39e-05 | 9.68e-04 | 88 |
| GO:005140317 | Oral cavity | LP | stress-activated MAPK cascade | 84/4623 | 239/18723 | 1.79e-04 | 2.00e-03 | 84 |
| GO:003109825 | Skin | cSCC | stress-activated protein kinase signaling cascade | 92/4864 | 247/18723 | 5.78e-05 | 5.74e-04 | 92 |
| GO:005140325 | Skin | cSCC | stress-activated MAPK cascade | 88/4864 | 239/18723 | 1.32e-04 | 1.20e-03 | 88 |
| GO:000725423 | Skin | cSCC | JNK cascade | 60/4864 | 167/18723 | 2.77e-03 | 1.56e-02 | 60 |
| Page: 1 |
| Pathway ID | Tissue | Disease Stage | Description | Gene Ratio | Bg Ratio | pvalue | p.adjust | qvalue | Count |
| hsa0401518 | Oral cavity | OSCC | Rap1 signaling pathway | 107/3704 | 210/8465 | 2.01e-02 | 4.34e-02 | 2.21e-02 | 107 |
| hsa0401519 | Oral cavity | OSCC | Rap1 signaling pathway | 107/3704 | 210/8465 | 2.01e-02 | 4.34e-02 | 2.21e-02 | 107 |
| Page: 1 |
Top |
Cell-cell communication analysis |
| Identification of potential cell-cell interactions between two cell types and their ligand-receptor pairs for different disease states |
| Ligand | Receptor | LRpair | Pathway | Tissue | Disease Stage |
| ENTPD1 | ADORA2B | ENTPD1_ADORA2B | CD39 | Cervix | CC |
| ENTPD1 | ADORA2B | ENTPD1_ADORA2B | CD39 | Esophagus | ESCC |
| ENTPD1 | ADORA2B | ENTPD1_ADORA2B | CD39 | HNSCC | ADJ |
| ENTPD1 | ADORA2B | ENTPD1_ADORA2B | CD39 | HNSCC | OSCC |
| ENTPD1 | ADORA2B | ENTPD1_ADORA2B | CD39 | HNSCC | Precancer |
| ENTPD1 | ADORA2B | ENTPD1_ADORA2B | CD39 | Lung | AAH |
| ENTPD1 | ADORA2B | ENTPD1_ADORA2B | CD39 | Prostate | BPH |
| Page: 1 |
Top |
Single-cell gene regulatory network inference analysis |
| Find out the significant the regulons (TFs) and the target genes of each regulon across cell types for different disease states |
| TF | Cell Type | Tissue | Disease Stage | Target Gene | RSS | Regulon Activity |
| ∗The dot plots of a searched regulon are shown for all cell subpopulations in each disease state of each tissue based on the regulon specific score inferred using pySCENIC and by calculating the average expression. |
| Page: 1 |
Top |
Somatic mutation of malignant transformation related genes |
| Annotation of somatic variants for genes involved in malignant transformation |
| Hugo Symbol | Variant Class | Variant Classification | dbSNP RS | HGVSc | HGVSp | HGVSp Short | SWISSPROT | BIOTYPE | SIFT | PolyPhen | Tumor Sample Barcode | Tissue | Histology | Sex | Age | Stage | Therapy Types | Drugs | Outcome |
| ADORA2B | SNV | Missense_Mutation | novel | c.898N>T | p.Thr300Ser | p.T300S | P29275 | protein_coding | deleterious(0.02) | benign(0.076) | TCGA-AY-4070-01 | Colorectum | colon adenocarcinoma | Female | <65 | III/IV | Chemotherapy | 5-fu | PD |
| ADORA2B | SNV | Missense_Mutation | c.500N>A | p.Cys167Tyr | p.C167Y | P29275 | protein_coding | tolerated(1) | probably_damaging(0.938) | TCGA-G4-6628-01 | Colorectum | colon adenocarcinoma | Male | >=65 | I/II | Unknown | Unknown | SD | |
| ADORA2B | SNV | Missense_Mutation | novel | c.776N>C | p.Phe259Ser | p.F259S | P29275 | protein_coding | deleterious(0) | probably_damaging(0.984) | TCGA-G4-6628-01 | Colorectum | colon adenocarcinoma | Male | >=65 | I/II | Unknown | Unknown | SD |
| ADORA2B | SNV | Missense_Mutation | rs767274320 | c.225N>A | p.Phe75Leu | p.F75L | P29275 | protein_coding | deleterious(0.01) | benign(0.381) | TCGA-A5-A2K5-01 | Endometrium | uterine corpus endometrioid carcinoma | Female | >=65 | I/II | Unknown | Unknown | SD |
| ADORA2B | SNV | Missense_Mutation | rs768369462 | c.98N>A | p.Gly33Asp | p.G33D | P29275 | protein_coding | tolerated(0.2) | possibly_damaging(0.808) | TCGA-AX-A1C4-01 | Endometrium | uterine corpus endometrioid carcinoma | Female | <65 | I/II | Unknown | Unknown | SD |
| ADORA2B | SNV | Missense_Mutation | c.443A>G | p.Asp148Gly | p.D148G | P29275 | protein_coding | tolerated(0.4) | benign(0.005) | TCGA-B5-A0JY-01 | Endometrium | uterine corpus endometrioid carcinoma | Female | <65 | III/IV | Chemotherapy | doxorubicin | SD | |
| ADORA2B | SNV | Missense_Mutation | novel | c.178N>A | p.Ala60Thr | p.A60T | P29275 | protein_coding | deleterious(0.03) | probably_damaging(0.926) | TCGA-DF-A2KU-01 | Endometrium | uterine corpus endometrioid carcinoma | Female | Unknown | I/II | Unknown | Unknown | SD |
| ADORA2B | SNV | Missense_Mutation | novel | c.308N>T | p.Arg103Ile | p.R103I | P29275 | protein_coding | deleterious(0) | probably_damaging(0.991) | TCGA-DF-A2KU-01 | Endometrium | uterine corpus endometrioid carcinoma | Female | Unknown | I/II | Unknown | Unknown | SD |
| ADORA2B | SNV | Missense_Mutation | c.982N>A | p.Leu328Ile | p.L328I | P29275 | protein_coding | tolerated(0.2) | benign(0.017) | TCGA-EO-A22R-01 | Endometrium | uterine corpus endometrioid carcinoma | Female | <65 | I/II | Unknown | Unknown | SD | |
| ADORA2B | SNV | Missense_Mutation | rs776840698 | c.590T>C | p.Ile197Thr | p.I197T | P29275 | protein_coding | deleterious(0.01) | benign(0.42) | TCGA-EY-A2OM-01 | Endometrium | uterine corpus endometrioid carcinoma | Female | <65 | I/II | Chemotherapy | taxol | SD |
| Page: 1 2 |
Top |
Related drugs of malignant transformation related genes |
| Identification of chemicals and drugs interact with genes involved in malignant transfromation |
| (DGIdb 4.0) |
| Entrez ID | Symbol | Category | Interaction Types | Drug Claim Name | Drug Name | PMIDs |
| 136 | ADORA2B | DRUGGABLE GENOME, G PROTEIN COUPLED RECEPTOR | antagonist | 135651364 | ZM-241385 | |
| 136 | ADORA2B | DRUGGABLE GENOME, G PROTEIN COUPLED RECEPTOR | THEOPHYLLINE | THEOPHYLLINE | ||
| 136 | ADORA2B | DRUGGABLE GENOME, G PROTEIN COUPLED RECEPTOR | antagonist | 135652675 | CAFFEINE | |
| 136 | ADORA2B | DRUGGABLE GENOME, G PROTEIN COUPLED RECEPTOR | antagonist | 178102238 | ROLOFYLLINE | |
| 136 | ADORA2B | DRUGGABLE GENOME, G PROTEIN COUPLED RECEPTOR | Vidarabine | VIDARABINE | ||
| 136 | ADORA2B | DRUGGABLE GENOME, G PROTEIN COUPLED RECEPTOR | antagonist | 178102239 | TONAPOFYLLINE | |
| 136 | ADORA2B | DRUGGABLE GENOME, G PROTEIN COUPLED RECEPTOR | antagonist | CHEMBL260933 | GS 6201 | |
| 136 | ADORA2B | DRUGGABLE GENOME, G PROTEIN COUPLED RECEPTOR | antagonist | 135651150 | ||
| 136 | ADORA2B | DRUGGABLE GENOME, G PROTEIN COUPLED RECEPTOR | antagonist | CHEMBL190 | THEOPHYLLINE | |
| 136 | ADORA2B | DRUGGABLE GENOME, G PROTEIN COUPLED RECEPTOR | antagonist | CHEMBL113 | CAFFEINE |
| Page: 1 2 3 4 5 6 7 8 9 10 11 12 |

Copyright 2023-Present -The University of Texas Health Science Center at Houston |