
|
|||||
|
 | |
| |
| |
| |
| |
| |
|
Gene: ADO |
Gene summary for ADO |
| Gene information | Species | Human | Gene symbol | ADO | Gene ID | 84890 |
| Gene name | 2-aminoethanethiol dioxygenase | |
| Gene Alias | C10orf22 | |
| Cytomap | 10q21.3 | |
| Gene Type | protein-coding | GO ID | GO:0005575 | UniProtAcc | B3KXN9 |
Top |
Malignant transformation analysis |
| Identification of the aberrant gene expression in precancerous and cancerous lesions by comparing the gene expression of stem-like cells in diseased tissues with normal stem cells |
| Entrez ID | Symbol | Replicates | Species | Organ | Tissue | Adj P-value | Log2FC | Malignancy |
| 84890 | ADO | C04 | Human | Oral cavity | OSCC | 4.11e-03 | 2.53e-01 | 0.2633 |
| 84890 | ADO | C21 | Human | Oral cavity | OSCC | 1.82e-02 | 1.57e-01 | 0.2678 |
| 84890 | ADO | C30 | Human | Oral cavity | OSCC | 8.11e-09 | 5.84e-01 | 0.3055 |
| 84890 | ADO | C38 | Human | Oral cavity | OSCC | 1.70e-08 | 4.36e-01 | 0.172 |
| 84890 | ADO | C46 | Human | Oral cavity | OSCC | 1.46e-02 | 1.09e-01 | 0.1673 |
| 84890 | ADO | C06 | Human | Oral cavity | OSCC | 4.91e-05 | 5.57e-01 | 0.2699 |
| 84890 | ADO | C08 | Human | Oral cavity | OSCC | 7.93e-15 | 3.73e-01 | 0.1919 |
| 84890 | ADO | LN46 | Human | Oral cavity | OSCC | 7.83e-03 | 1.70e-01 | 0.1666 |
| 84890 | ADO | SYSMH2 | Human | Oral cavity | OSCC | 6.72e-05 | 1.62e-01 | 0.2326 |
| 84890 | ADO | SYSMH3 | Human | Oral cavity | OSCC | 4.40e-06 | 2.38e-01 | 0.2442 |
| Page: 1 |
| Tissue | Expression Dynamics | Abbreviation |
| Oral Cavity | 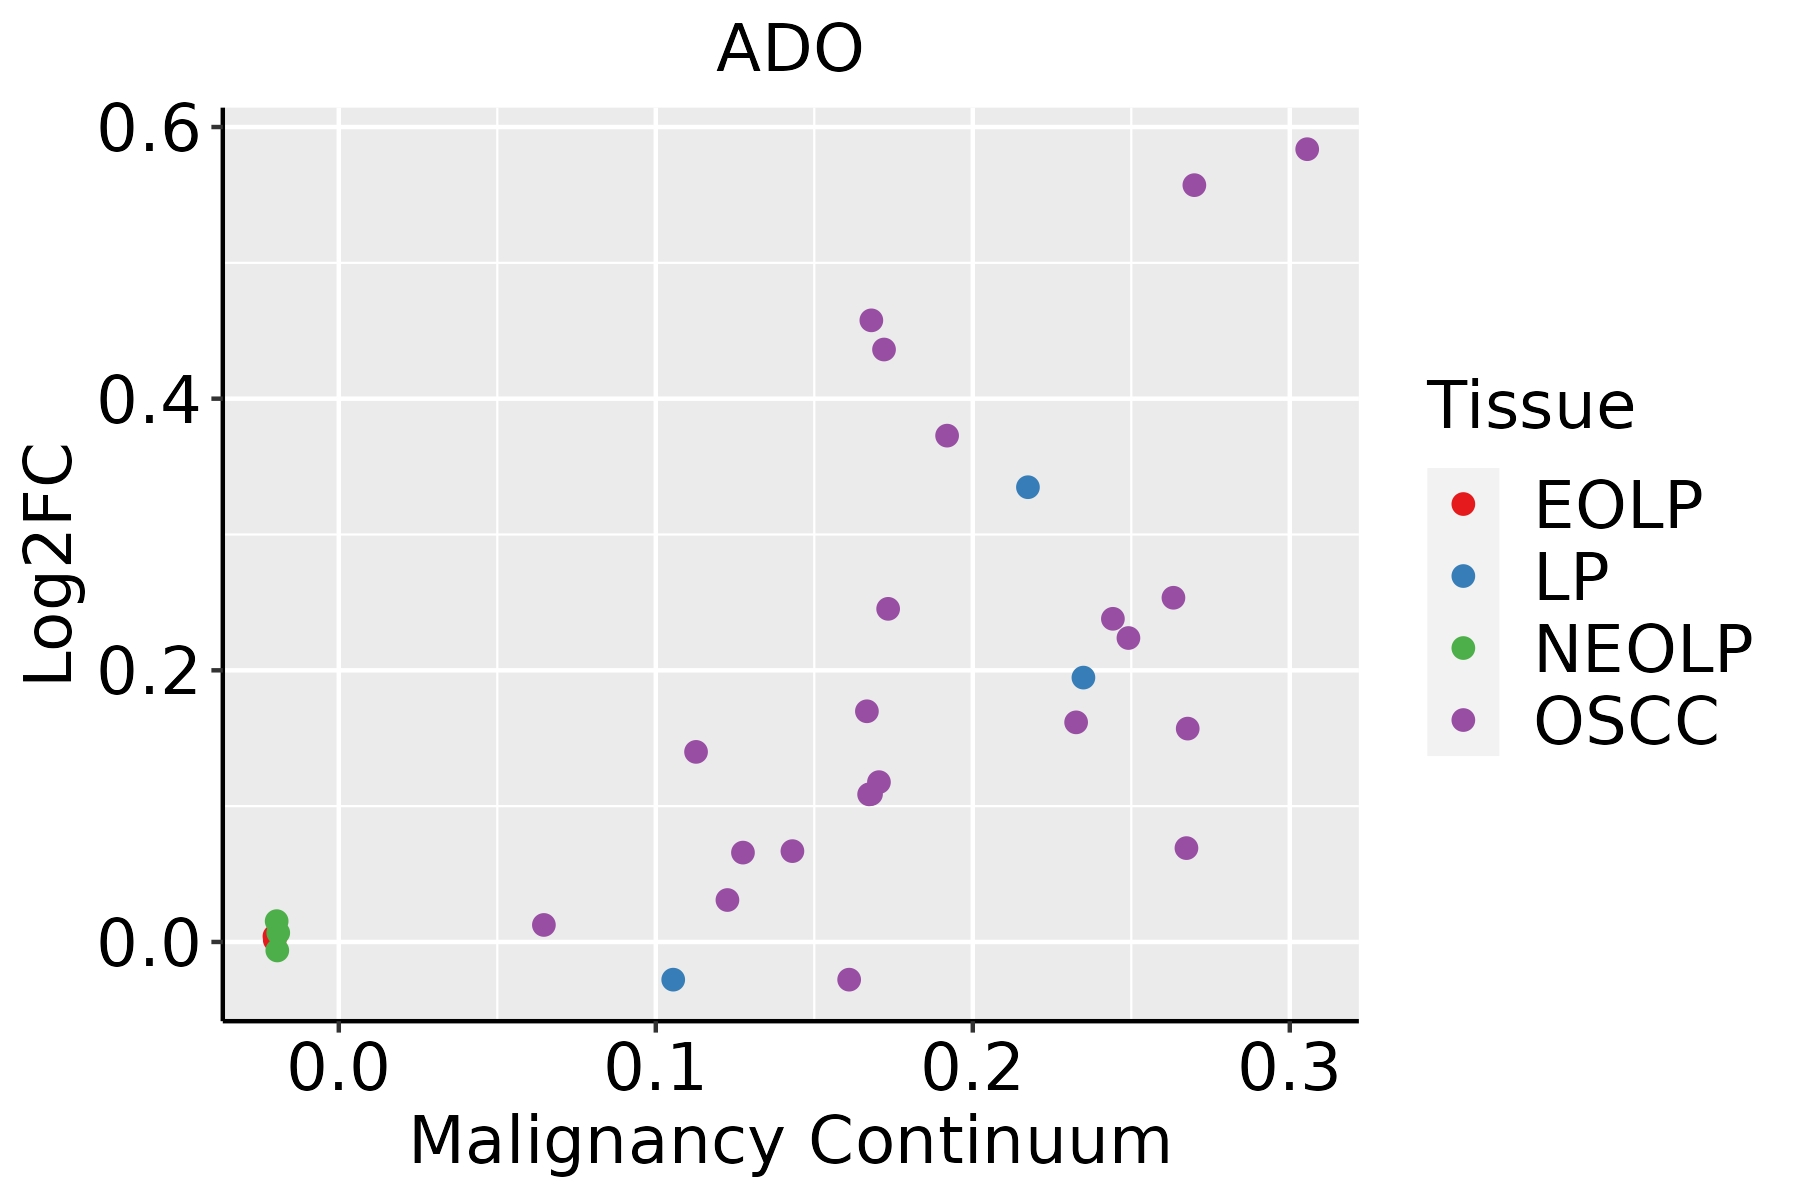 | EOLP: Erosive Oral lichen planus |
| LP: leukoplakia | ||
| NEOLP: Non-erosive oral lichen planus | ||
| OSCC: Oral squamous cell carcinoma |
| ∗log2FC in expression of this searched gene in stem-like cells from each diseased tissue sample relative to stem-like cells in normal samples in each tissue plotted against the malignancy continuum. Samples are colored based on if they are from different disease stage. |
Top |
Malignant transformation related pathway analysis |
| Find out the enriched GO biological processes and KEGG pathways involved in transition from healthy to precancer to cancer |
| Tissue | Disease Stage | Enriched GO biological Processes |
| Colorectum | AD |  |
| Colorectum | SER |  |
| Colorectum | MSS |  |
| Colorectum | MSI-H |  |
| Colorectum | FAP |  |
| ∗Top 15 enriched GO BP terms are showed in the bar plot of each disease state in each tissue. Each row represents a significant GO biological process which is colored according to the -log10(p.adjust). |
| Page: 1 2 3 4 5 6 7 8 9 |
| GO ID | Tissue | Disease Stage | Description | Gene Ratio | Bg Ratio | pvalue | p.adjust | Count |
| GO:003109818 | Esophagus | ESCC | stress-activated protein kinase signaling cascade | 154/8552 | 247/18723 | 8.53e-08 | 1.44e-06 | 154 |
| GO:005140318 | Esophagus | ESCC | stress-activated MAPK cascade | 147/8552 | 239/18723 | 5.43e-07 | 7.18e-06 | 147 |
| GO:00072549 | Esophagus | ESCC | JNK cascade | 102/8552 | 167/18723 | 4.22e-05 | 3.39e-04 | 102 |
| GO:003109816 | Oral cavity | OSCC | stress-activated protein kinase signaling cascade | 141/7305 | 247/18723 | 5.74e-09 | 1.25e-07 | 141 |
| GO:005140316 | Oral cavity | OSCC | stress-activated MAPK cascade | 134/7305 | 239/18723 | 6.02e-08 | 1.09e-06 | 134 |
| GO:00072548 | Oral cavity | OSCC | JNK cascade | 90/7305 | 167/18723 | 6.49e-05 | 5.26e-04 | 90 |
| GO:003109817 | Oral cavity | LP | stress-activated protein kinase signaling cascade | 88/4623 | 247/18723 | 7.39e-05 | 9.68e-04 | 88 |
| GO:005140317 | Oral cavity | LP | stress-activated MAPK cascade | 84/4623 | 239/18723 | 1.79e-04 | 2.00e-03 | 84 |
| GO:003109825 | Skin | cSCC | stress-activated protein kinase signaling cascade | 92/4864 | 247/18723 | 5.78e-05 | 5.74e-04 | 92 |
| GO:005140325 | Skin | cSCC | stress-activated MAPK cascade | 88/4864 | 239/18723 | 1.32e-04 | 1.20e-03 | 88 |
| GO:000725423 | Skin | cSCC | JNK cascade | 60/4864 | 167/18723 | 2.77e-03 | 1.56e-02 | 60 |
| Page: 1 |
| Pathway ID | Tissue | Disease Stage | Description | Gene Ratio | Bg Ratio | pvalue | p.adjust | qvalue | Count |
| Page: 1 |
Top |
Cell-cell communication analysis |
| Identification of potential cell-cell interactions between two cell types and their ligand-receptor pairs for different disease states |
| Ligand | Receptor | LRpair | Pathway | Tissue | Disease Stage |
| ENTPD1 | ADORA2A | ENTPD1_ADORA2A | CD39 | Cervix | CC |
| ENTPD1 | ADORA2B | ENTPD1_ADORA2B | CD39 | Cervix | CC |
| ENTPD1 | ADORA2A | ENTPD1_ADORA2A | CD39 | Esophagus | ESCC |
| ENTPD1 | ADORA2B | ENTPD1_ADORA2B | CD39 | Esophagus | ESCC |
| ENTPD1 | ADORA2A | ENTPD1_ADORA2A | CD39 | GC | ADJ |
| ENTPD1 | ADORA2B | ENTPD1_ADORA2B | CD39 | HNSCC | ADJ |
| ENTPD1 | ADORA2B | ENTPD1_ADORA2B | CD39 | HNSCC | OSCC |
| ENTPD1 | ADORA2B | ENTPD1_ADORA2B | CD39 | HNSCC | Precancer |
| ENTPD1 | ADORA2B | ENTPD1_ADORA2B | CD39 | Lung | AAH |
| ENTPD1 | ADORA2B | ENTPD1_ADORA2B | CD39 | Prostate | BPH |
| ENTPD1 | ADORA2A | ENTPD1_ADORA2A | CD39 | Prostate | Healthy |
| ENTPD1 | ADORA2A | ENTPD1_ADORA2A | CD39 | Skin | AK |
| Page: 1 |
Top |
Single-cell gene regulatory network inference analysis |
| Find out the significant the regulons (TFs) and the target genes of each regulon across cell types for different disease states |
| TF | Cell Type | Tissue | Disease Stage | Target Gene | RSS | Regulon Activity |
| ∗The dot plots of a searched regulon are shown for all cell subpopulations in each disease state of each tissue based on the regulon specific score inferred using pySCENIC and by calculating the average expression. |
| Page: 1 |
Top |
Somatic mutation of malignant transformation related genes |
| Annotation of somatic variants for genes involved in malignant transformation |
| Hugo Symbol | Variant Class | Variant Classification | dbSNP RS | HGVSc | HGVSp | HGVSp Short | SWISSPROT | BIOTYPE | SIFT | PolyPhen | Tumor Sample Barcode | Tissue | Histology | Sex | Age | Stage | Therapy Types | Drugs | Outcome |
| ADO | SNV | Missense_Mutation | c.604G>A | p.Ala202Thr | p.A202T | Q96SZ5 | protein_coding | tolerated(0.25) | possibly_damaging(0.456) | TCGA-LP-A7HU-01 | Cervix | cervical & endocervical cancer | Female | <65 | I/II | Unknown | Unknown | SD | |
| ADO | SNV | Missense_Mutation | novel | c.696G>T | p.Lys232Asn | p.K232N | Q96SZ5 | protein_coding | tolerated(0.33) | benign(0.121) | TCGA-AX-A2HC-01 | Endometrium | uterine corpus endometrioid carcinoma | Female | <65 | III/IV | Chemotherapy | paclitaxel | PD |
| ADO | SNV | Missense_Mutation | novel | c.500C>A | p.Pro167Gln | p.P167Q | Q96SZ5 | protein_coding | tolerated(0.24) | benign(0.023) | TCGA-B5-A1MX-01 | Endometrium | uterine corpus endometrioid carcinoma | Female | <65 | I/II | Hormone Therapy | megace | SD |
| ADO | SNV | Missense_Mutation | novel | c.259T>A | p.Tyr87Asn | p.Y87N | Q96SZ5 | protein_coding | deleterious(0) | probably_damaging(0.999) | TCGA-BG-A222-01 | Endometrium | uterine corpus endometrioid carcinoma | Female | <65 | I/II | Unknown | Unknown | SD |
| ADO | SNV | Missense_Mutation | c.646G>T | p.Asp216Tyr | p.D216Y | Q96SZ5 | protein_coding | deleterious(0.01) | probably_damaging(0.955) | TCGA-55-6969-01 | Lung | lung adenocarcinoma | Male | <65 | I/II | Unknown | Unknown | SD | |
| ADO | SNV | Missense_Mutation | c.361N>T | p.Leu121Phe | p.L121F | Q96SZ5 | protein_coding | deleterious(0) | probably_damaging(0.986) | TCGA-63-5131-01 | Lung | lung squamous cell carcinoma | Male | Unknown | I/II | Unknown | Unknown | SD | |
| ADO | SNV | Missense_Mutation | c.181N>G | p.Leu61Val | p.L61V | Q96SZ5 | protein_coding | tolerated(1) | benign(0.012) | TCGA-BJ-A28V-01 | Thyroid | thyroid carcinoma | Female | >=65 | III/IV | Unknown | Unknown | SD | |
| ADO | SNV | Missense_Mutation | c.402C>A | p.Asp134Glu | p.D134E | Q96SZ5 | protein_coding | deleterious(0.02) | probably_damaging(0.951) | TCGA-EL-A4K4-01 | Thyroid | thyroid carcinoma | Female | <65 | I/II | Unknown | Unknown | SD |
| Page: 1 |
Top |
Related drugs of malignant transformation related genes |
| Identification of chemicals and drugs interact with genes involved in malignant transfromation |
| (DGIdb 4.0) |
| Entrez ID | Symbol | Category | Interaction Types | Drug Claim Name | Drug Name | PMIDs |
| 84890 | ADO | NA | hydrochlorothiazide | HYDROCHLOROTHIAZIDE | 31327267 |
| Page: 1 |

Copyright 2023-Present -The University of Texas Health Science Center at Houston |