
|
|||||
|
 | |
| |
| |
| |
| |
| |
|
Gene: ADIPOR2 |
Gene summary for ADIPOR2 |
| Gene information | Species | Human | Gene symbol | ADIPOR2 | Gene ID | 79602 |
| Gene name | adiponectin receptor 2 | |
| Gene Alias | ACDCR2 | |
| Cytomap | 12p13.33 | |
| Gene Type | protein-coding | GO ID | GO:0000003 | UniProtAcc | Q86V24 |
Top |
Malignant transformation analysis |
| Identification of the aberrant gene expression in precancerous and cancerous lesions by comparing the gene expression of stem-like cells in diseased tissues with normal stem cells |
| Entrez ID | Symbol | Replicates | Species | Organ | Tissue | Adj P-value | Log2FC | Malignancy |
| 79602 | ADIPOR2 | CCI_2 | Human | Cervix | CC | 5.93e-09 | 1.06e+00 | 0.5249 |
| 79602 | ADIPOR2 | CCI_3 | Human | Cervix | CC | 7.87e-14 | 1.10e+00 | 0.516 |
| 79602 | ADIPOR2 | HTA11_3410_2000001011 | Human | Colorectum | AD | 1.14e-05 | -3.73e-01 | 0.0155 |
| 79602 | ADIPOR2 | HTA11_866_3004761011 | Human | Colorectum | AD | 8.13e-05 | -3.86e-01 | 0.096 |
| 79602 | ADIPOR2 | HTA11_99999970781_79442 | Human | Colorectum | MSS | 2.46e-02 | -1.95e-01 | 0.294 |
| 79602 | ADIPOR2 | HTA11_99999974143_84620 | Human | Colorectum | MSS | 1.13e-10 | -4.29e-01 | 0.3005 |
| 79602 | ADIPOR2 | A002-C-010 | Human | Colorectum | FAP | 8.71e-03 | -2.42e-01 | 0.242 |
| 79602 | ADIPOR2 | A001-C-207 | Human | Colorectum | FAP | 2.09e-04 | -3.46e-01 | 0.1278 |
| 79602 | ADIPOR2 | A015-C-203 | Human | Colorectum | FAP | 7.42e-25 | -4.89e-01 | -0.1294 |
| 79602 | ADIPOR2 | A015-C-204 | Human | Colorectum | FAP | 1.11e-04 | -3.60e-01 | -0.0228 |
| 79602 | ADIPOR2 | A014-C-040 | Human | Colorectum | FAP | 5.76e-04 | -5.31e-01 | -0.1184 |
| 79602 | ADIPOR2 | A002-C-201 | Human | Colorectum | FAP | 8.56e-12 | -4.06e-01 | 0.0324 |
| 79602 | ADIPOR2 | A002-C-203 | Human | Colorectum | FAP | 2.59e-15 | -3.62e-01 | 0.2786 |
| 79602 | ADIPOR2 | A001-C-119 | Human | Colorectum | FAP | 9.55e-08 | -3.71e-01 | -0.1557 |
| 79602 | ADIPOR2 | A001-C-108 | Human | Colorectum | FAP | 7.28e-21 | -4.90e-01 | -0.0272 |
| 79602 | ADIPOR2 | A002-C-205 | Human | Colorectum | FAP | 1.58e-23 | -6.05e-01 | -0.1236 |
| 79602 | ADIPOR2 | A014-C-108 | Human | Colorectum | FAP | 3.65e-04 | -4.52e-01 | -0.124 |
| 79602 | ADIPOR2 | A001-C-104 | Human | Colorectum | FAP | 4.68e-09 | -4.02e-01 | 0.0184 |
| 79602 | ADIPOR2 | A015-C-005 | Human | Colorectum | FAP | 2.73e-09 | -4.70e-01 | -0.0336 |
| 79602 | ADIPOR2 | A015-C-006 | Human | Colorectum | FAP | 4.08e-13 | -4.91e-01 | -0.0994 |
| Page: 1 2 3 4 5 6 7 8 9 |
| Tissue | Expression Dynamics | Abbreviation |
| Cervix | 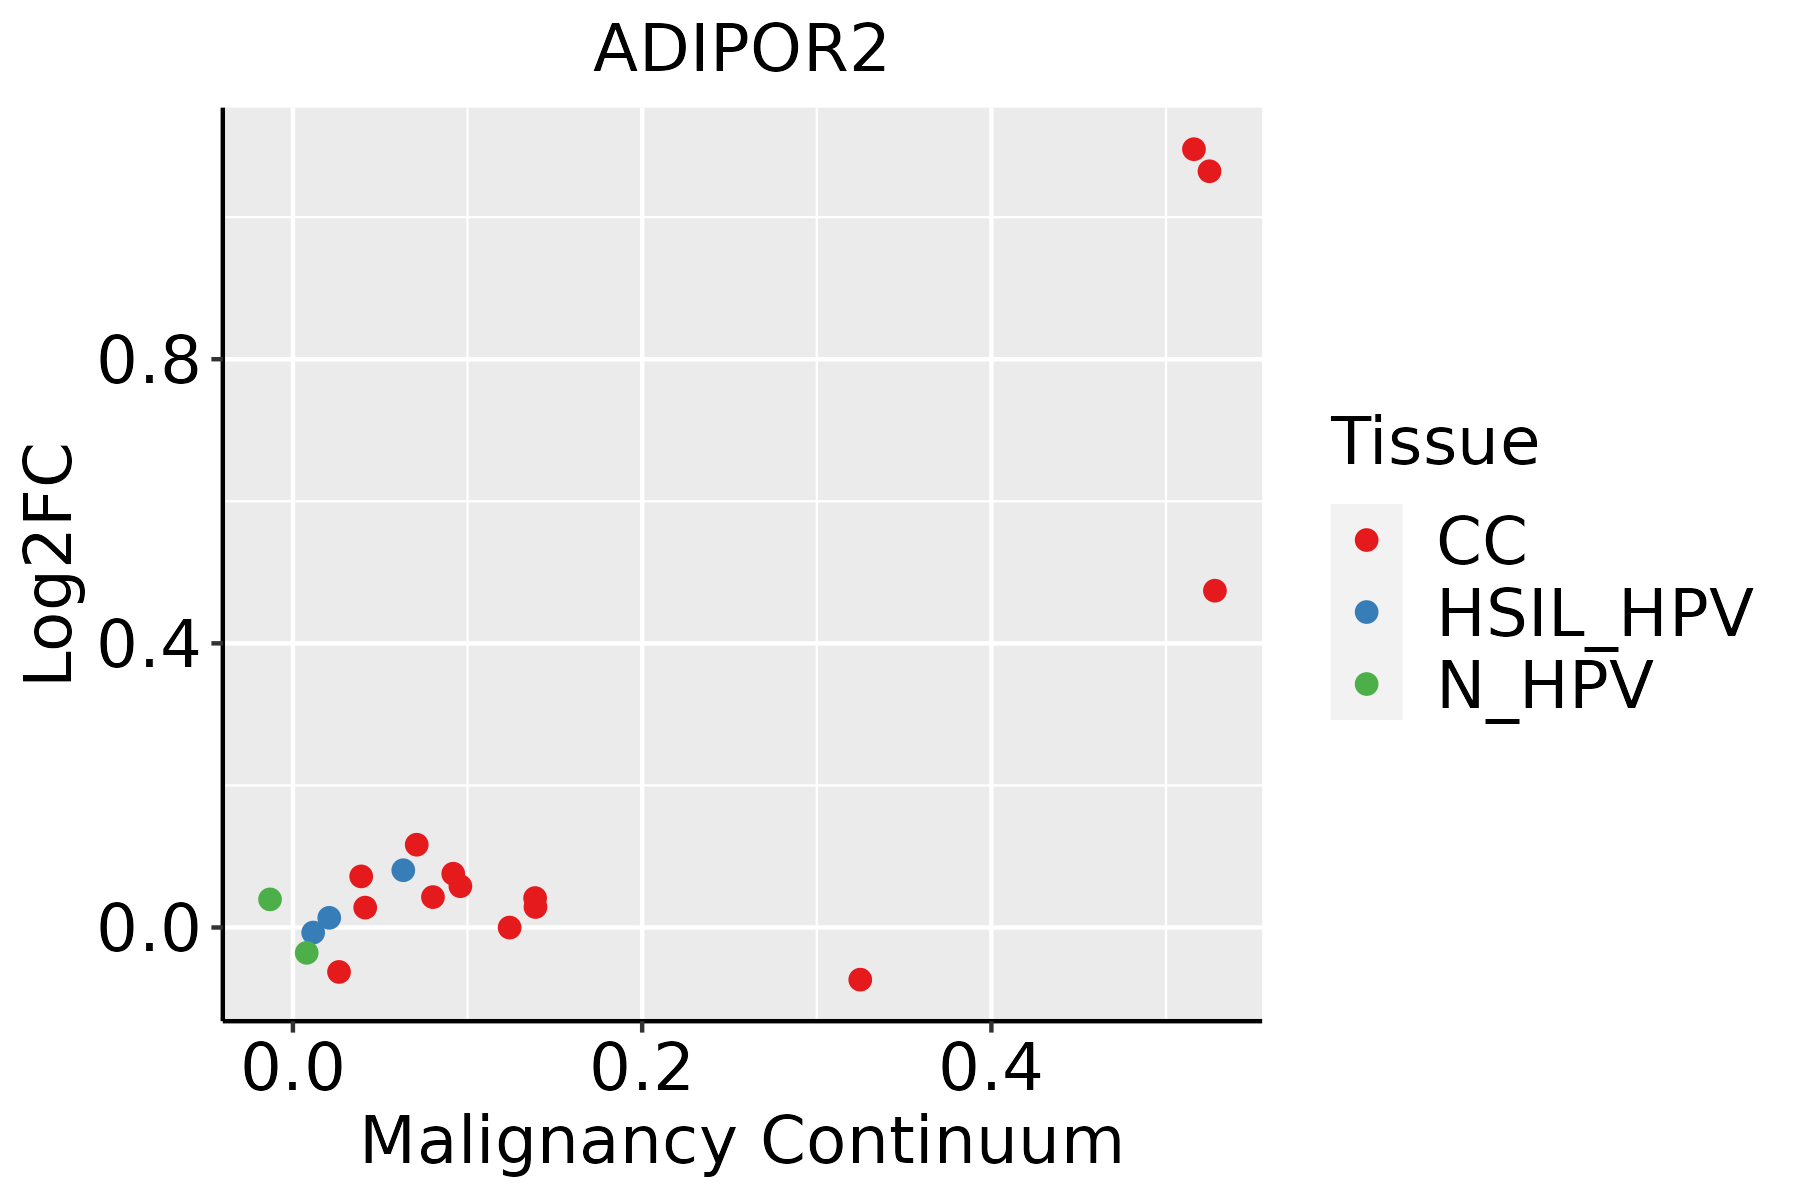 | CC: Cervix cancer |
| HSIL_HPV: HPV-infected high-grade squamous intraepithelial lesions | ||
| N_HPV: HPV-infected normal cervix | ||
| Colorectum (GSE201348) |  | FAP: Familial adenomatous polyposis |
| CRC: Colorectal cancer | ||
| Colorectum (HTA11) |  | AD: Adenomas |
| SER: Sessile serrated lesions | ||
| MSI-H: Microsatellite-high colorectal cancer | ||
| MSS: Microsatellite stable colorectal cancer | ||
| Esophagus | 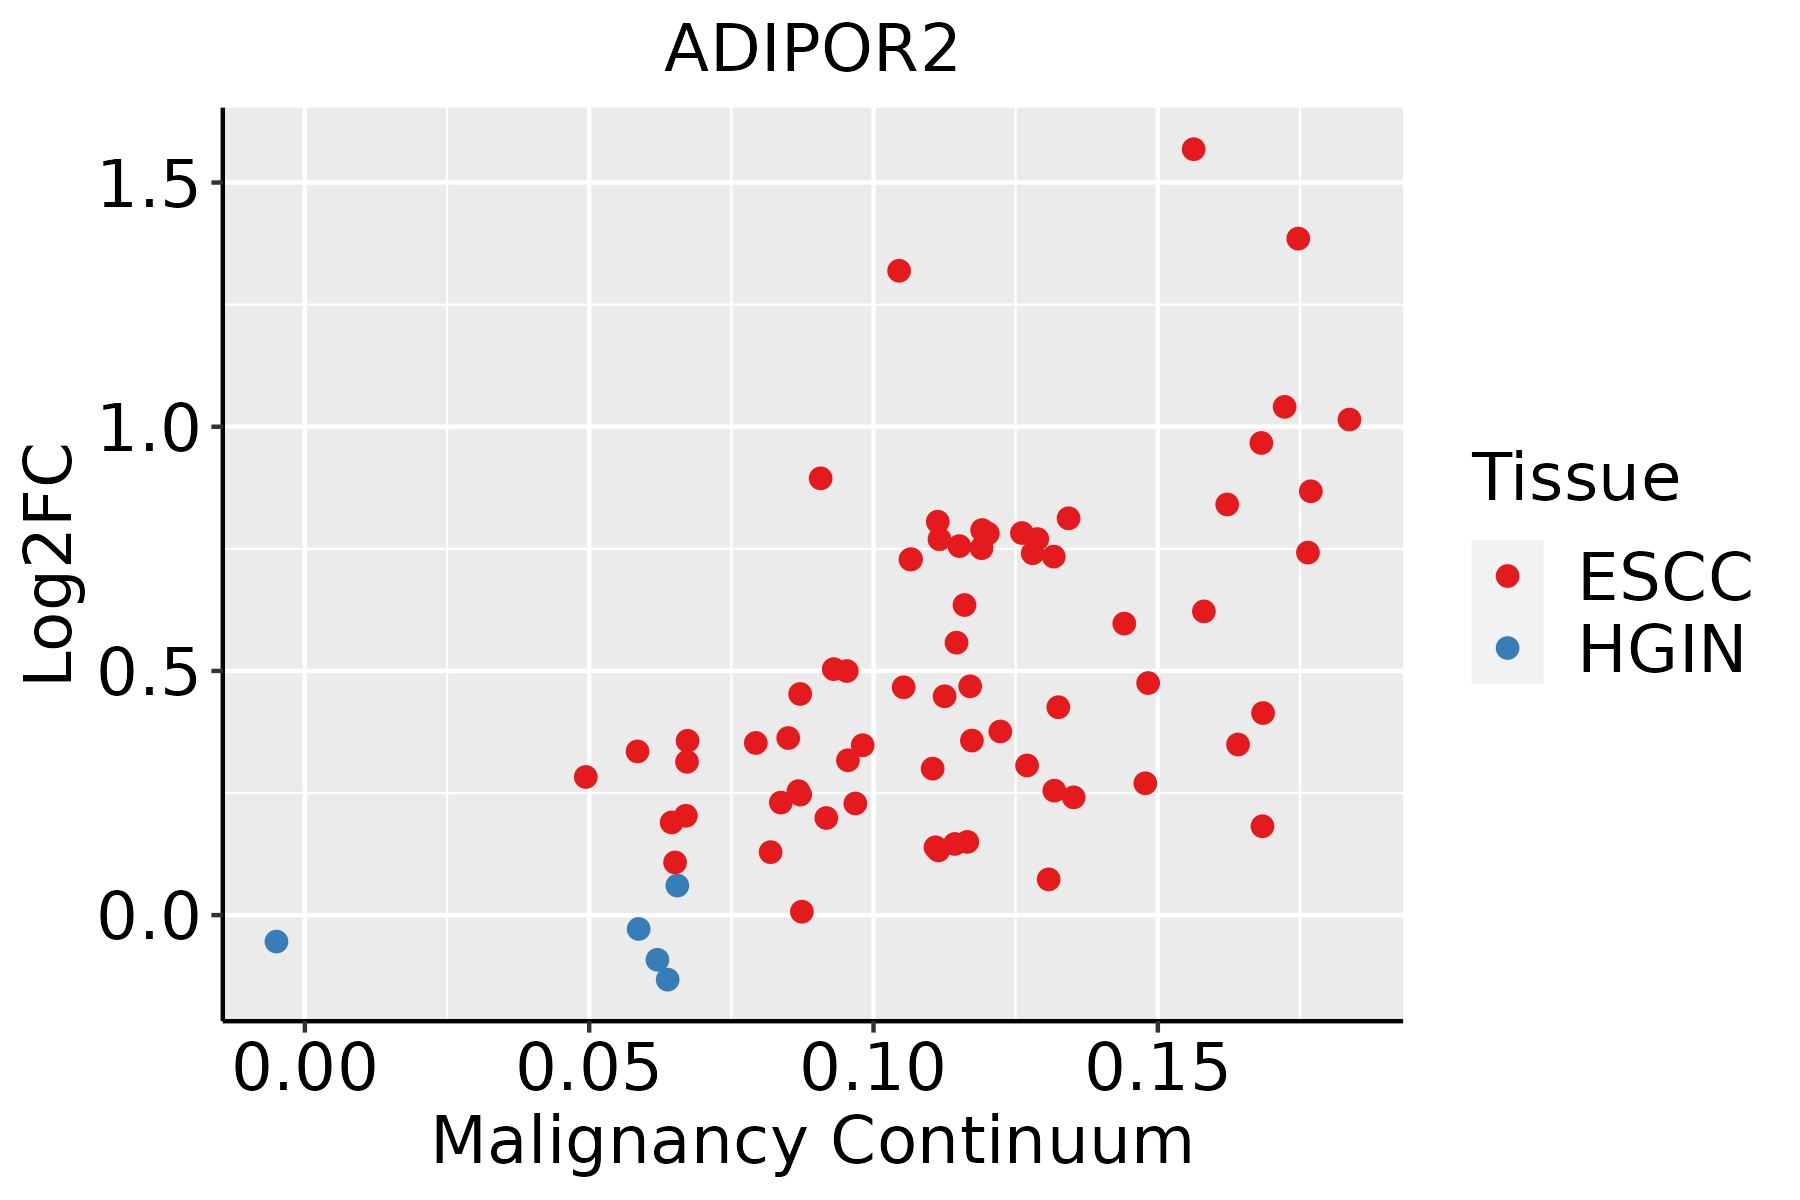 | ESCC: Esophageal squamous cell carcinoma |
| HGIN: High-grade intraepithelial neoplasias | ||
| LGIN: Low-grade intraepithelial neoplasias | ||
| Liver | 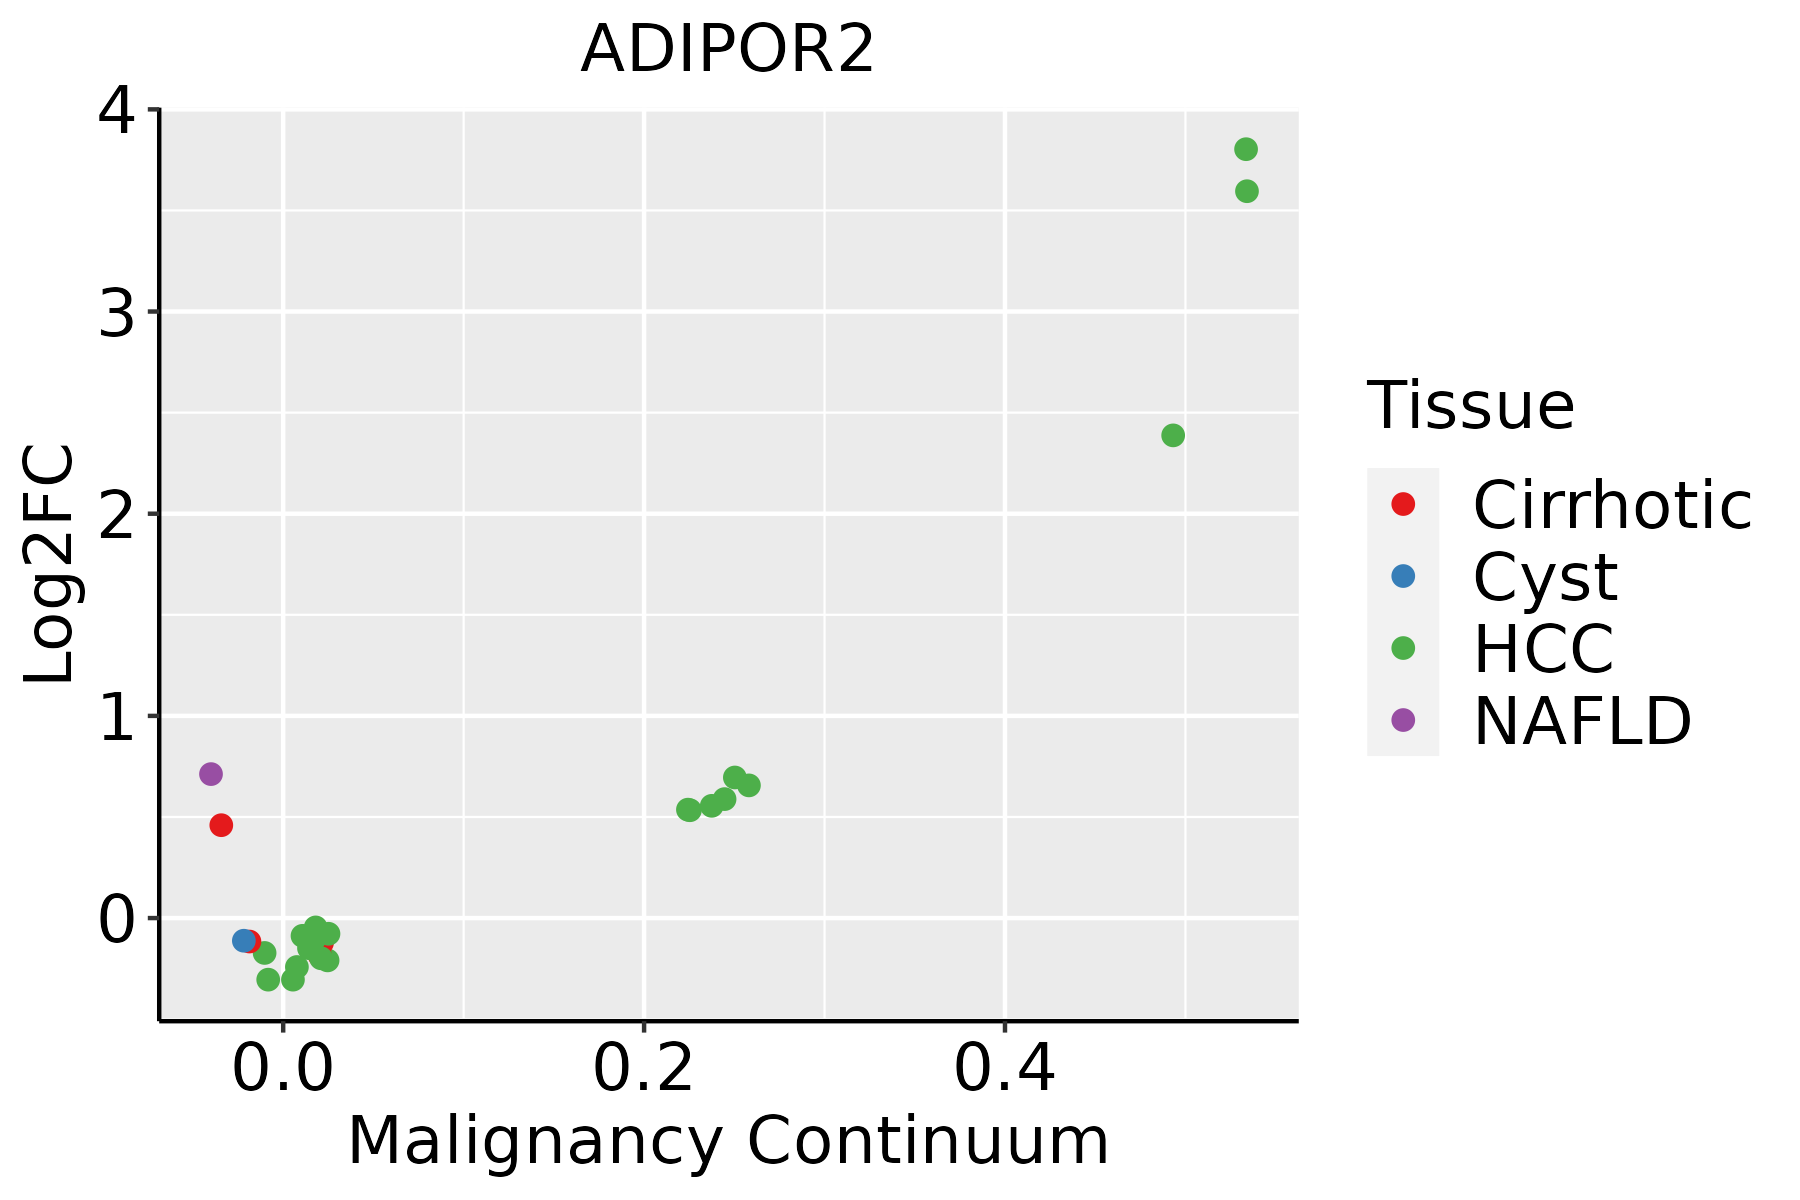 | HCC: Hepatocellular carcinoma |
| NAFLD: Non-alcoholic fatty liver disease | ||
| Lung | 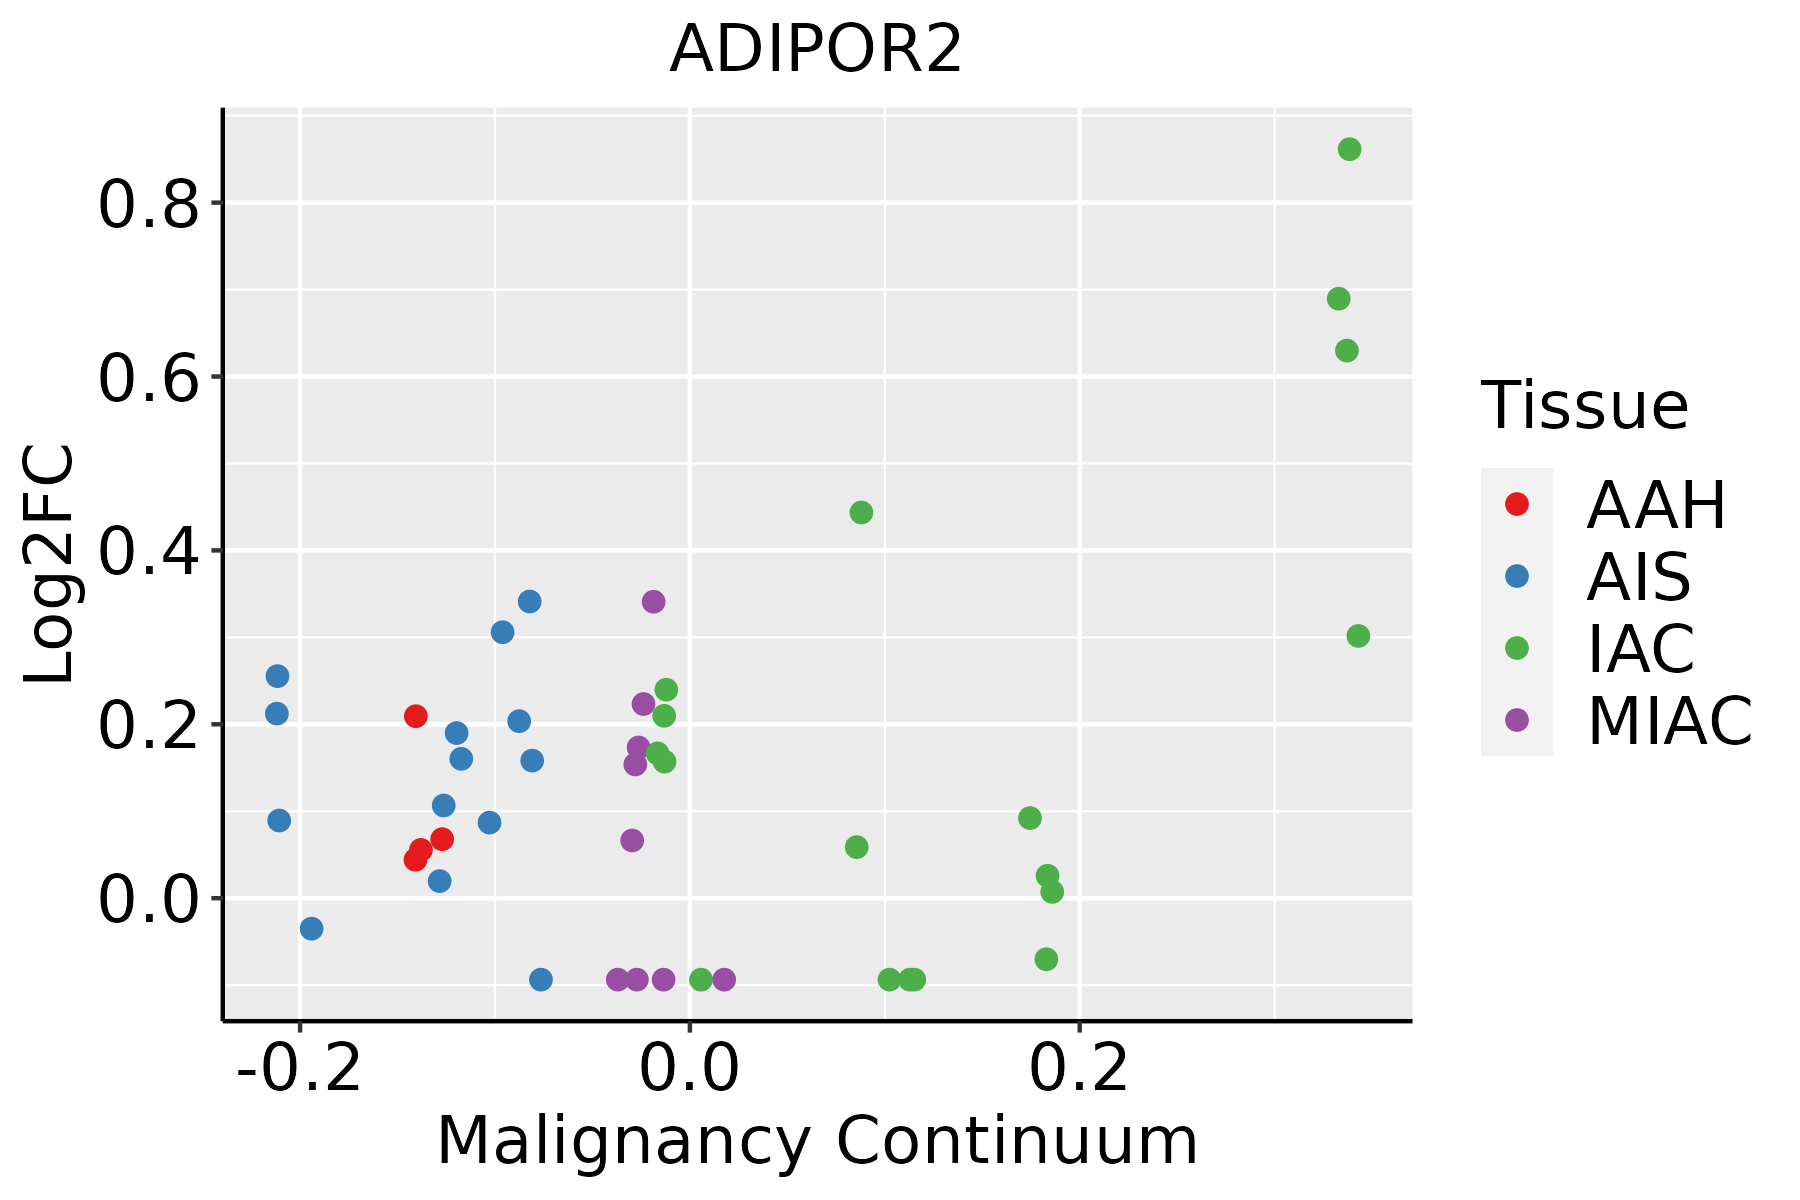 | AAH: Atypical adenomatous hyperplasia |
| AIS: Adenocarcinoma in situ | ||
| IAC: Invasive lung adenocarcinoma | ||
| MIA: Minimally invasive adenocarcinoma | ||
| Oral Cavity |  | EOLP: Erosive Oral lichen planus |
| LP: leukoplakia | ||
| NEOLP: Non-erosive oral lichen planus | ||
| OSCC: Oral squamous cell carcinoma | ||
| Skin |  | AK: Actinic keratosis |
| cSCC: Cutaneous squamous cell carcinoma | ||
| SCCIS:squamous cell carcinoma in situ | ||
| Thyroid | 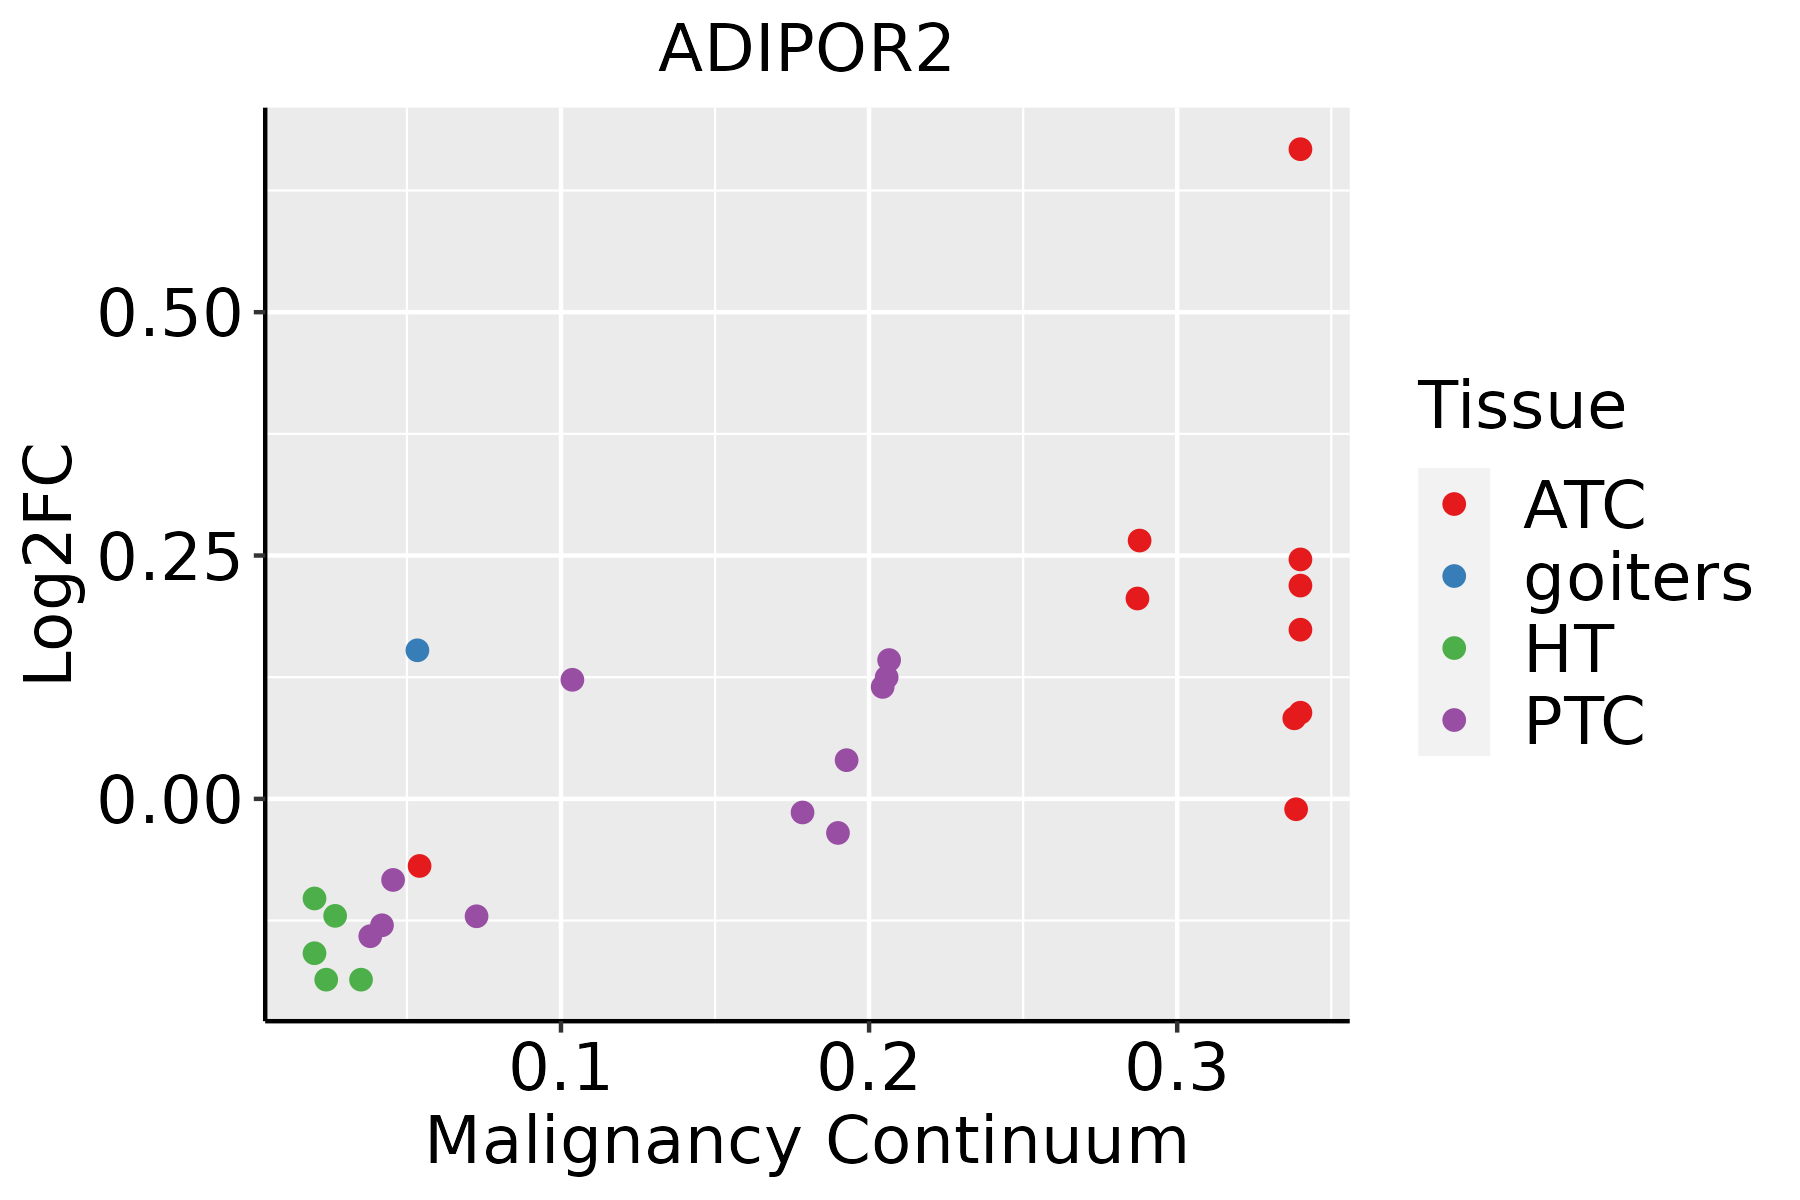 | ATC: Anaplastic thyroid cancer |
| HT: Hashimoto's thyroiditis | ||
| PTC: Papillary thyroid cancer |
| ∗log2FC in expression of this searched gene in stem-like cells from each diseased tissue sample relative to stem-like cells in normal samples in each tissue plotted against the malignancy continuum. Samples are colored based on if they are from different disease stage. |
Top |
Malignant transformation related pathway analysis |
| Find out the enriched GO biological processes and KEGG pathways involved in transition from healthy to precancer to cancer |
| Tissue | Disease Stage | Enriched GO biological Processes |
| Colorectum | AD |  |
| Colorectum | SER |  |
| Colorectum | MSS |  |
| Colorectum | MSI-H |  |
| Colorectum | FAP |  |
| ∗Top 15 enriched GO BP terms are showed in the bar plot of each disease state in each tissue. Each row represents a significant GO biological process which is colored according to the -log10(p.adjust). |
| Page: 1 2 3 4 5 6 7 8 9 |
| GO ID | Tissue | Disease Stage | Description | Gene Ratio | Bg Ratio | pvalue | p.adjust | Count |
| GO:004206010 | Cervix | CC | wound healing | 109/2311 | 422/18723 | 1.84e-14 | 1.57e-11 | 109 |
| GO:00016679 | Cervix | CC | ameboidal-type cell migration | 110/2311 | 475/18723 | 2.66e-11 | 6.36e-09 | 110 |
| GO:00022379 | Cervix | CC | response to molecule of bacterial origin | 78/2311 | 363/18723 | 5.55e-07 | 2.06e-05 | 78 |
| GO:00324969 | Cervix | CC | response to lipopolysaccharide | 74/2311 | 343/18723 | 9.15e-07 | 3.25e-05 | 74 |
| GO:003166710 | Cervix | CC | response to nutrient levels | 92/2311 | 474/18723 | 5.80e-06 | 1.42e-04 | 92 |
| GO:00160498 | Cervix | CC | cell growth | 92/2311 | 482/18723 | 1.16e-05 | 2.49e-04 | 92 |
| GO:00512713 | Cervix | CC | negative regulation of cellular component movement | 73/2311 | 367/18723 | 2.22e-05 | 3.95e-04 | 73 |
| GO:00400133 | Cervix | CC | negative regulation of locomotion | 76/2311 | 391/18723 | 3.47e-05 | 5.60e-04 | 76 |
| GO:20001463 | Cervix | CC | negative regulation of cell motility | 71/2311 | 359/18723 | 3.47e-05 | 5.60e-04 | 71 |
| GO:00303363 | Cervix | CC | negative regulation of cell migration | 68/2311 | 344/18723 | 5.11e-05 | 7.70e-04 | 68 |
| GO:000974310 | Cervix | CC | response to carbohydrate | 53/2311 | 253/18723 | 7.02e-05 | 9.85e-04 | 53 |
| GO:00075654 | Cervix | CC | female pregnancy | 43/2311 | 193/18723 | 7.62e-05 | 1.04e-03 | 43 |
| GO:003428410 | Cervix | CC | response to monosaccharide | 48/2311 | 225/18723 | 9.48e-05 | 1.25e-03 | 48 |
| GO:00015588 | Cervix | CC | regulation of cell growth | 77/2311 | 414/18723 | 1.40e-04 | 1.70e-03 | 77 |
| GO:00192213 | Cervix | CC | cytokine-mediated signaling pathway | 84/2311 | 472/18723 | 3.25e-04 | 3.44e-03 | 84 |
| GO:000974610 | Cervix | CC | response to hexose | 45/2311 | 219/18723 | 3.73e-04 | 3.86e-03 | 45 |
| GO:00447064 | Cervix | CC | multi-multicellular organism process | 45/2311 | 220/18723 | 4.14e-04 | 4.21e-03 | 45 |
| GO:00425939 | Cervix | CC | glucose homeostasis | 50/2311 | 258/18723 | 7.57e-04 | 6.76e-03 | 50 |
| GO:00335009 | Cervix | CC | carbohydrate homeostasis | 50/2311 | 259/18723 | 8.28e-04 | 7.22e-03 | 50 |
| GO:00094109 | Cervix | CC | response to xenobiotic stimulus | 78/2311 | 462/18723 | 2.39e-03 | 1.70e-02 | 78 |
| Page: 1 2 3 4 5 6 7 8 9 10 11 12 13 14 15 16 17 18 19 20 |
| Pathway ID | Tissue | Disease Stage | Description | Gene Ratio | Bg Ratio | pvalue | p.adjust | qvalue | Count |
| hsa0493218 | Cervix | CC | Non-alcoholic fatty liver disease | 58/1267 | 155/8465 | 3.58e-12 | 1.05e-10 | 6.23e-11 | 58 |
| hsa0493219 | Cervix | CC | Non-alcoholic fatty liver disease | 58/1267 | 155/8465 | 3.58e-12 | 1.05e-10 | 6.23e-11 | 58 |
| hsa04152 | Colorectum | AD | AMPK signaling pathway | 47/2092 | 121/8465 | 3.74e-04 | 2.82e-03 | 1.80e-03 | 47 |
| hsa04211 | Colorectum | AD | Longevity regulating pathway | 33/2092 | 89/8465 | 6.15e-03 | 2.68e-02 | 1.71e-02 | 33 |
| hsa041521 | Colorectum | AD | AMPK signaling pathway | 47/2092 | 121/8465 | 3.74e-04 | 2.82e-03 | 1.80e-03 | 47 |
| hsa042111 | Colorectum | AD | Longevity regulating pathway | 33/2092 | 89/8465 | 6.15e-03 | 2.68e-02 | 1.71e-02 | 33 |
| hsa049324 | Colorectum | MSS | Non-alcoholic fatty liver disease | 85/1875 | 155/8465 | 4.19e-19 | 1.17e-17 | 7.17e-18 | 85 |
| hsa042112 | Colorectum | MSS | Longevity regulating pathway | 33/1875 | 89/8465 | 9.33e-04 | 5.58e-03 | 3.42e-03 | 33 |
| hsa041522 | Colorectum | MSS | AMPK signaling pathway | 41/1875 | 121/8465 | 1.91e-03 | 9.83e-03 | 6.03e-03 | 41 |
| hsa049325 | Colorectum | MSS | Non-alcoholic fatty liver disease | 85/1875 | 155/8465 | 4.19e-19 | 1.17e-17 | 7.17e-18 | 85 |
| hsa042113 | Colorectum | MSS | Longevity regulating pathway | 33/1875 | 89/8465 | 9.33e-04 | 5.58e-03 | 3.42e-03 | 33 |
| hsa041523 | Colorectum | MSS | AMPK signaling pathway | 41/1875 | 121/8465 | 1.91e-03 | 9.83e-03 | 6.03e-03 | 41 |
| hsa049328 | Colorectum | FAP | Non-alcoholic fatty liver disease | 54/1404 | 155/8465 | 1.98e-08 | 6.20e-07 | 3.77e-07 | 54 |
| hsa041524 | Colorectum | FAP | AMPK signaling pathway | 37/1404 | 121/8465 | 8.97e-05 | 8.56e-04 | 5.21e-04 | 37 |
| hsa042114 | Colorectum | FAP | Longevity regulating pathway | 27/1404 | 89/8465 | 8.82e-04 | 5.20e-03 | 3.16e-03 | 27 |
| hsa049329 | Colorectum | FAP | Non-alcoholic fatty liver disease | 54/1404 | 155/8465 | 1.98e-08 | 6.20e-07 | 3.77e-07 | 54 |
| hsa041525 | Colorectum | FAP | AMPK signaling pathway | 37/1404 | 121/8465 | 8.97e-05 | 8.56e-04 | 5.21e-04 | 37 |
| hsa042115 | Colorectum | FAP | Longevity regulating pathway | 27/1404 | 89/8465 | 8.82e-04 | 5.20e-03 | 3.16e-03 | 27 |
| hsa042116 | Colorectum | CRC | Longevity regulating pathway | 20/1091 | 89/8465 | 8.36e-03 | 3.93e-02 | 2.66e-02 | 20 |
| hsa042117 | Colorectum | CRC | Longevity regulating pathway | 20/1091 | 89/8465 | 8.36e-03 | 3.93e-02 | 2.66e-02 | 20 |
| Page: 1 2 3 |
Top |
Cell-cell communication analysis |
| Identification of potential cell-cell interactions between two cell types and their ligand-receptor pairs for different disease states |
| Ligand | Receptor | LRpair | Pathway | Tissue | Disease Stage |
| ADIPOQ | ADIPOR2 | ADIPOQ_ADIPOR2 | ADIPONECTIN | CRC | ADJ |
| ADIPOQ | ADIPOR2 | ADIPOQ_ADIPOR2 | ADIPONECTIN | CRC | FAP |
| Page: 1 |
Top |
Single-cell gene regulatory network inference analysis |
| Find out the significant the regulons (TFs) and the target genes of each regulon across cell types for different disease states |
| TF | Cell Type | Tissue | Disease Stage | Target Gene | RSS | Regulon Activity |
| ∗The dot plots of a searched regulon are shown for all cell subpopulations in each disease state of each tissue based on the regulon specific score inferred using pySCENIC and by calculating the average expression. |
| Page: 1 |
Top |
Somatic mutation of malignant transformation related genes |
| Annotation of somatic variants for genes involved in malignant transformation |
| Hugo Symbol | Variant Class | Variant Classification | dbSNP RS | HGVSc | HGVSp | HGVSp Short | SWISSPROT | BIOTYPE | SIFT | PolyPhen | Tumor Sample Barcode | Tissue | Histology | Sex | Age | Stage | Therapy Types | Drugs | Outcome |
| ADIPOR2 | SNV | Missense_Mutation | c.817N>A | p.Gln273Lys | p.Q273K | Q86V24 | protein_coding | tolerated(1) | benign(0.006) | TCGA-D8-A27G-01 | Breast | breast invasive carcinoma | Female | >=65 | I/II | Unknown | Unknown | SD | |
| ADIPOR2 | SNV | Missense_Mutation | novel | c.805N>C | p.Phe269Leu | p.F269L | Q86V24 | protein_coding | deleterious(0) | probably_damaging(0.992) | TCGA-2W-A8YY-01 | Cervix | cervical & endocervical cancer | Female | <65 | I/II | Chemotherapy | cisplatin | CR |
| ADIPOR2 | SNV | Missense_Mutation | c.163N>G | p.His55Asp | p.H55D | Q86V24 | protein_coding | tolerated(0.43) | benign(0.013) | TCGA-IR-A3LH-01 | Cervix | cervical & endocervical cancer | Female | <65 | I/II | Chemotherapy | cisplatin | CR | |
| ADIPOR2 | SNV | Missense_Mutation | c.916N>A | p.Ala306Thr | p.A306T | Q86V24 | protein_coding | tolerated(0.58) | benign(0.01) | TCGA-A6-6780-01 | Colorectum | colon adenocarcinoma | Male | >=65 | I/II | Unknown | Unknown | SD | |
| ADIPOR2 | SNV | Missense_Mutation | c.589T>C | p.Phe197Leu | p.F197L | Q86V24 | protein_coding | tolerated(0.21) | benign(0.267) | TCGA-AA-3710-01 | Colorectum | colon adenocarcinoma | Female | >=65 | I/II | Unknown | Unknown | SD | |
| ADIPOR2 | SNV | Missense_Mutation | novel | c.446N>C | p.Ile149Thr | p.I149T | Q86V24 | protein_coding | deleterious(0) | probably_damaging(1) | TCGA-AZ-4315-01 | Colorectum | colon adenocarcinoma | Male | <65 | I/II | Unknown | Unknown | SD |
| ADIPOR2 | SNV | Missense_Mutation | c.916G>A | p.Ala306Thr | p.A306T | Q86V24 | protein_coding | tolerated(0.58) | benign(0.01) | TCGA-F4-6856-01 | Colorectum | colon adenocarcinoma | Male | <65 | I/II | Ancillary | leucovorin | CR | |
| ADIPOR2 | SNV | Missense_Mutation | c.1132G>A | p.Gly378Arg | p.G378R | Q86V24 | protein_coding | deleterious(0) | benign(0.097) | TCGA-G4-6310-01 | Colorectum | colon adenocarcinoma | Male | >=65 | III/IV | Chemotherapy | 5-fu | SD | |
| ADIPOR2 | SNV | Missense_Mutation | c.397N>T | p.Arg133Trp | p.R133W | Q86V24 | protein_coding | tolerated(0.14) | benign(0.029) | TCGA-WS-AB45-01 | Colorectum | colon adenocarcinoma | Female | <65 | I/II | Unknown | Unknown | SD | |
| ADIPOR2 | SNV | Missense_Mutation | rs777599853 | c.1000N>A | p.Glu334Lys | p.E334K | Q86V24 | protein_coding | deleterious(0) | probably_damaging(1) | TCGA-AG-A002-01 | Colorectum | rectum adenocarcinoma | Male | <65 | I/II | Unknown | Unknown | SD |
| Page: 1 2 3 4 5 |
Top |
Related drugs of malignant transformation related genes |
| Identification of chemicals and drugs interact with genes involved in malignant transfromation |
| (DGIdb 4.0) |
| Entrez ID | Symbol | Category | Interaction Types | Drug Claim Name | Drug Name | PMIDs |
| Page: 1 |

Copyright 2023-Present -The University of Texas Health Science Center at Houston |