
|
|||||
|
 | |
| |
| |
| |
| |
| |
|
Gene: ADIPOR1 |
Gene summary for ADIPOR1 |
| Gene information | Species | Human | Gene symbol | ADIPOR1 | Gene ID | 51094 |
| Gene name | adiponectin receptor 1 | |
| Gene Alias | ACDCR1 | |
| Cytomap | 1q32.1 | |
| Gene Type | protein-coding | GO ID | GO:0001558 | UniProtAcc | Q96A54 |
Top |
Malignant transformation analysis |
| Identification of the aberrant gene expression in precancerous and cancerous lesions by comparing the gene expression of stem-like cells in diseased tissues with normal stem cells |
| Entrez ID | Symbol | Replicates | Species | Organ | Tissue | Adj P-value | Log2FC | Malignancy |
| 51094 | ADIPOR1 | HTA11_2487_2000001011 | Human | Colorectum | SER | 1.96e-02 | 2.24e-01 | -0.1808 |
| 51094 | ADIPOR1 | HTA11_1938_2000001011 | Human | Colorectum | AD | 7.27e-03 | 2.51e-01 | -0.0811 |
| 51094 | ADIPOR1 | HTA11_78_2000001011 | Human | Colorectum | AD | 8.77e-08 | 4.21e-01 | -0.1088 |
| 51094 | ADIPOR1 | HTA11_347_2000001011 | Human | Colorectum | AD | 6.17e-09 | 2.96e-01 | -0.1954 |
| 51094 | ADIPOR1 | HTA11_1391_2000001011 | Human | Colorectum | AD | 4.47e-06 | 3.15e-01 | -0.059 |
| 51094 | ADIPOR1 | HTA11_2992_2000001011 | Human | Colorectum | SER | 3.97e-02 | 3.22e-01 | -0.1706 |
| 51094 | ADIPOR1 | HTA11_866_3004761011 | Human | Colorectum | AD | 3.07e-06 | 1.82e-01 | 0.096 |
| 51094 | ADIPOR1 | HTA11_7696_3000711011 | Human | Colorectum | AD | 4.25e-02 | 1.99e-01 | 0.0674 |
| 51094 | ADIPOR1 | HTA11_6818_2000001021 | Human | Colorectum | AD | 1.02e-04 | 3.49e-01 | 0.0588 |
| 51094 | ADIPOR1 | HTA11_99999970781_79442 | Human | Colorectum | MSS | 1.47e-08 | 3.17e-01 | 0.294 |
| 51094 | ADIPOR1 | HTA11_99999965062_69753 | Human | Colorectum | MSI-H | 2.88e-02 | 5.32e-01 | 0.3487 |
| 51094 | ADIPOR1 | HTA11_99999965104_69814 | Human | Colorectum | MSS | 3.54e-09 | 4.72e-01 | 0.281 |
| 51094 | ADIPOR1 | HTA11_99999971662_82457 | Human | Colorectum | MSS | 1.06e-12 | 4.52e-01 | 0.3859 |
| 51094 | ADIPOR1 | LZE3D | Human | Esophagus | HGIN | 4.56e-07 | 3.14e-01 | 0.0668 |
| 51094 | ADIPOR1 | LZE4T | Human | Esophagus | ESCC | 1.28e-06 | 4.48e-01 | 0.0811 |
| 51094 | ADIPOR1 | LZE7T | Human | Esophagus | ESCC | 1.95e-05 | 8.58e-01 | 0.0667 |
| 51094 | ADIPOR1 | LZE20T | Human | Esophagus | ESCC | 9.37e-05 | 3.56e-01 | 0.0662 |
| 51094 | ADIPOR1 | LZE22T | Human | Esophagus | ESCC | 7.21e-03 | 1.05e+00 | 0.068 |
| 51094 | ADIPOR1 | LZE24T | Human | Esophagus | ESCC | 1.70e-18 | 1.04e+00 | 0.0596 |
| 51094 | ADIPOR1 | LZE21T | Human | Esophagus | ESCC | 1.41e-03 | 1.33e-01 | 0.0655 |
| Page: 1 2 3 4 5 6 7 |
| Tissue | Expression Dynamics | Abbreviation |
| Colorectum (GSE201348) | 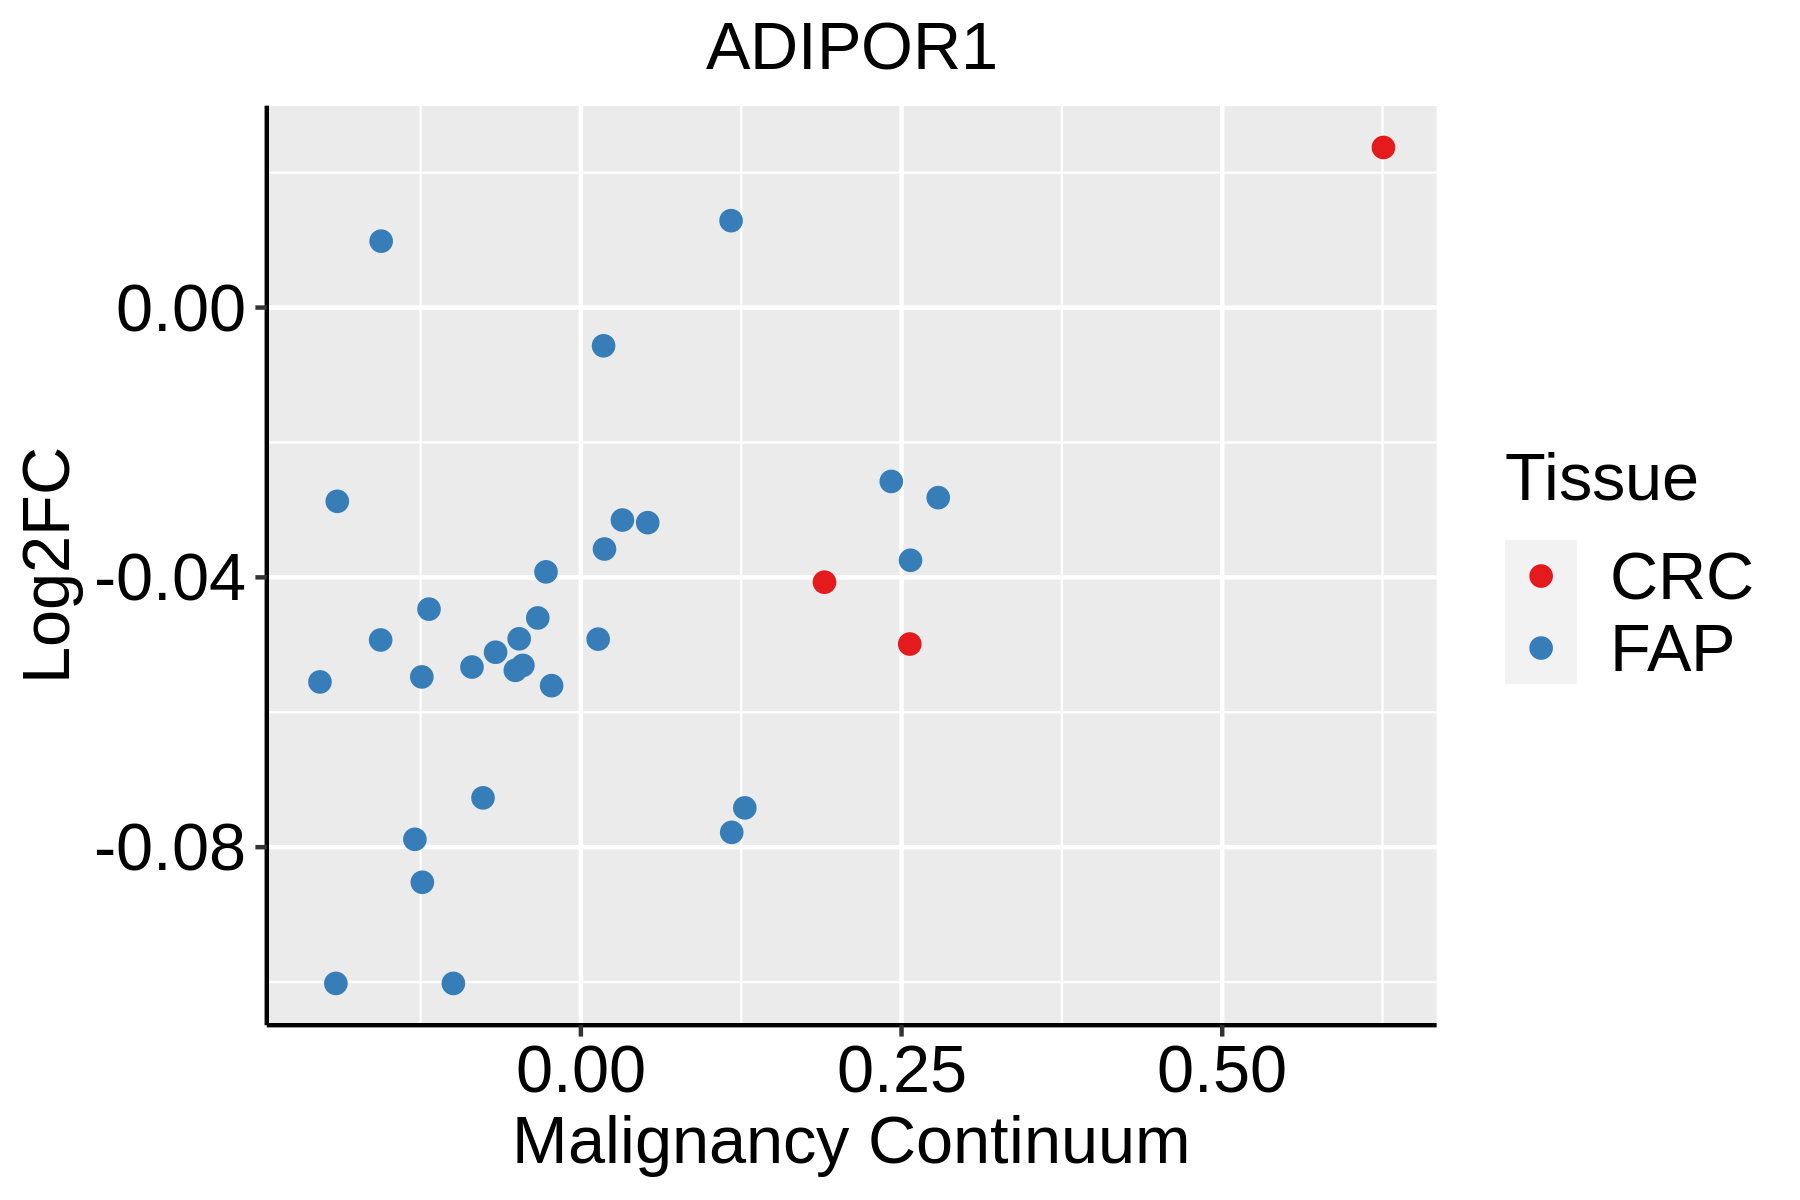 | FAP: Familial adenomatous polyposis |
| CRC: Colorectal cancer | ||
| Colorectum (HTA11) |  | AD: Adenomas |
| SER: Sessile serrated lesions | ||
| MSI-H: Microsatellite-high colorectal cancer | ||
| MSS: Microsatellite stable colorectal cancer | ||
| Esophagus | 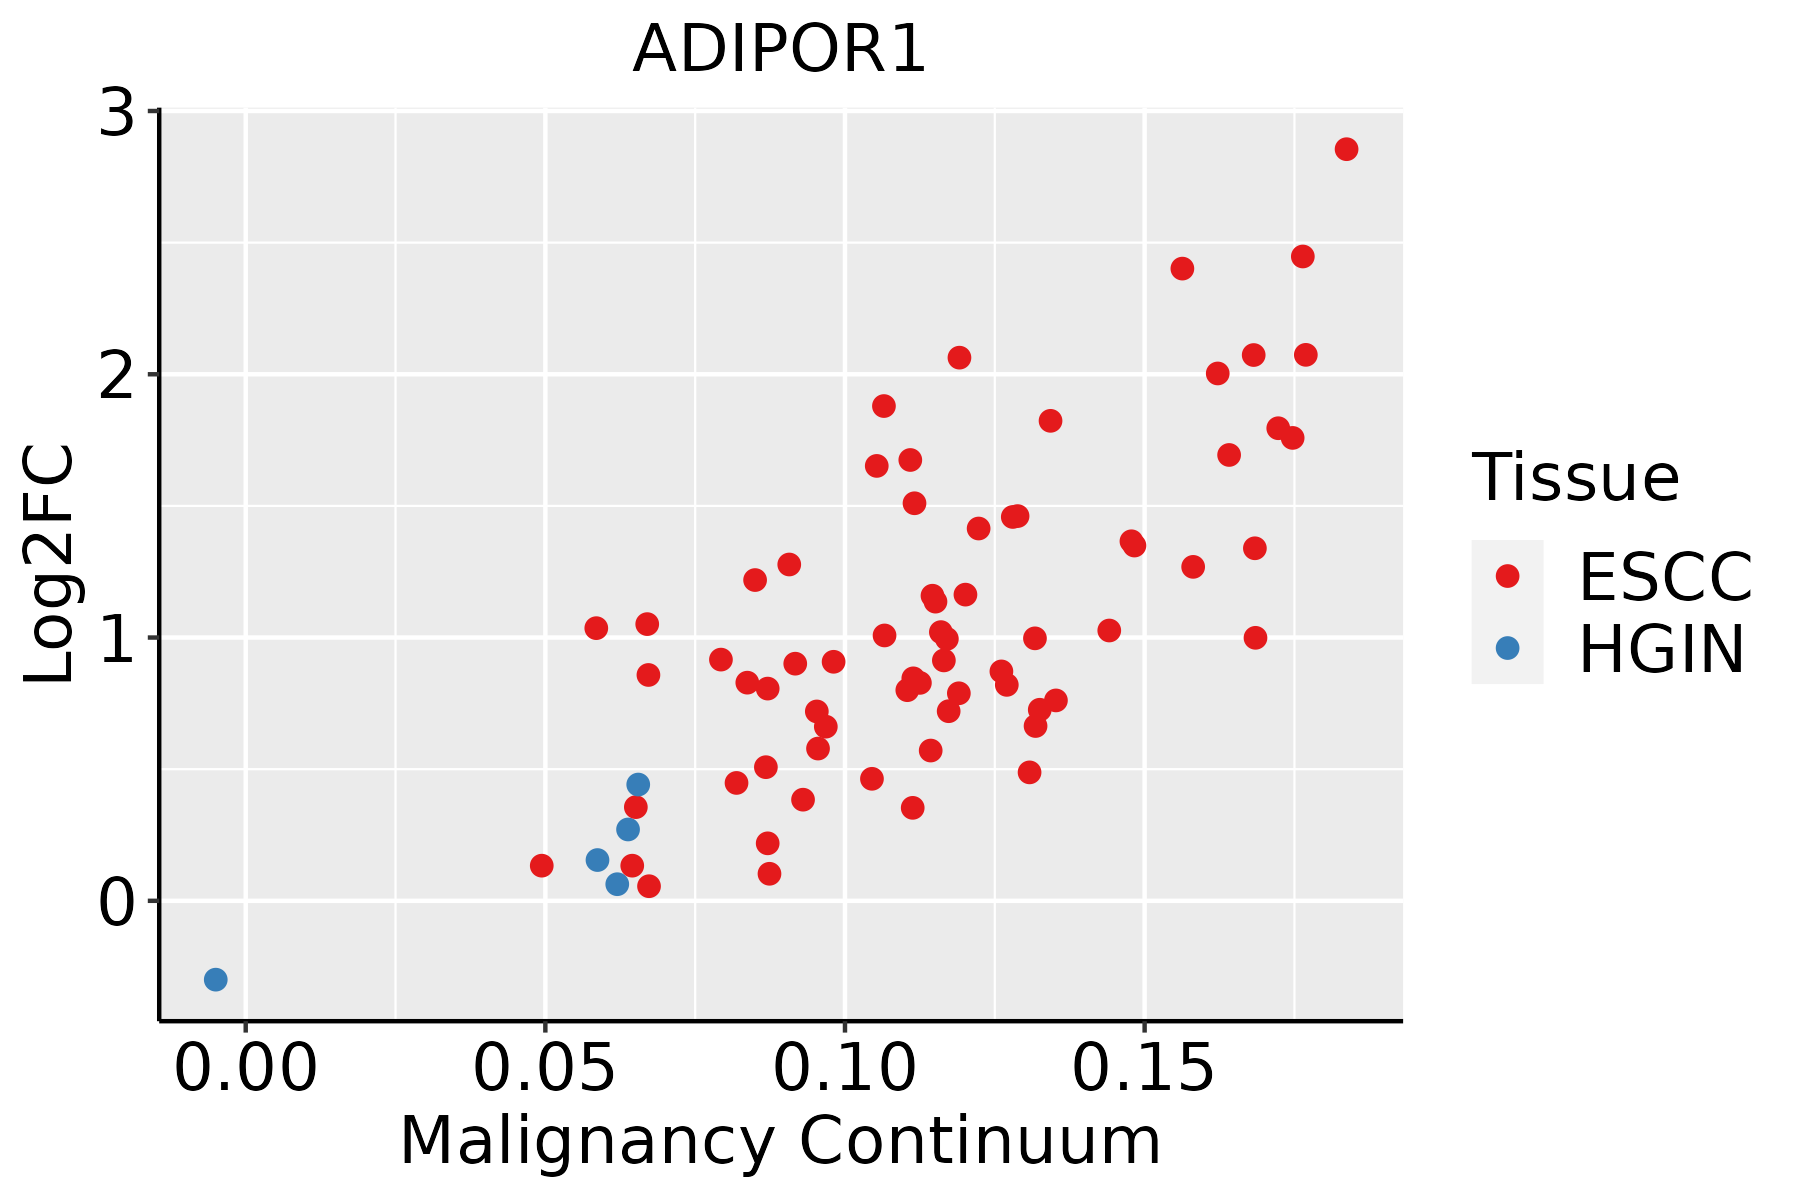 | ESCC: Esophageal squamous cell carcinoma |
| HGIN: High-grade intraepithelial neoplasias | ||
| LGIN: Low-grade intraepithelial neoplasias | ||
| Liver |  | HCC: Hepatocellular carcinoma |
| NAFLD: Non-alcoholic fatty liver disease | ||
| Oral Cavity |  | EOLP: Erosive Oral lichen planus |
| LP: leukoplakia | ||
| NEOLP: Non-erosive oral lichen planus | ||
| OSCC: Oral squamous cell carcinoma | ||
| Prostate | 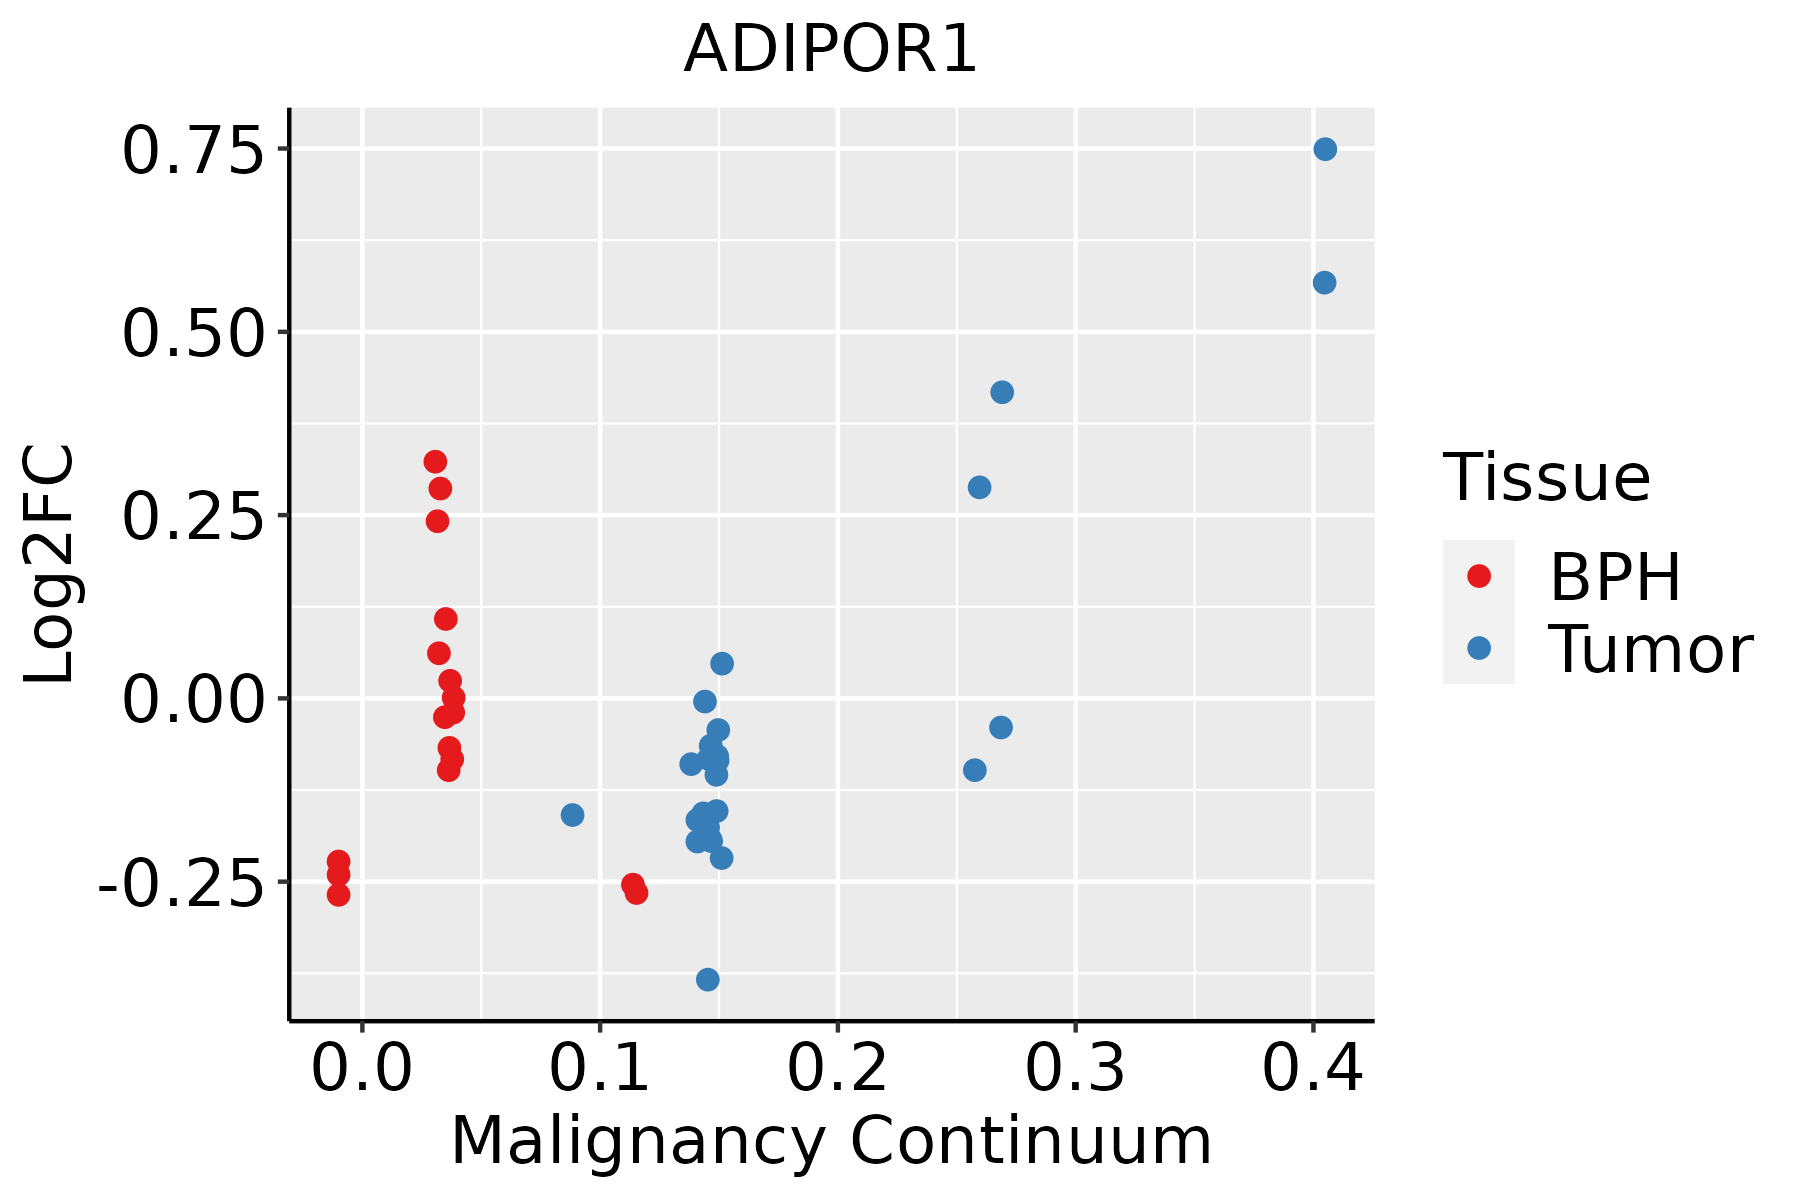 | BPH: Benign Prostatic Hyperplasia |
| Skin |  | AK: Actinic keratosis |
| cSCC: Cutaneous squamous cell carcinoma | ||
| SCCIS:squamous cell carcinoma in situ | ||
| Thyroid | 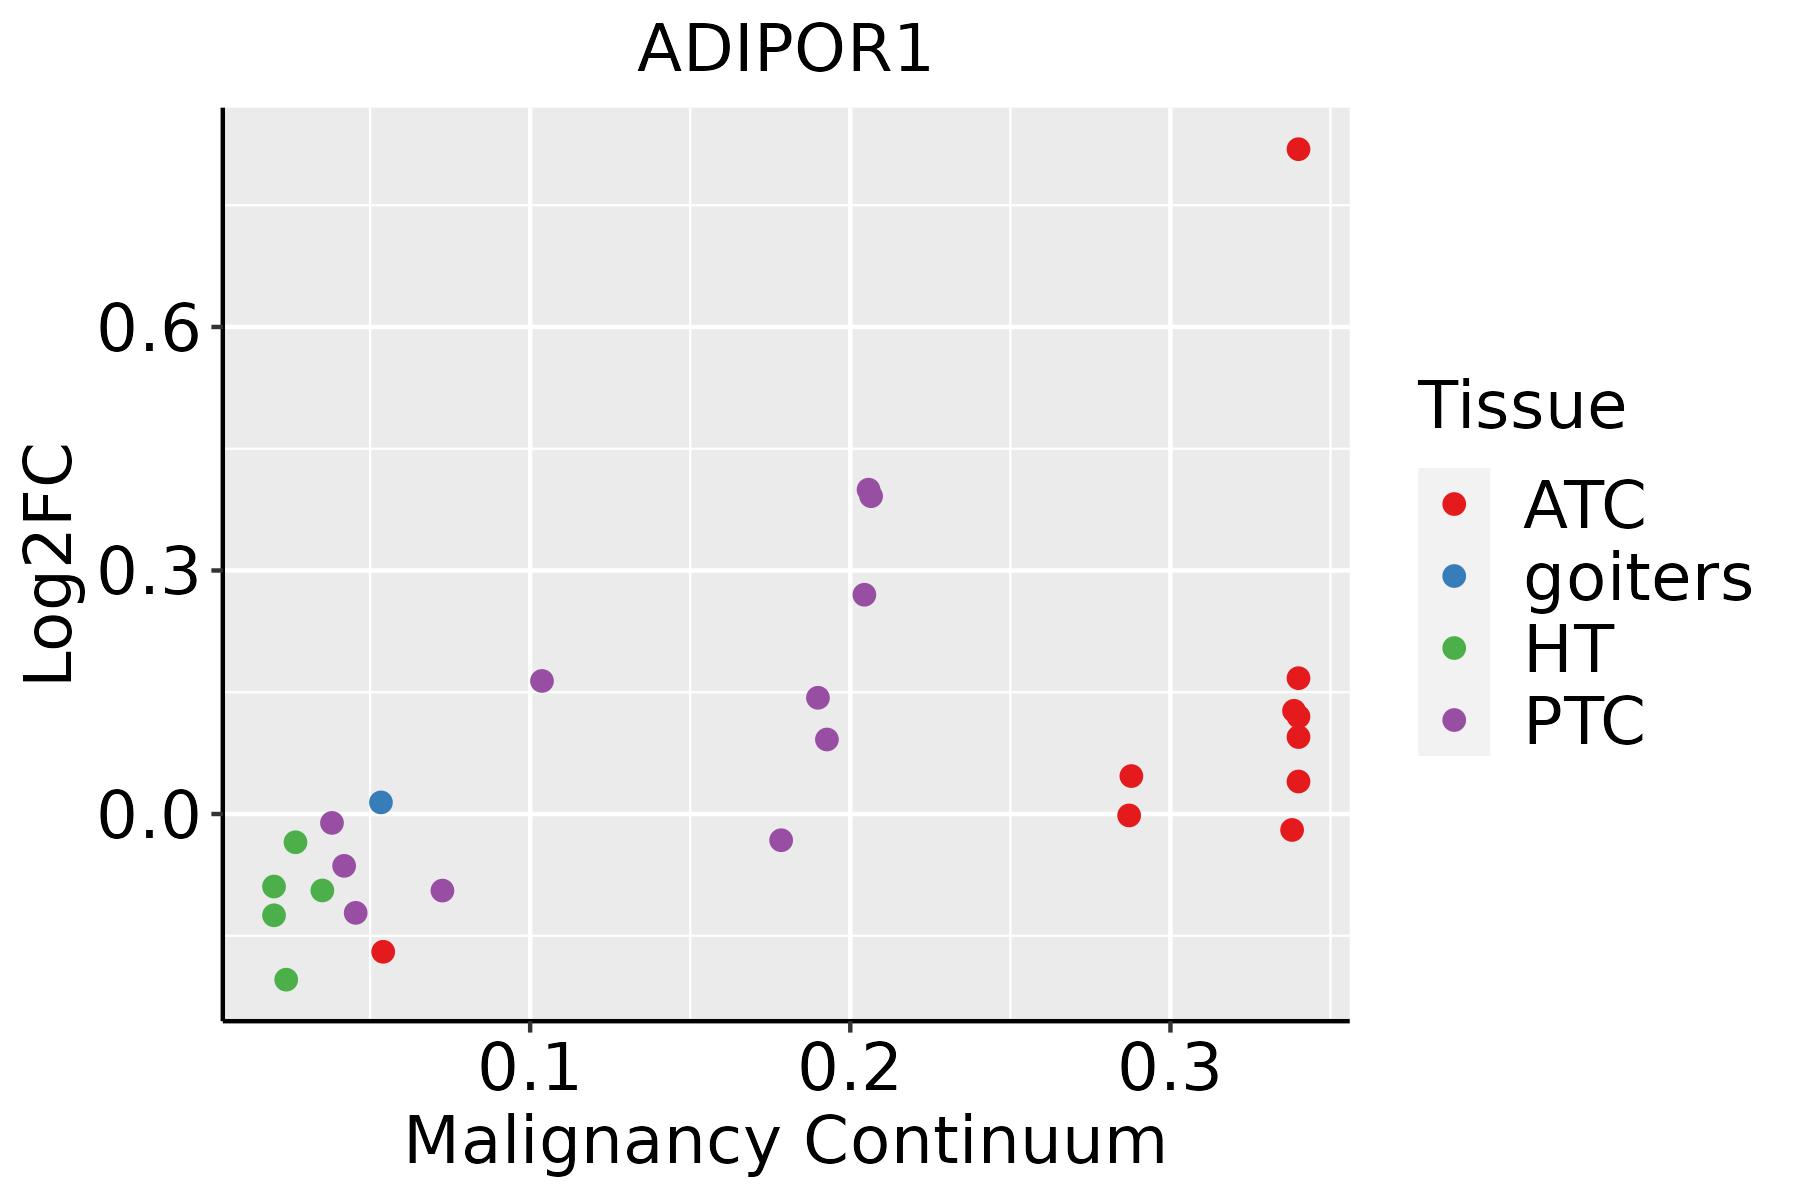 | ATC: Anaplastic thyroid cancer |
| HT: Hashimoto's thyroiditis | ||
| PTC: Papillary thyroid cancer |
| ∗log2FC in expression of this searched gene in stem-like cells from each diseased tissue sample relative to stem-like cells in normal samples in each tissue plotted against the malignancy continuum. Samples are colored based on if they are from different disease stage. |
Top |
Malignant transformation related pathway analysis |
| Find out the enriched GO biological processes and KEGG pathways involved in transition from healthy to precancer to cancer |
| Tissue | Disease Stage | Enriched GO biological Processes |
| Colorectum | AD |  |
| Colorectum | SER |  |
| Colorectum | MSS |  |
| Colorectum | MSI-H |  |
| Colorectum | FAP |  |
| ∗Top 15 enriched GO BP terms are showed in the bar plot of each disease state in each tissue. Each row represents a significant GO biological process which is colored according to the -log10(p.adjust). |
| Page: 1 2 3 4 5 6 7 8 9 |
| GO ID | Tissue | Disease Stage | Description | Gene Ratio | Bg Ratio | pvalue | p.adjust | Count |
| GO:0032868 | Colorectum | AD | response to insulin | 91/3918 | 264/18723 | 2.02e-07 | 8.48e-06 | 91 |
| GO:1901653 | Colorectum | AD | cellular response to peptide | 114/3918 | 359/18723 | 8.32e-07 | 2.88e-05 | 114 |
| GO:0032869 | Colorectum | AD | cellular response to insulin stimulus | 72/3918 | 203/18723 | 1.10e-06 | 3.68e-05 | 72 |
| GO:0071375 | Colorectum | AD | cellular response to peptide hormone stimulus | 95/3918 | 290/18723 | 1.50e-06 | 4.66e-05 | 95 |
| GO:0043434 | Colorectum | AD | response to peptide hormone | 126/3918 | 414/18723 | 2.70e-06 | 7.86e-05 | 126 |
| GO:0016049 | Colorectum | AD | cell growth | 143/3918 | 482/18723 | 2.83e-06 | 8.09e-05 | 143 |
| GO:0001558 | Colorectum | AD | regulation of cell growth | 124/3918 | 414/18723 | 7.67e-06 | 1.86e-04 | 124 |
| GO:0033500 | Colorectum | AD | carbohydrate homeostasis | 84/3918 | 259/18723 | 9.10e-06 | 2.15e-04 | 84 |
| GO:0042593 | Colorectum | AD | glucose homeostasis | 83/3918 | 258/18723 | 1.44e-05 | 3.11e-04 | 83 |
| GO:0019318 | Colorectum | AD | hexose metabolic process | 77/3918 | 237/18723 | 1.96e-05 | 4.01e-04 | 77 |
| GO:0001667 | Colorectum | AD | ameboidal-type cell migration | 137/3918 | 475/18723 | 2.17e-05 | 4.33e-04 | 137 |
| GO:0019395 | Colorectum | AD | fatty acid oxidation | 40/3918 | 103/18723 | 2.43e-05 | 4.69e-04 | 40 |
| GO:0009755 | Colorectum | AD | hormone-mediated signaling pathway | 64/3918 | 190/18723 | 2.78e-05 | 5.24e-04 | 64 |
| GO:0006631 | Colorectum | AD | fatty acid metabolic process | 114/3918 | 390/18723 | 5.58e-05 | 9.44e-04 | 114 |
| GO:0044262 | Colorectum | AD | cellular carbohydrate metabolic process | 87/3918 | 283/18723 | 6.00e-05 | 1.01e-03 | 87 |
| GO:0005996 | Colorectum | AD | monosaccharide metabolic process | 80/3918 | 257/18723 | 7.31e-05 | 1.17e-03 | 80 |
| GO:0034440 | Colorectum | AD | lipid oxidation | 40/3918 | 108/18723 | 8.52e-05 | 1.32e-03 | 40 |
| GO:0090132 | Colorectum | AD | epithelium migration | 105/3918 | 360/18723 | 1.18e-04 | 1.73e-03 | 105 |
| GO:0010632 | Colorectum | AD | regulation of epithelial cell migration | 88/3918 | 292/18723 | 1.19e-04 | 1.75e-03 | 88 |
| GO:0010631 | Colorectum | AD | epithelial cell migration | 104/3918 | 357/18723 | 1.33e-04 | 1.90e-03 | 104 |
| Page: 1 2 3 4 5 6 7 8 9 10 11 12 13 14 15 16 17 18 19 20 21 |
| Pathway ID | Tissue | Disease Stage | Description | Gene Ratio | Bg Ratio | pvalue | p.adjust | qvalue | Count |
| hsa04932 | Colorectum | AD | Non-alcoholic fatty liver disease | 90/2092 | 155/8465 | 4.83e-19 | 1.80e-17 | 1.15e-17 | 90 |
| hsa04152 | Colorectum | AD | AMPK signaling pathway | 47/2092 | 121/8465 | 3.74e-04 | 2.82e-03 | 1.80e-03 | 47 |
| hsa04211 | Colorectum | AD | Longevity regulating pathway | 33/2092 | 89/8465 | 6.15e-03 | 2.68e-02 | 1.71e-02 | 33 |
| hsa049321 | Colorectum | AD | Non-alcoholic fatty liver disease | 90/2092 | 155/8465 | 4.83e-19 | 1.80e-17 | 1.15e-17 | 90 |
| hsa041521 | Colorectum | AD | AMPK signaling pathway | 47/2092 | 121/8465 | 3.74e-04 | 2.82e-03 | 1.80e-03 | 47 |
| hsa042111 | Colorectum | AD | Longevity regulating pathway | 33/2092 | 89/8465 | 6.15e-03 | 2.68e-02 | 1.71e-02 | 33 |
| hsa042112 | Colorectum | MSS | Longevity regulating pathway | 33/1875 | 89/8465 | 9.33e-04 | 5.58e-03 | 3.42e-03 | 33 |
| hsa041522 | Colorectum | MSS | AMPK signaling pathway | 41/1875 | 121/8465 | 1.91e-03 | 9.83e-03 | 6.03e-03 | 41 |
| hsa042113 | Colorectum | MSS | Longevity regulating pathway | 33/1875 | 89/8465 | 9.33e-04 | 5.58e-03 | 3.42e-03 | 33 |
| hsa041523 | Colorectum | MSS | AMPK signaling pathway | 41/1875 | 121/8465 | 1.91e-03 | 9.83e-03 | 6.03e-03 | 41 |
| hsa04932210 | Esophagus | ESCC | Non-alcoholic fatty liver disease | 122/4205 | 155/8465 | 5.69e-14 | 1.59e-12 | 8.14e-13 | 122 |
| hsa0415210 | Esophagus | ESCC | AMPK signaling pathway | 80/4205 | 121/8465 | 1.73e-04 | 6.67e-04 | 3.42e-04 | 80 |
| hsa0421114 | Esophagus | ESCC | Longevity regulating pathway | 58/4205 | 89/8465 | 2.19e-03 | 6.16e-03 | 3.16e-03 | 58 |
| hsa0493238 | Esophagus | ESCC | Non-alcoholic fatty liver disease | 122/4205 | 155/8465 | 5.69e-14 | 1.59e-12 | 8.14e-13 | 122 |
| hsa0415213 | Esophagus | ESCC | AMPK signaling pathway | 80/4205 | 121/8465 | 1.73e-04 | 6.67e-04 | 3.42e-04 | 80 |
| hsa0421115 | Esophagus | ESCC | Longevity regulating pathway | 58/4205 | 89/8465 | 2.19e-03 | 6.16e-03 | 3.16e-03 | 58 |
| hsa0493222 | Liver | Cirrhotic | Non-alcoholic fatty liver disease | 106/2530 | 155/8465 | 2.16e-23 | 2.40e-21 | 1.48e-21 | 106 |
| hsa04936 | Liver | Cirrhotic | Alcoholic liver disease | 60/2530 | 142/8465 | 1.07e-03 | 5.85e-03 | 3.61e-03 | 60 |
| hsa0415221 | Liver | Cirrhotic | AMPK signaling pathway | 49/2530 | 121/8465 | 7.90e-03 | 2.74e-02 | 1.69e-02 | 49 |
| hsa042118 | Liver | Cirrhotic | Longevity regulating pathway | 37/2530 | 89/8465 | 1.22e-02 | 3.89e-02 | 2.40e-02 | 37 |
| Page: 1 2 3 |
Top |
Cell-cell communication analysis |
| Identification of potential cell-cell interactions between two cell types and their ligand-receptor pairs for different disease states |
| Ligand | Receptor | LRpair | Pathway | Tissue | Disease Stage |
| Page: 1 |
Top |
Single-cell gene regulatory network inference analysis |
| Find out the significant the regulons (TFs) and the target genes of each regulon across cell types for different disease states |
| TF | Cell Type | Tissue | Disease Stage | Target Gene | RSS | Regulon Activity |
| ∗The dot plots of a searched regulon are shown for all cell subpopulations in each disease state of each tissue based on the regulon specific score inferred using pySCENIC and by calculating the average expression. |
| Page: 1 |
Top |
Somatic mutation of malignant transformation related genes |
| Annotation of somatic variants for genes involved in malignant transformation |
| Hugo Symbol | Variant Class | Variant Classification | dbSNP RS | HGVSc | HGVSp | HGVSp Short | SWISSPROT | BIOTYPE | SIFT | PolyPhen | Tumor Sample Barcode | Tissue | Histology | Sex | Age | Stage | Therapy Types | Drugs | Outcome |
| ADIPOR1 | SNV | Missense_Mutation | novel | c.824N>A | p.Gly275Asp | p.G275D | Q96A54 | protein_coding | deleterious(0) | probably_damaging(1) | TCGA-A6-2672-01 | Colorectum | colon adenocarcinoma | Female | >=65 | III/IV | Unknown | Unknown | SD |
| ADIPOR1 | SNV | Missense_Mutation | c.167T>C | p.Val56Ala | p.V56A | Q96A54 | protein_coding | tolerated(0.89) | benign(0) | TCGA-AD-6964-01 | Colorectum | colon adenocarcinoma | Male | <65 | III/IV | Chemotherapy | folfox | PD | |
| ADIPOR1 | SNV | Missense_Mutation | novel | c.559N>C | p.Ser187Pro | p.S187P | Q96A54 | protein_coding | deleterious(0) | probably_damaging(1) | TCGA-A5-A1OH-01 | Endometrium | uterine corpus endometrioid carcinoma | Female | >=65 | III/IV | Chemotherapy | carboplatin | CR |
| ADIPOR1 | SNV | Missense_Mutation | novel | c.648T>G | p.Ile216Met | p.I216M | Q96A54 | protein_coding | deleterious(0.04) | possibly_damaging(0.706) | TCGA-AJ-A3EK-01 | Endometrium | uterine corpus endometrioid carcinoma | Female | <65 | I/II | Chemotherapy | carboplatin | CR |
| ADIPOR1 | SNV | Missense_Mutation | c.296T>C | p.Val99Ala | p.V99A | Q96A54 | protein_coding | tolerated(0.52) | benign(0) | TCGA-AP-A051-01 | Endometrium | uterine corpus endometrioid carcinoma | Female | >=65 | I/II | Unknown | Unknown | SD | |
| ADIPOR1 | SNV | Missense_Mutation | novel | c.605G>A | p.Arg202Gln | p.R202Q | Q96A54 | protein_coding | tolerated(0.09) | benign(0.025) | TCGA-AP-A056-01 | Endometrium | uterine corpus endometrioid carcinoma | Female | <65 | I/II | Unknown | Unknown | SD |
| ADIPOR1 | SNV | Missense_Mutation | novel | c.677N>G | p.Tyr226Cys | p.Y226C | Q96A54 | protein_coding | deleterious(0) | probably_damaging(1) | TCGA-AP-A059-01 | Endometrium | uterine corpus endometrioid carcinoma | Female | >=65 | I/II | Unknown | Unknown | SD |
| ADIPOR1 | SNV | Missense_Mutation | novel | c.493N>T | p.Ala165Ser | p.A165S | Q96A54 | protein_coding | tolerated(0.19) | benign(0.199) | TCGA-AX-A06F-01 | Endometrium | uterine corpus endometrioid carcinoma | Female | <65 | III/IV | Chemotherapy | carboplatin | SD |
| ADIPOR1 | SNV | Missense_Mutation | novel | c.226G>A | p.Ala76Thr | p.A76T | Q96A54 | protein_coding | tolerated(0.08) | possibly_damaging(0.701) | TCGA-AX-A1CE-01 | Endometrium | uterine corpus endometrioid carcinoma | Female | <65 | I/II | Unspecific | Paclitaxel | SD |
| ADIPOR1 | SNV | Missense_Mutation | novel | c.797C>T | p.Thr266Ile | p.T266I | Q96A54 | protein_coding | tolerated(0.38) | benign(0.017) | TCGA-AX-A2HD-01 | Endometrium | uterine corpus endometrioid carcinoma | Female | >=65 | III/IV | Unknown | Unknown | SD |
| Page: 1 2 3 4 |
Top |
Related drugs of malignant transformation related genes |
| Identification of chemicals and drugs interact with genes involved in malignant transfromation |
| (DGIdb 4.0) |
| Entrez ID | Symbol | Category | Interaction Types | Drug Claim Name | Drug Name | PMIDs |
| Page: 1 |

Copyright 2023-Present -The University of Texas Health Science Center at Houston |