
|
|||||
|
 | |
| |
| |
| |
| |
| |
|
Gene: ADI1 |
Gene summary for ADI1 |
| Gene information | Species | Human | Gene symbol | ADI1 | Gene ID | 55256 |
| Gene name | acireductone dioxygenase 1 | |
| Gene Alias | APL1 | |
| Cytomap | 2p25.3 | |
| Gene Type | protein-coding | GO ID | GO:0000096 | UniProtAcc | Q9BV57 |
Top |
Malignant transformation analysis |
| Identification of the aberrant gene expression in precancerous and cancerous lesions by comparing the gene expression of stem-like cells in diseased tissues with normal stem cells |
| Entrez ID | Symbol | Replicates | Species | Organ | Tissue | Adj P-value | Log2FC | Malignancy |
| 55256 | ADI1 | GSM4909282 | Human | Breast | IDC | 1.24e-09 | 3.53e-01 | -0.0288 |
| 55256 | ADI1 | GSM4909285 | Human | Breast | IDC | 3.90e-19 | 5.11e-01 | 0.21 |
| 55256 | ADI1 | GSM4909286 | Human | Breast | IDC | 1.96e-03 | 8.66e-02 | 0.1081 |
| 55256 | ADI1 | GSM4909287 | Human | Breast | IDC | 4.56e-02 | 2.52e-01 | 0.2057 |
| 55256 | ADI1 | GSM4909290 | Human | Breast | IDC | 1.26e-11 | 4.83e-01 | 0.2096 |
| 55256 | ADI1 | GSM4909294 | Human | Breast | IDC | 2.08e-02 | 2.88e-01 | 0.2022 |
| 55256 | ADI1 | GSM4909296 | Human | Breast | IDC | 3.35e-03 | -1.05e-01 | 0.1524 |
| 55256 | ADI1 | GSM4909297 | Human | Breast | IDC | 1.01e-07 | -1.37e-01 | 0.1517 |
| 55256 | ADI1 | GSM4909311 | Human | Breast | IDC | 4.72e-14 | -2.28e-01 | 0.1534 |
| 55256 | ADI1 | GSM4909312 | Human | Breast | IDC | 1.83e-08 | -1.56e-01 | 0.1552 |
| 55256 | ADI1 | GSM4909316 | Human | Breast | IDC | 1.69e-07 | 4.08e-01 | 0.21 |
| 55256 | ADI1 | GSM4909319 | Human | Breast | IDC | 8.38e-23 | -1.66e-01 | 0.1563 |
| 55256 | ADI1 | GSM4909321 | Human | Breast | IDC | 6.03e-09 | 1.46e-01 | 0.1559 |
| 55256 | ADI1 | brca10 | Human | Breast | Precancer | 6.32e-03 | -2.57e-01 | -0.0029 |
| 55256 | ADI1 | M2 | Human | Breast | IDC | 6.24e-08 | 4.79e-01 | 0.21 |
| 55256 | ADI1 | M5 | Human | Breast | IDC | 1.10e-04 | 5.62e-01 | 0.1598 |
| 55256 | ADI1 | NCCBC14 | Human | Breast | DCIS | 4.20e-04 | 7.62e-02 | 0.2021 |
| 55256 | ADI1 | NCCBC5 | Human | Breast | DCIS | 1.57e-08 | -1.32e-01 | 0.2046 |
| 55256 | ADI1 | P1 | Human | Breast | IDC | 1.01e-06 | -2.41e-01 | 0.1527 |
| 55256 | ADI1 | DCIS2 | Human | Breast | DCIS | 4.15e-65 | 4.57e-01 | 0.0085 |
| Page: 1 2 3 4 5 6 7 8 9 10 |
| Tissue | Expression Dynamics | Abbreviation |
| Breast |  | IDC: Invasive ductal carcinoma |
| DCIS: Ductal carcinoma in situ | ||
| Precancer(BRCA1-mut): Precancerous lesion from BRCA1 mutation carriers | ||
| Colorectum (GSE201348) |  | FAP: Familial adenomatous polyposis |
| CRC: Colorectal cancer | ||
| Colorectum (HTA11) |  | AD: Adenomas |
| SER: Sessile serrated lesions | ||
| MSI-H: Microsatellite-high colorectal cancer | ||
| MSS: Microsatellite stable colorectal cancer | ||
| Endometrium | 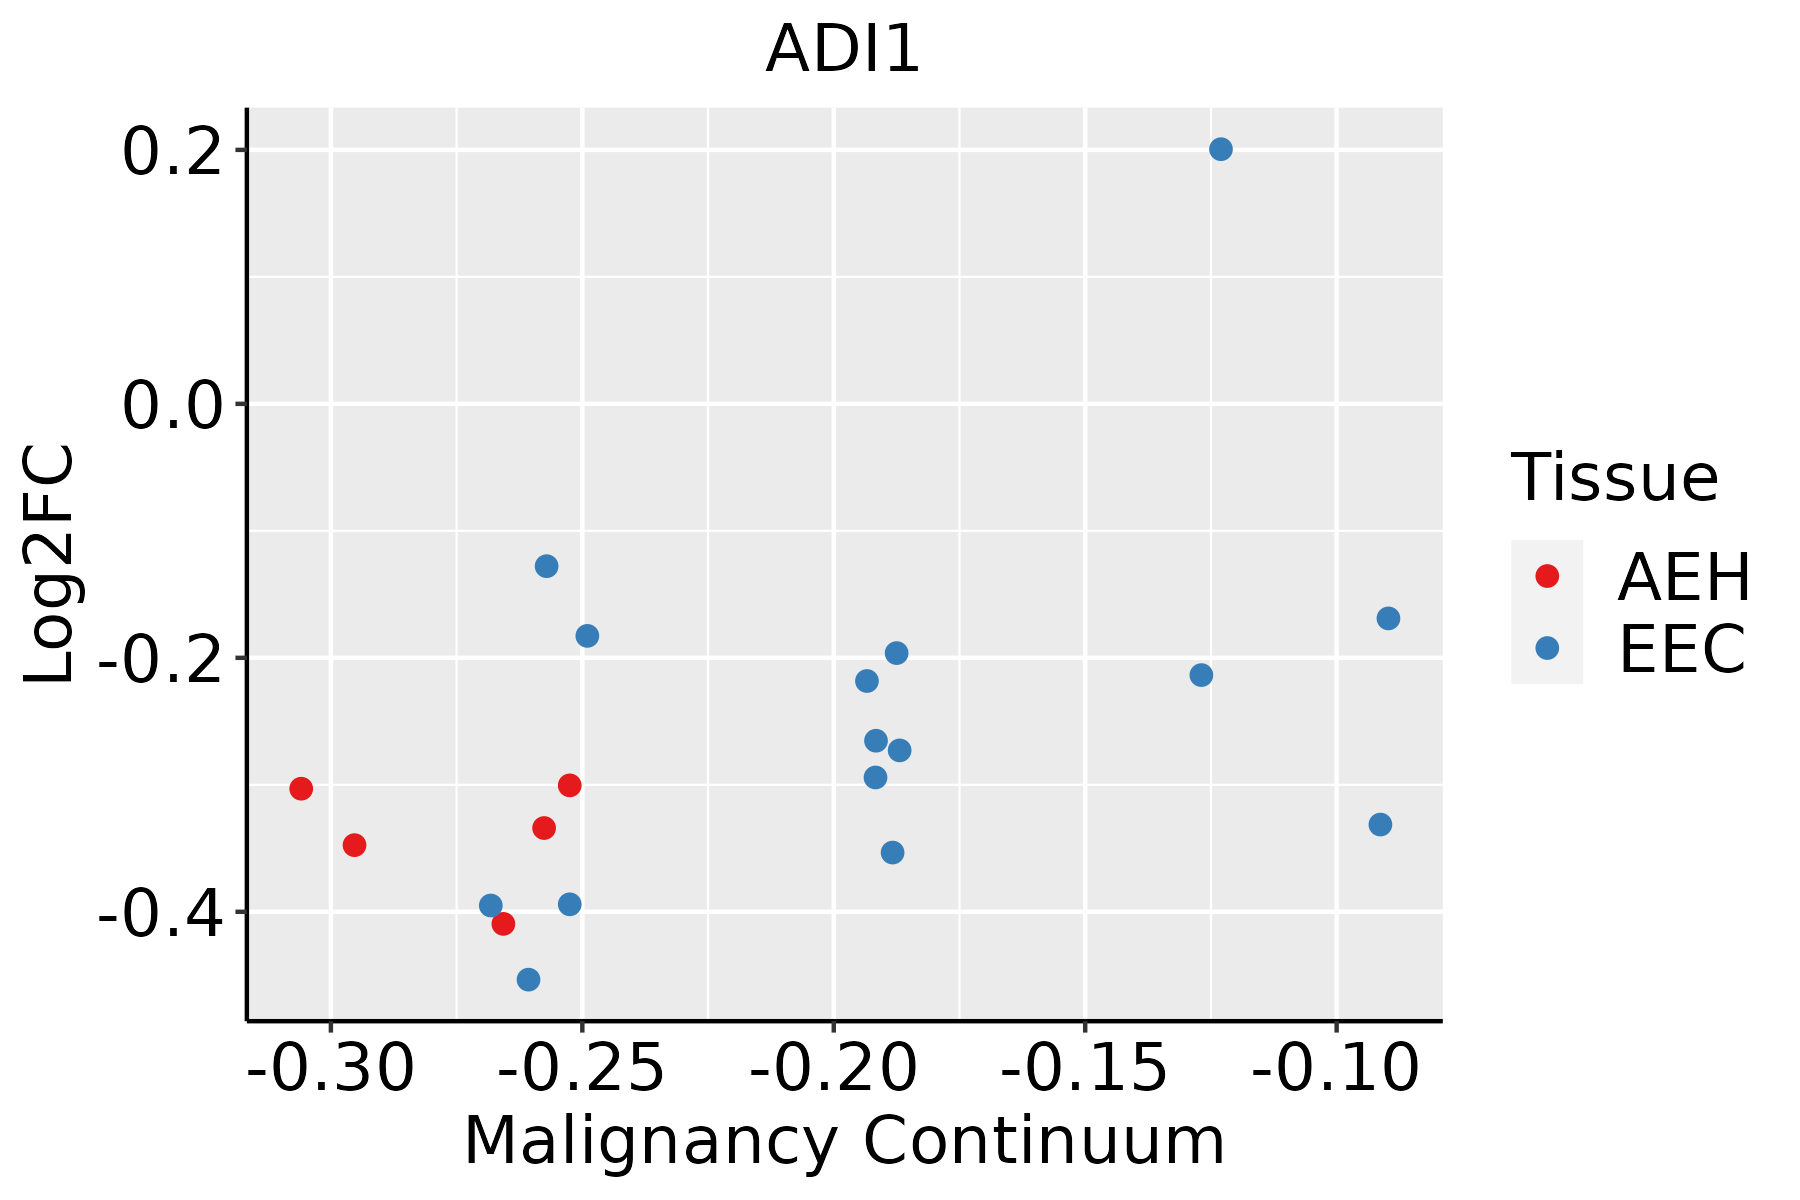 | AEH: Atypical endometrial hyperplasia |
| EEC: Endometrioid Cancer | ||
| Esophagus |  | ESCC: Esophageal squamous cell carcinoma |
| HGIN: High-grade intraepithelial neoplasias | ||
| LGIN: Low-grade intraepithelial neoplasias | ||
| Liver | 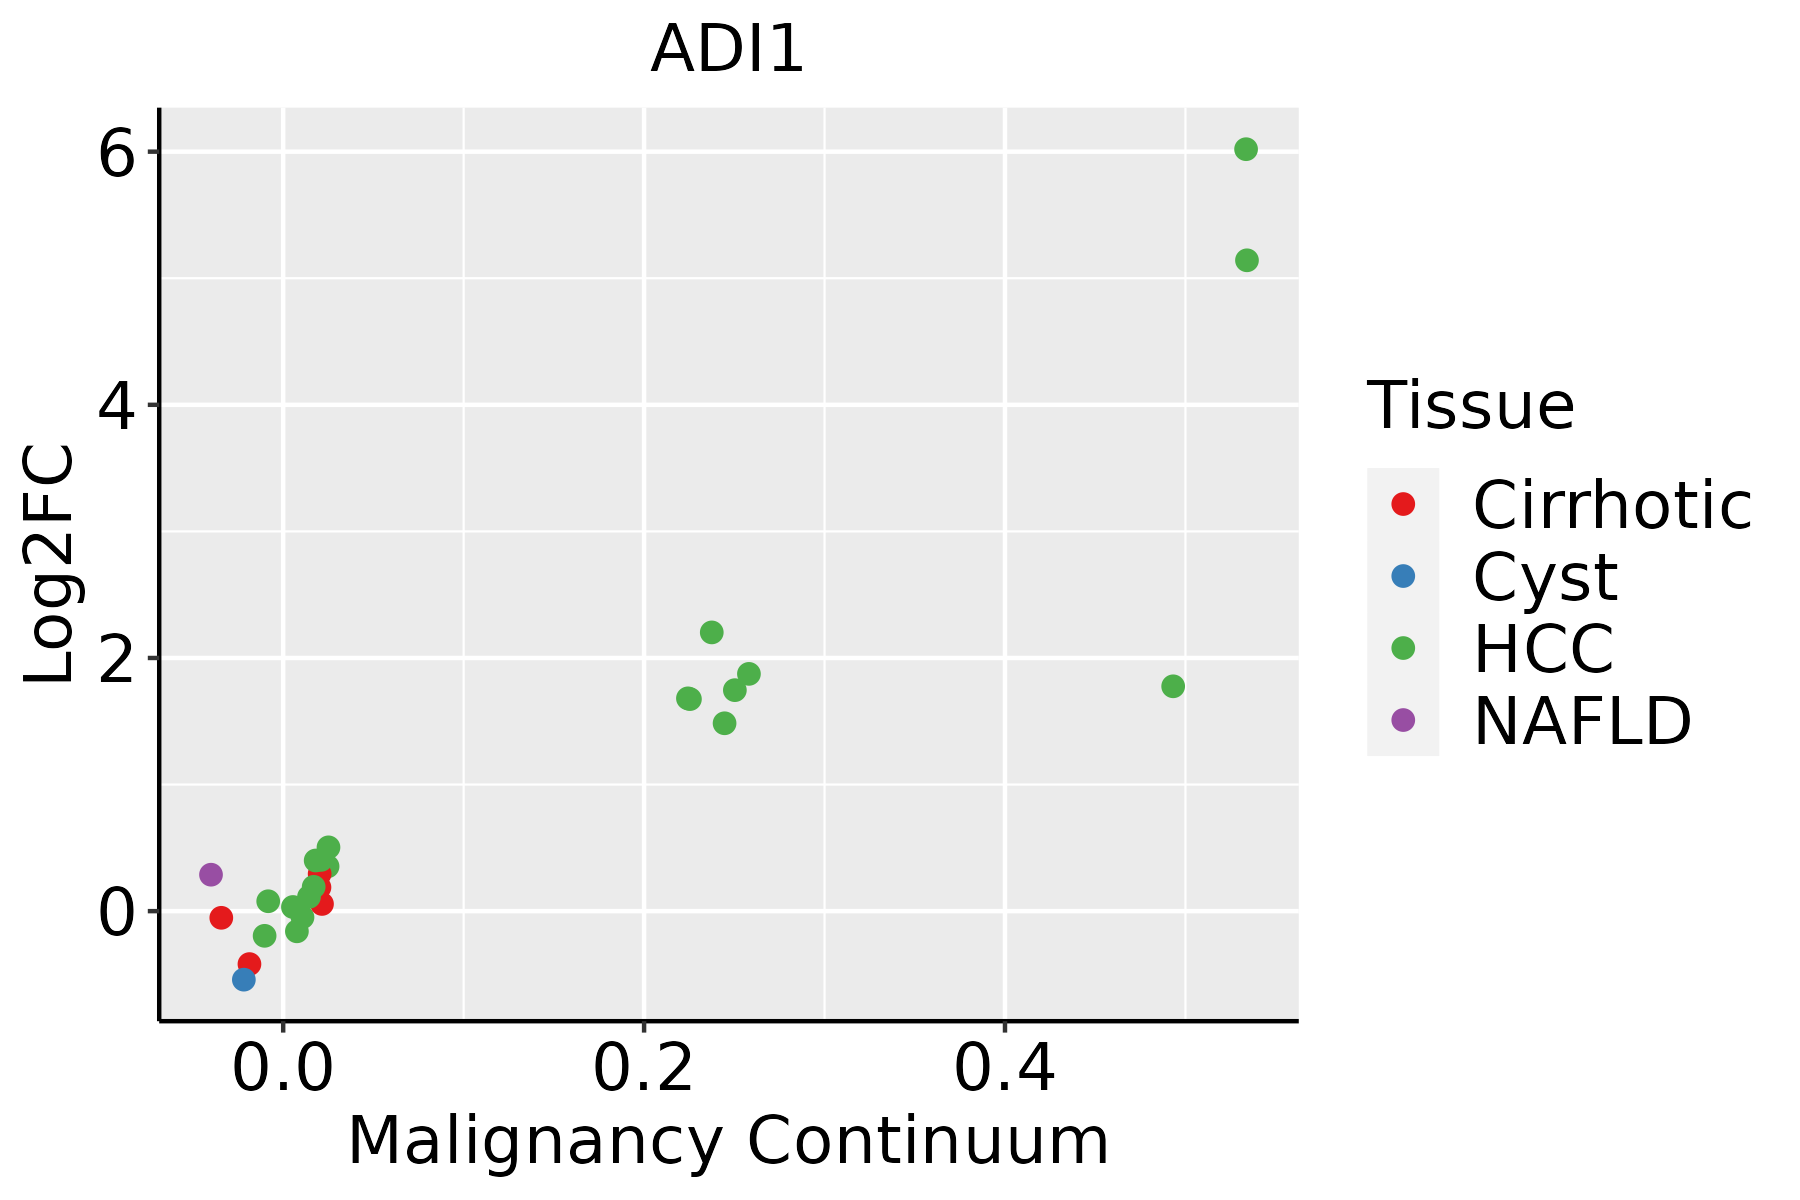 | HCC: Hepatocellular carcinoma |
| NAFLD: Non-alcoholic fatty liver disease | ||
| Oral Cavity | 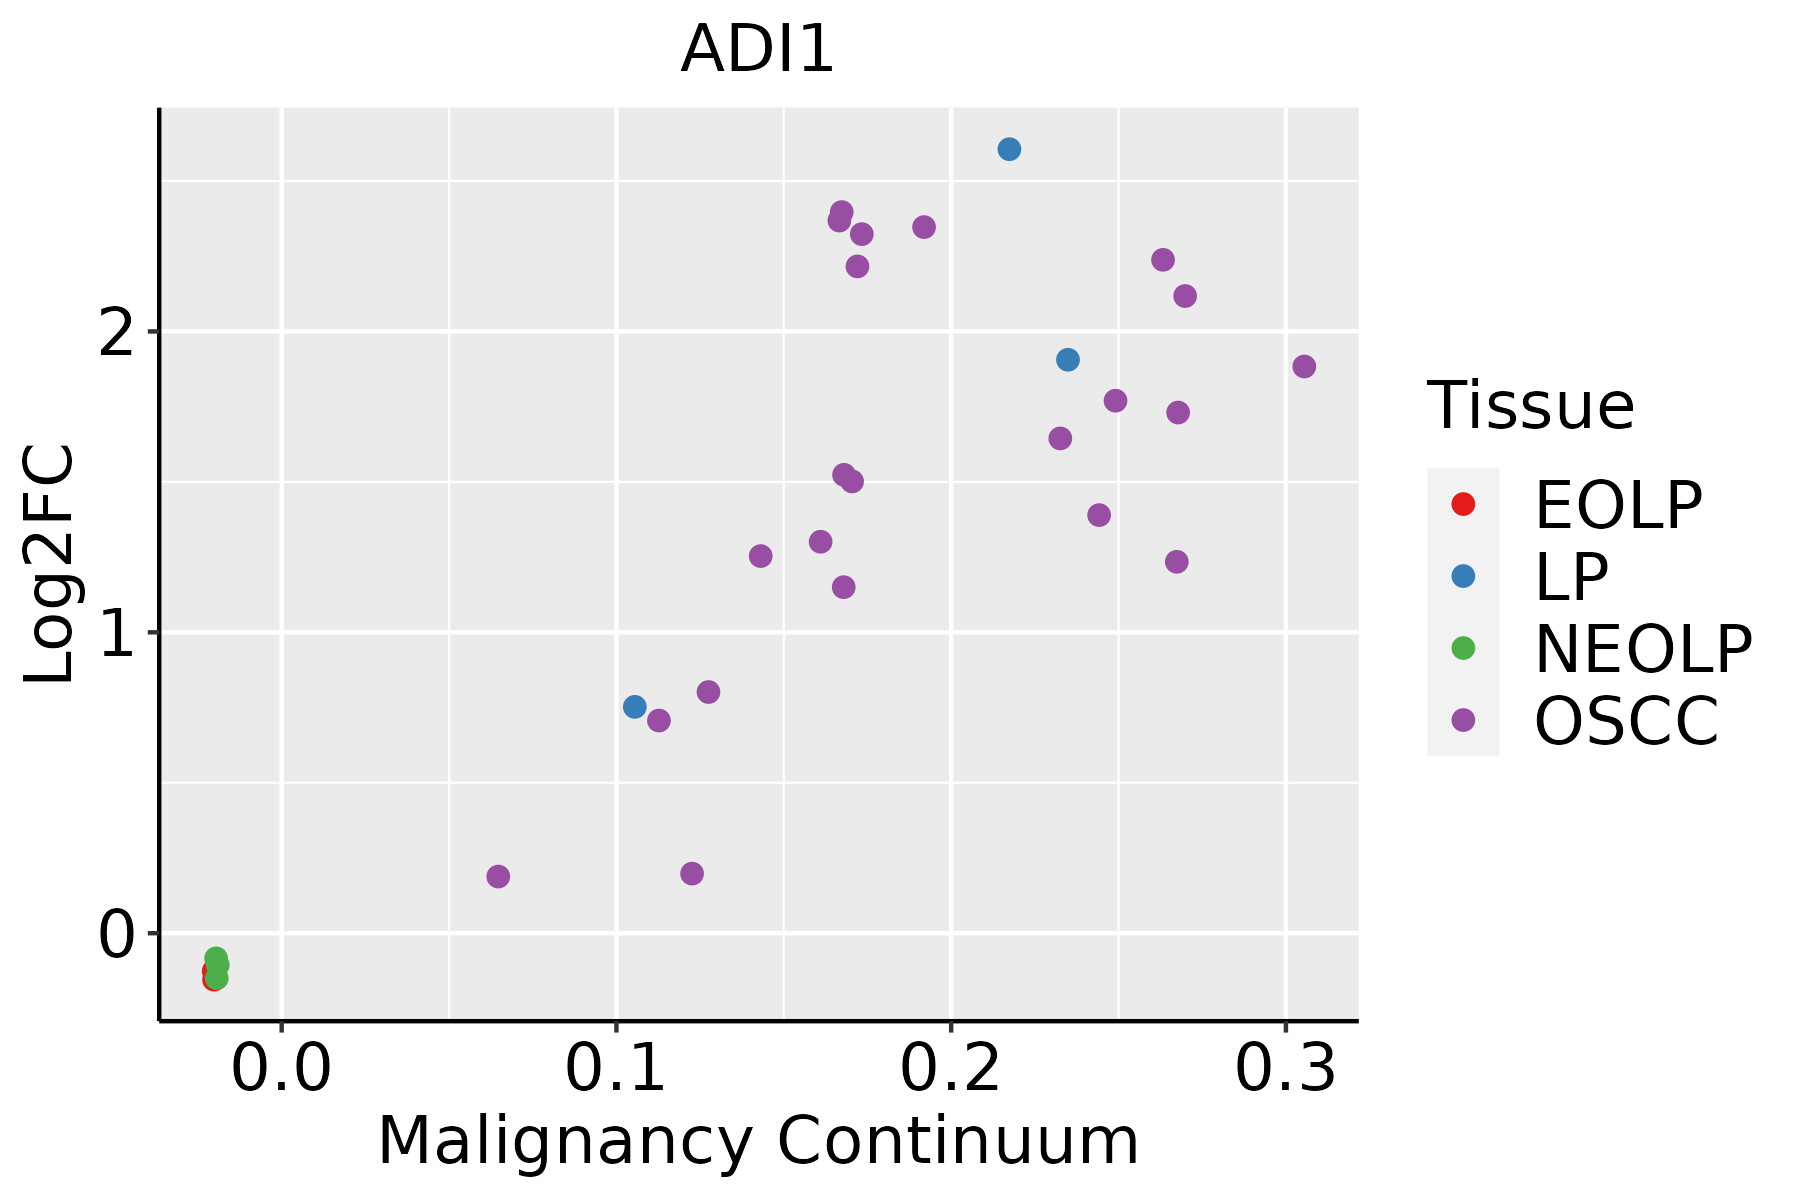 | EOLP: Erosive Oral lichen planus |
| LP: leukoplakia | ||
| NEOLP: Non-erosive oral lichen planus | ||
| OSCC: Oral squamous cell carcinoma | ||
| Prostate | 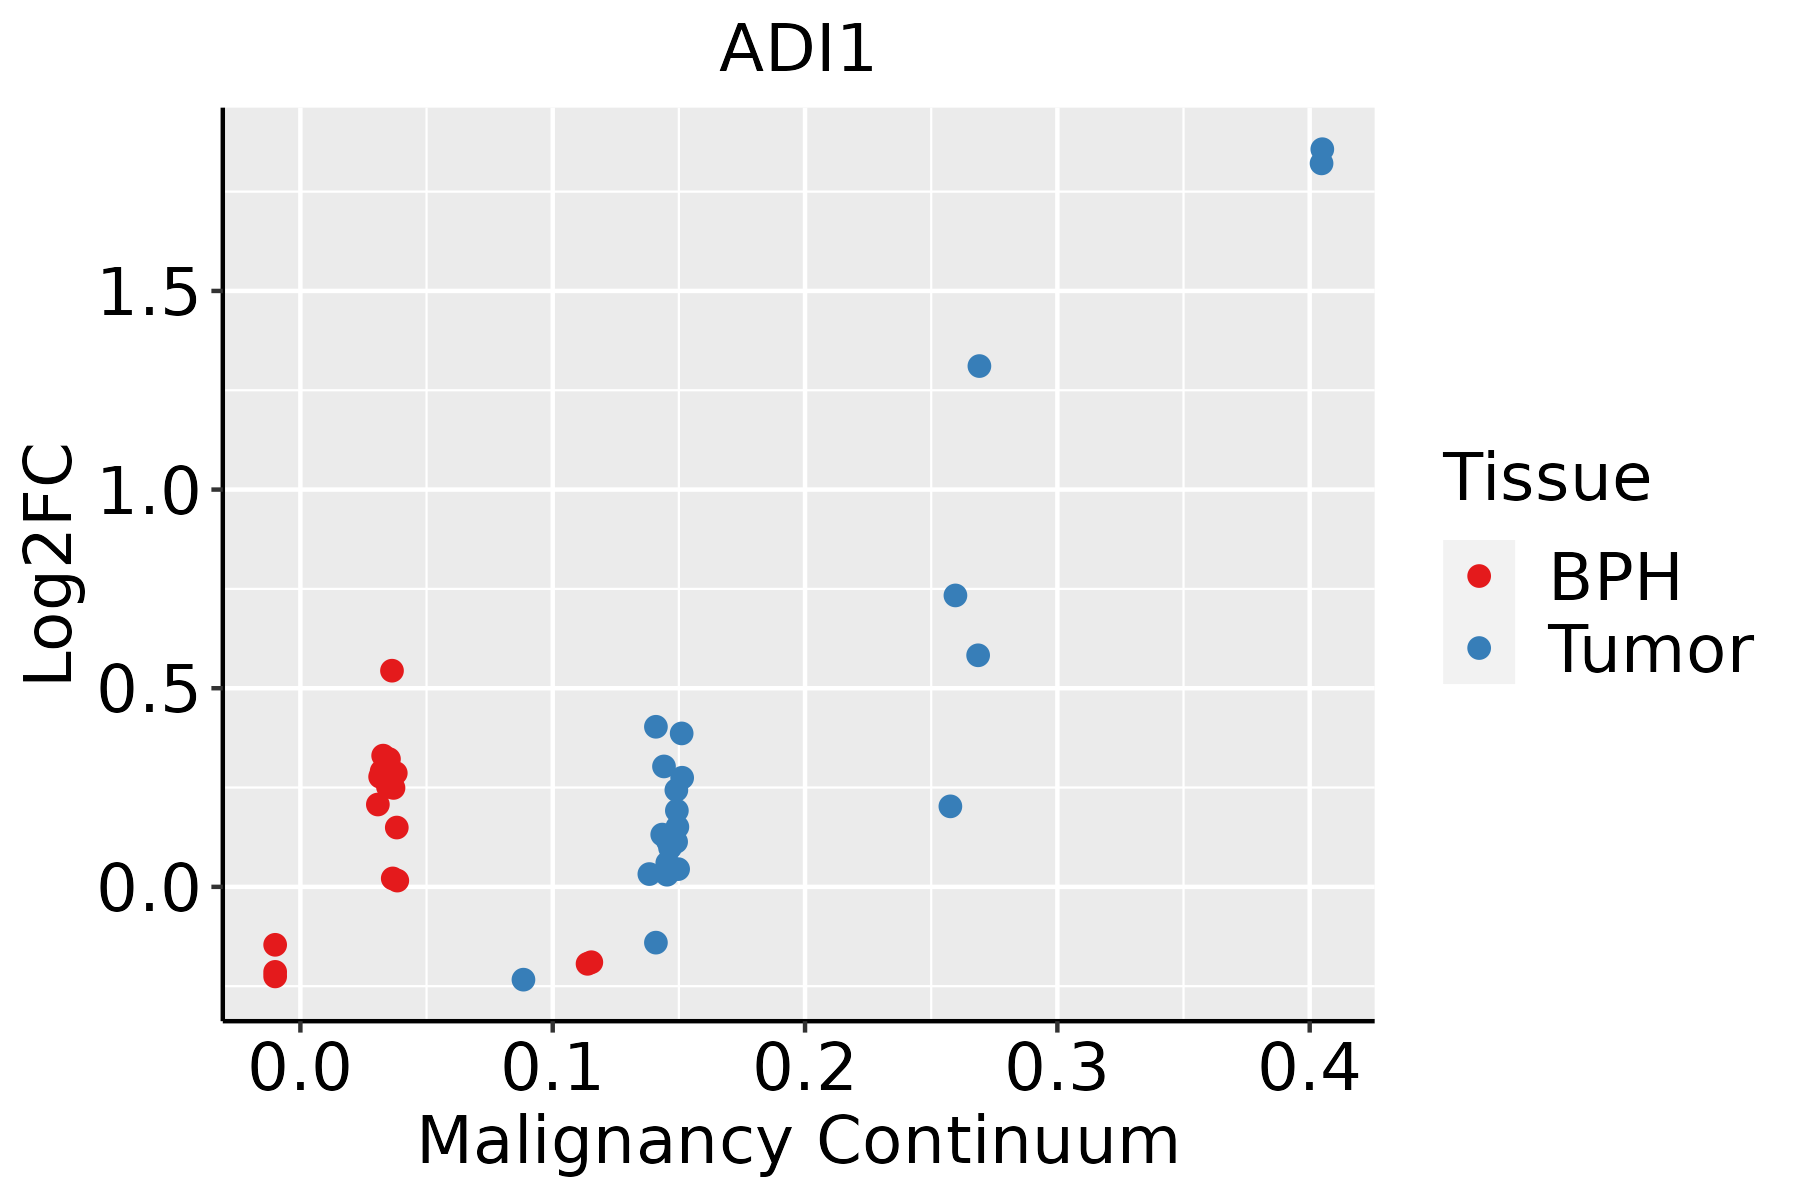 | BPH: Benign Prostatic Hyperplasia |
| Skin | 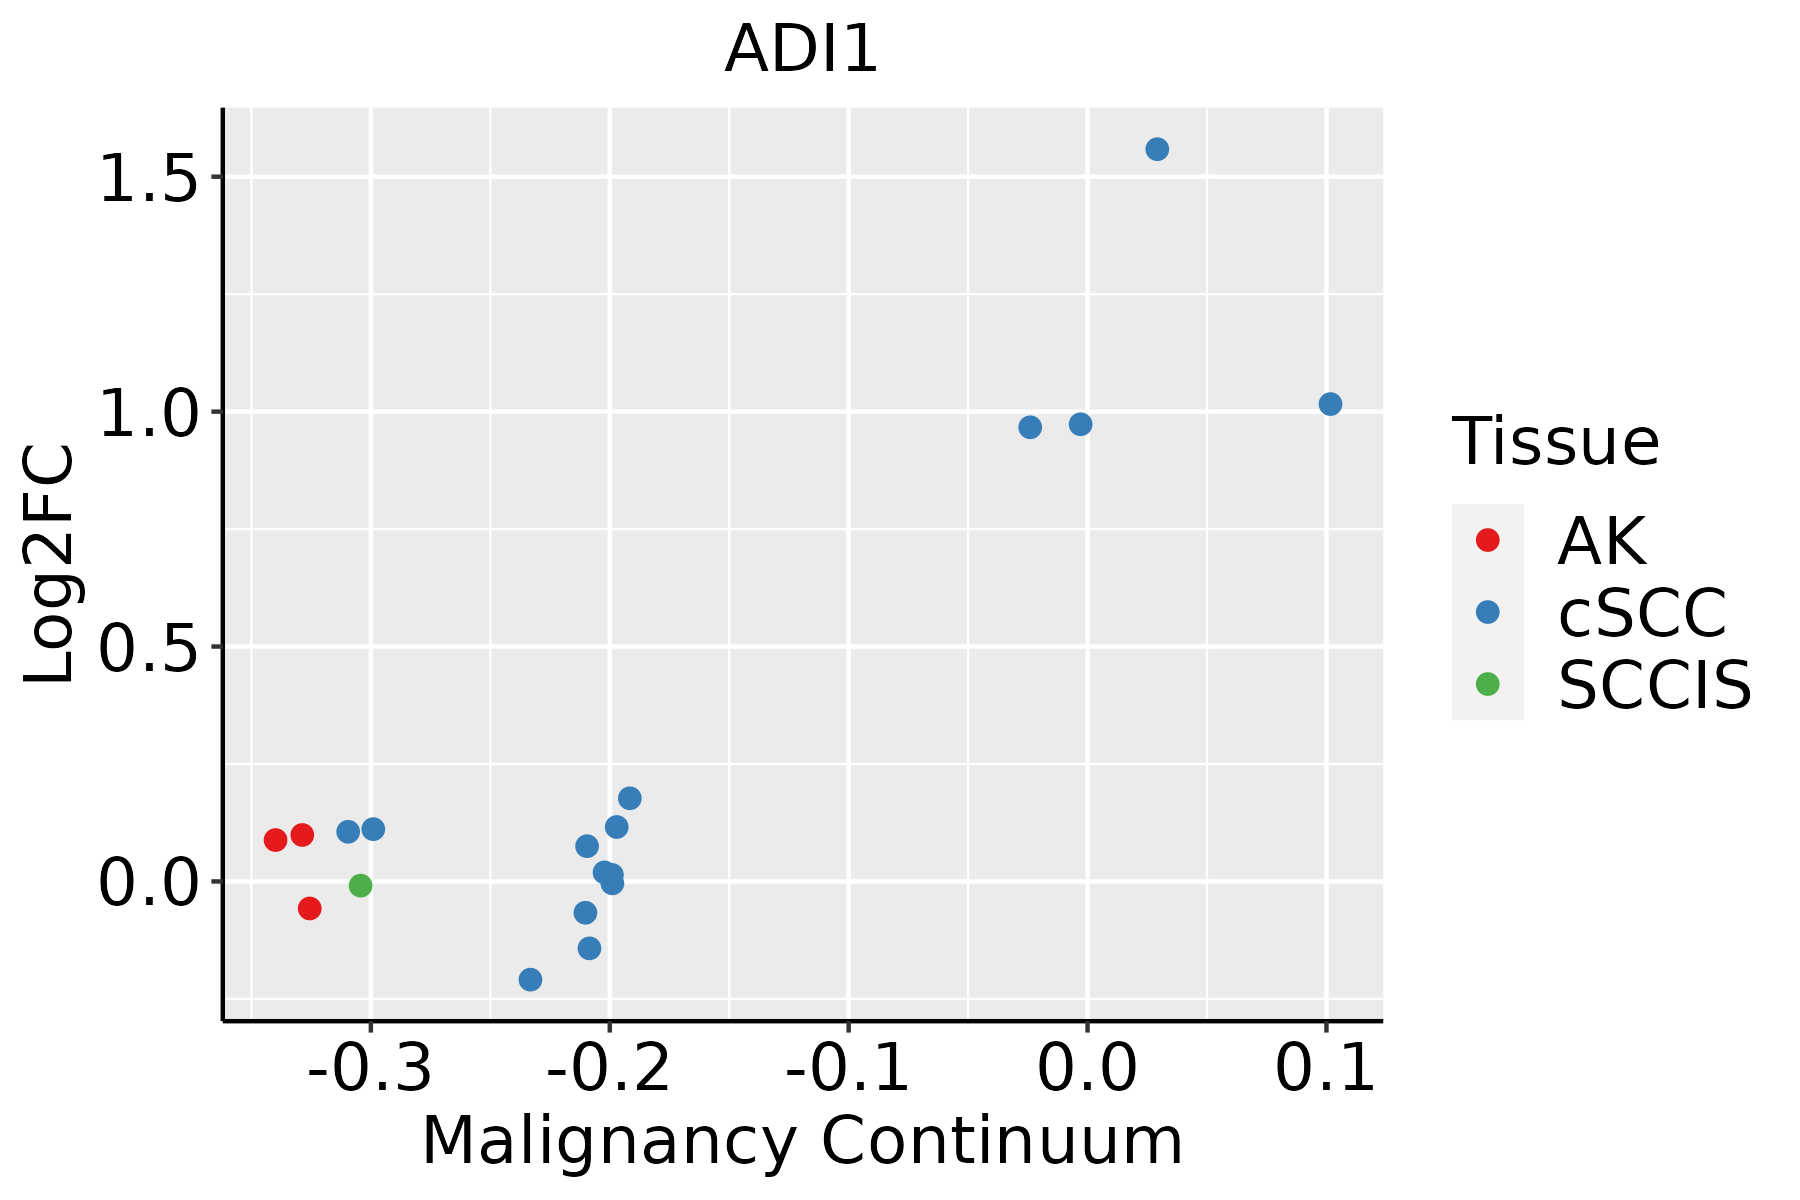 | AK: Actinic keratosis |
| cSCC: Cutaneous squamous cell carcinoma | ||
| SCCIS:squamous cell carcinoma in situ | ||
| Thyroid |  | ATC: Anaplastic thyroid cancer |
| HT: Hashimoto's thyroiditis | ||
| PTC: Papillary thyroid cancer |
| ∗log2FC in expression of this searched gene in stem-like cells from each diseased tissue sample relative to stem-like cells in normal samples in each tissue plotted against the malignancy continuum. Samples are colored based on if they are from different disease stage. |
Top |
Malignant transformation related pathway analysis |
| Find out the enriched GO biological processes and KEGG pathways involved in transition from healthy to precancer to cancer |
| Tissue | Disease Stage | Enriched GO biological Processes |
| Colorectum | AD |  |
| Colorectum | SER |  |
| Colorectum | MSS |  |
| Colorectum | MSI-H |  |
| Colorectum | FAP |  |
| ∗Top 15 enriched GO BP terms are showed in the bar plot of each disease state in each tissue. Each row represents a significant GO biological process which is colored according to the -log10(p.adjust). |
| Page: 1 2 3 4 5 6 7 8 9 |
| GO ID | Tissue | Disease Stage | Description | Gene Ratio | Bg Ratio | pvalue | p.adjust | Count |
| GO:00463946 | Breast | Precancer | carboxylic acid biosynthetic process | 32/1080 | 314/18723 | 1.30e-03 | 1.38e-02 | 32 |
| GO:00160536 | Breast | Precancer | organic acid biosynthetic process | 32/1080 | 316/18723 | 1.44e-03 | 1.50e-02 | 32 |
| GO:001605313 | Breast | IDC | organic acid biosynthetic process | 39/1434 | 316/18723 | 2.13e-03 | 1.99e-02 | 39 |
| GO:004639413 | Breast | IDC | carboxylic acid biosynthetic process | 38/1434 | 314/18723 | 3.39e-03 | 2.83e-02 | 38 |
| GO:001605322 | Breast | DCIS | organic acid biosynthetic process | 38/1390 | 316/18723 | 2.22e-03 | 2.04e-02 | 38 |
| GO:004639422 | Breast | DCIS | carboxylic acid biosynthetic process | 37/1390 | 314/18723 | 3.56e-03 | 2.92e-02 | 37 |
| GO:0006790 | Colorectum | AD | sulfur compound metabolic process | 101/3918 | 339/18723 | 6.46e-05 | 1.07e-03 | 101 |
| GO:0006520 | Colorectum | AD | cellular amino acid metabolic process | 81/3918 | 284/18723 | 1.37e-03 | 1.19e-02 | 81 |
| GO:00067901 | Colorectum | SER | sulfur compound metabolic process | 73/2897 | 339/18723 | 1.75e-03 | 1.81e-02 | 73 |
| GO:00065201 | Colorectum | SER | cellular amino acid metabolic process | 61/2897 | 284/18723 | 4.20e-03 | 3.41e-02 | 61 |
| GO:00067902 | Colorectum | MSS | sulfur compound metabolic process | 85/3467 | 339/18723 | 1.52e-03 | 1.39e-02 | 85 |
| GO:0046394 | Colorectum | MSS | carboxylic acid biosynthetic process | 76/3467 | 314/18723 | 6.71e-03 | 4.38e-02 | 76 |
| GO:0016053 | Colorectum | MSS | organic acid biosynthetic process | 76/3467 | 316/18723 | 7.88e-03 | 4.84e-02 | 76 |
| GO:1901605 | Colorectum | MSI-H | alpha-amino acid metabolic process | 26/1319 | 195/18723 | 1.26e-03 | 2.02e-02 | 26 |
| GO:0008652 | Colorectum | MSI-H | cellular amino acid biosynthetic process | 13/1319 | 76/18723 | 2.35e-03 | 3.12e-02 | 13 |
| GO:1901607 | Colorectum | MSI-H | alpha-amino acid biosynthetic process | 12/1319 | 68/18723 | 2.60e-03 | 3.41e-02 | 12 |
| GO:00463941 | Colorectum | MSI-H | carboxylic acid biosynthetic process | 36/1319 | 314/18723 | 2.68e-03 | 3.48e-02 | 36 |
| GO:00160531 | Colorectum | MSI-H | organic acid biosynthetic process | 36/1319 | 316/18723 | 2.98e-03 | 3.78e-02 | 36 |
| GO:00067906 | Esophagus | ESCC | sulfur compound metabolic process | 201/8552 | 339/18723 | 2.64e-07 | 3.94e-06 | 201 |
| GO:00442725 | Esophagus | ESCC | sulfur compound biosynthetic process | 96/8552 | 148/18723 | 1.86e-06 | 2.16e-05 | 96 |
| Page: 1 2 3 4 5 |
| Pathway ID | Tissue | Disease Stage | Description | Gene Ratio | Bg Ratio | pvalue | p.adjust | qvalue | Count |
| hsa00270 | Liver | Cirrhotic | Cysteine and methionine metabolism | 27/2530 | 52/8465 | 6.98e-04 | 4.15e-03 | 2.56e-03 | 27 |
| hsa002701 | Liver | Cirrhotic | Cysteine and methionine metabolism | 27/2530 | 52/8465 | 6.98e-04 | 4.15e-03 | 2.56e-03 | 27 |
| hsa002702 | Liver | HCC | Cysteine and methionine metabolism | 35/4020 | 52/8465 | 3.03e-03 | 9.94e-03 | 5.53e-03 | 35 |
| hsa002703 | Liver | HCC | Cysteine and methionine metabolism | 35/4020 | 52/8465 | 3.03e-03 | 9.94e-03 | 5.53e-03 | 35 |
| Page: 1 |
Top |
Cell-cell communication analysis |
| Identification of potential cell-cell interactions between two cell types and their ligand-receptor pairs for different disease states |
| Ligand | Receptor | LRpair | Pathway | Tissue | Disease Stage |
| Page: 1 |
Top |
Single-cell gene regulatory network inference analysis |
| Find out the significant the regulons (TFs) and the target genes of each regulon across cell types for different disease states |
| TF | Cell Type | Tissue | Disease Stage | Target Gene | RSS | Regulon Activity |
| ∗The dot plots of a searched regulon are shown for all cell subpopulations in each disease state of each tissue based on the regulon specific score inferred using pySCENIC and by calculating the average expression. |
| Page: 1 |
Top |
Somatic mutation of malignant transformation related genes |
| Annotation of somatic variants for genes involved in malignant transformation |
| Hugo Symbol | Variant Class | Variant Classification | dbSNP RS | HGVSc | HGVSp | HGVSp Short | SWISSPROT | BIOTYPE | SIFT | PolyPhen | Tumor Sample Barcode | Tissue | Histology | Sex | Age | Stage | Therapy Types | Drugs | Outcome |
| ADI1 | deletion | Frame_Shift_Del | novel | c.342delN | p.Trp114Ter | p.W114* | Q9BV57 | protein_coding | TCGA-EW-A2FV-01 | Breast | breast invasive carcinoma | Female | <65 | III/IV | Chemotherapy | docetaxel | SD | ||
| ADI1 | SNV | Missense_Mutation | c.425N>G | p.Tyr142Cys | p.Y142C | Q9BV57 | protein_coding | deleterious(0) | probably_damaging(0.999) | TCGA-AA-3851-01 | Colorectum | colon adenocarcinoma | Male | >=65 | I/II | Unknown | Unknown | SD | |
| ADI1 | SNV | Missense_Mutation | rs772279164 | c.503G>A | p.Arg168His | p.R168H | Q9BV57 | protein_coding | deleterious(0) | probably_damaging(0.988) | TCGA-CM-6171-01 | Colorectum | colon adenocarcinoma | Female | >=65 | I/II | Unknown | Unknown | SD |
| ADI1 | SNV | Missense_Mutation | novel | c.274G>T | p.Asp92Tyr | p.D92Y | Q9BV57 | protein_coding | deleterious(0.01) | probably_damaging(0.984) | TCGA-AG-A032-01 | Colorectum | rectum adenocarcinoma | Male | >=65 | III/IV | Targeted Molecular therapy | bevacizumab | PD |
| ADI1 | SNV | Missense_Mutation | novel | c.125N>G | p.Asp42Gly | p.D42G | Q9BV57 | protein_coding | deleterious(0.01) | possibly_damaging(0.732) | TCGA-AJ-A3EL-01 | Endometrium | uterine corpus endometrioid carcinoma | Female | <65 | I/II | Unknown | Unknown | SD |
| ADI1 | SNV | Missense_Mutation | rs754050453 | c.400N>T | p.Arg134Cys | p.R134C | Q9BV57 | protein_coding | deleterious(0.02) | probably_damaging(0.932) | TCGA-AP-A0LM-01 | Endometrium | uterine corpus endometrioid carcinoma | Female | <65 | III/IV | Chemotherapy | cisplatin | SD |
| ADI1 | SNV | Missense_Mutation | novel | c.472N>C | p.Tyr158His | p.Y158H | Q9BV57 | protein_coding | tolerated(0.37) | benign(0.014) | TCGA-DI-A1BU-01 | Endometrium | uterine corpus endometrioid carcinoma | Female | <65 | I/II | Chemotherapy | paclitaxel | SD |
| ADI1 | SNV | Missense_Mutation | rs764517683 | c.347G>A | p.Arg116Gln | p.R116Q | Q9BV57 | protein_coding | deleterious(0.04) | possibly_damaging(0.726) | TCGA-EO-A22R-01 | Endometrium | uterine corpus endometrioid carcinoma | Female | <65 | I/II | Unknown | Unknown | SD |
| ADI1 | SNV | Missense_Mutation | novel | c.226A>C | p.Asn76His | p.N76H | Q9BV57 | protein_coding | deleterious(0) | probably_damaging(0.987) | TCGA-EO-A3B0-01 | Endometrium | uterine corpus endometrioid carcinoma | Female | <65 | III/IV | Unknown | Unknown | SD |
| ADI1 | SNV | Missense_Mutation | c.287G>T | p.Arg96Leu | p.R96L | Q9BV57 | protein_coding | deleterious(0) | possibly_damaging(0.891) | TCGA-DD-A3A8-01 | Liver | liver hepatocellular carcinoma | Male | >=65 | I/II | Unknown | Unknown | SD |
| Page: 1 2 |
Top |
Related drugs of malignant transformation related genes |
| Identification of chemicals and drugs interact with genes involved in malignant transfromation |
| (DGIdb 4.0) |
| Entrez ID | Symbol | Category | Interaction Types | Drug Claim Name | Drug Name | PMIDs |
| Page: 1 |

Copyright 2023-Present -The University of Texas Health Science Center at Houston |