
|
|||||
|
 | |
| |
| |
| |
| |
| |
|
Gene: ADH7 |
Gene summary for ADH7 |
| Gene information | Species | Human | Gene symbol | ADH7 | Gene ID | 131 |
| Gene name | alcohol dehydrogenase 7 (class IV), mu or sigma polypeptide | |
| Gene Alias | ADH4 | |
| Cytomap | 4q23 | |
| Gene Type | protein-coding | GO ID | GO:0001523 | UniProtAcc | P40394 |
Top |
Malignant transformation analysis |
| Identification of the aberrant gene expression in precancerous and cancerous lesions by comparing the gene expression of stem-like cells in diseased tissues with normal stem cells |
| Entrez ID | Symbol | Replicates | Species | Organ | Tissue | Adj P-value | Log2FC | Malignancy |
| 131 | ADH7 | LZE2T | Human | Esophagus | ESCC | 4.72e-19 | 1.33e+00 | 0.082 |
| 131 | ADH7 | LZE4T | Human | Esophagus | ESCC | 4.75e-36 | 1.41e+00 | 0.0811 |
| 131 | ADH7 | LZE7T | Human | Esophagus | ESCC | 1.65e-15 | 9.80e-01 | 0.0667 |
| 131 | ADH7 | LZE8T | Human | Esophagus | ESCC | 1.27e-03 | 2.76e-01 | 0.067 |
| 131 | ADH7 | LZE20T | Human | Esophagus | ESCC | 3.81e-04 | 2.81e-01 | 0.0662 |
| 131 | ADH7 | LZE21D1 | Human | Esophagus | HGIN | 1.61e-07 | 9.90e-01 | 0.0632 |
| 131 | ADH7 | LZE22D1 | Human | Esophagus | HGIN | 1.66e-02 | 1.88e-01 | 0.0595 |
| 131 | ADH7 | LZE24T | Human | Esophagus | ESCC | 1.32e-15 | 5.20e-01 | 0.0596 |
| 131 | ADH7 | LZE21T | Human | Esophagus | ESCC | 6.22e-15 | 1.23e+00 | 0.0655 |
| 131 | ADH7 | P4T-E | Human | Esophagus | ESCC | 9.64e-23 | 7.11e-01 | 0.1323 |
| 131 | ADH7 | P5T-E | Human | Esophagus | ESCC | 8.20e-04 | 1.15e-01 | 0.1327 |
| 131 | ADH7 | P8T-E | Human | Esophagus | ESCC | 1.18e-13 | 4.21e-01 | 0.0889 |
| 131 | ADH7 | P9T-E | Human | Esophagus | ESCC | 3.04e-59 | 1.37e+00 | 0.1131 |
| 131 | ADH7 | P12T-E | Human | Esophagus | ESCC | 4.84e-30 | 1.34e+00 | 0.1122 |
| 131 | ADH7 | P15T-E | Human | Esophagus | ESCC | 1.02e-58 | 1.62e+00 | 0.1149 |
| 131 | ADH7 | P20T-E | Human | Esophagus | ESCC | 1.02e-23 | 7.46e-01 | 0.1124 |
| 131 | ADH7 | P22T-E | Human | Esophagus | ESCC | 9.01e-09 | 1.99e-01 | 0.1236 |
| 131 | ADH7 | P23T-E | Human | Esophagus | ESCC | 6.49e-08 | 4.25e-01 | 0.108 |
| 131 | ADH7 | P26T-E | Human | Esophagus | ESCC | 2.20e-04 | 2.22e-01 | 0.1276 |
| 131 | ADH7 | P27T-E | Human | Esophagus | ESCC | 3.66e-42 | 1.10e+00 | 0.1055 |
| Page: 1 2 3 |
| Tissue | Expression Dynamics | Abbreviation |
| Esophagus | 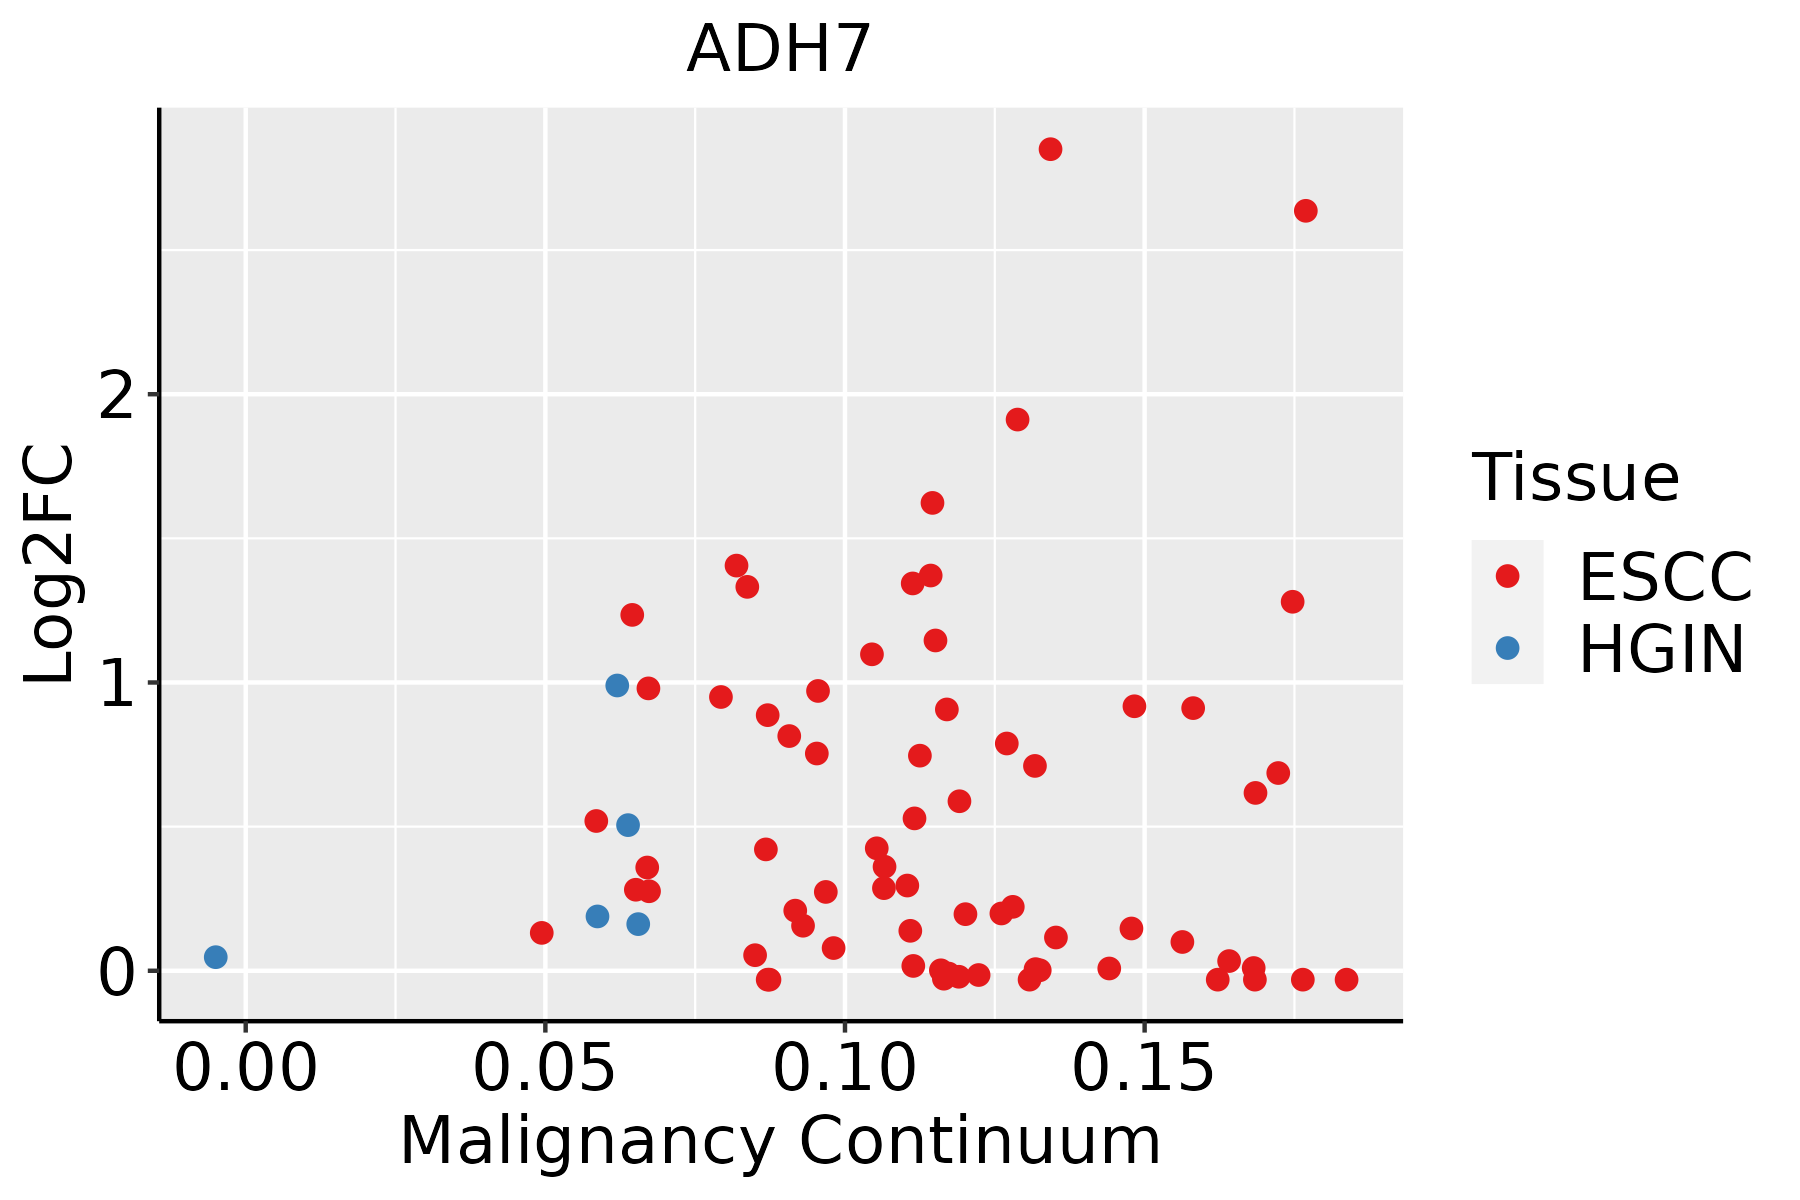 | ESCC: Esophageal squamous cell carcinoma |
| HGIN: High-grade intraepithelial neoplasias | ||
| LGIN: Low-grade intraepithelial neoplasias | ||
| Oral Cavity |  | EOLP: Erosive Oral lichen planus |
| LP: leukoplakia | ||
| NEOLP: Non-erosive oral lichen planus | ||
| OSCC: Oral squamous cell carcinoma |
| ∗log2FC in expression of this searched gene in stem-like cells from each diseased tissue sample relative to stem-like cells in normal samples in each tissue plotted against the malignancy continuum. Samples are colored based on if they are from different disease stage. |
Top |
Malignant transformation related pathway analysis |
| Find out the enriched GO biological processes and KEGG pathways involved in transition from healthy to precancer to cancer |
| Tissue | Disease Stage | Enriched GO biological Processes |
| Colorectum | AD |  |
| Colorectum | SER |  |
| Colorectum | MSS |  |
| Colorectum | MSI-H |  |
| Colorectum | FAP |  |
| ∗Top 15 enriched GO BP terms are showed in the bar plot of each disease state in each tissue. Each row represents a significant GO biological process which is colored according to the -log10(p.adjust). |
| Page: 1 2 3 4 5 6 7 8 9 |
| GO ID | Tissue | Disease Stage | Description | Gene Ratio | Bg Ratio | pvalue | p.adjust | Count |
| GO:000609120 | Esophagus | HGIN | generation of precursor metabolites and energy | 145/2587 | 490/18723 | 3.41e-20 | 2.04e-17 | 145 |
| GO:009730520 | Esophagus | HGIN | response to alcohol | 54/2587 | 253/18723 | 6.46e-04 | 8.87e-03 | 54 |
| GO:0006091110 | Esophagus | ESCC | generation of precursor metabolites and energy | 331/8552 | 490/18723 | 3.86e-23 | 8.45e-21 | 331 |
| GO:00060668 | Esophagus | ESCC | alcohol metabolic process | 202/8552 | 353/18723 | 7.32e-06 | 7.26e-05 | 202 |
| GO:00193958 | Esophagus | ESCC | fatty acid oxidation | 69/8552 | 103/18723 | 9.95e-06 | 9.44e-05 | 69 |
| GO:00344407 | Esophagus | ESCC | lipid oxidation | 71/8552 | 108/18723 | 2.00e-05 | 1.74e-04 | 71 |
| GO:00066318 | Esophagus | ESCC | fatty acid metabolic process | 217/8552 | 390/18723 | 4.21e-05 | 3.39e-04 | 217 |
| GO:0097305111 | Esophagus | ESCC | response to alcohol | 138/8552 | 253/18723 | 2.70e-03 | 1.14e-02 | 138 |
| GO:00302586 | Esophagus | ESCC | lipid modification | 116/8552 | 212/18723 | 4.90e-03 | 1.89e-02 | 116 |
| GO:000609118 | Oral cavity | OSCC | generation of precursor metabolites and energy | 286/7305 | 490/18723 | 1.45e-18 | 1.71e-16 | 286 |
| GO:00060667 | Oral cavity | OSCC | alcohol metabolic process | 179/7305 | 353/18723 | 4.54e-06 | 5.21e-05 | 179 |
| GO:009730519 | Oral cavity | OSCC | response to alcohol | 127/7305 | 253/18723 | 1.81e-04 | 1.24e-03 | 127 |
| GO:00066317 | Oral cavity | OSCC | fatty acid metabolic process | 186/7305 | 390/18723 | 2.65e-04 | 1.69e-03 | 186 |
| GO:00193957 | Oral cavity | OSCC | fatty acid oxidation | 57/7305 | 103/18723 | 5.58e-04 | 3.23e-03 | 57 |
| GO:00344406 | Oral cavity | OSCC | lipid oxidation | 59/7305 | 108/18723 | 7.01e-04 | 3.89e-03 | 59 |
| GO:00067203 | Oral cavity | OSCC | isoprenoid metabolic process | 59/7305 | 116/18723 | 6.18e-03 | 2.33e-02 | 59 |
| Page: 1 |
| Pathway ID | Tissue | Disease Stage | Description | Gene Ratio | Bg Ratio | pvalue | p.adjust | qvalue | Count |
| hsa0062010 | Esophagus | HGIN | Pyruvate metabolism | 16/1383 | 47/8465 | 2.27e-03 | 1.95e-02 | 1.55e-02 | 16 |
| hsa0062013 | Esophagus | HGIN | Pyruvate metabolism | 16/1383 | 47/8465 | 2.27e-03 | 1.95e-02 | 1.55e-02 | 16 |
| hsa0062023 | Esophagus | ESCC | Pyruvate metabolism | 32/4205 | 47/8465 | 8.11e-03 | 1.94e-02 | 9.94e-03 | 32 |
| hsa0001016 | Esophagus | ESCC | Glycolysis / Gluconeogenesis | 42/4205 | 67/8465 | 2.15e-02 | 4.78e-02 | 2.45e-02 | 42 |
| hsa0062033 | Esophagus | ESCC | Pyruvate metabolism | 32/4205 | 47/8465 | 8.11e-03 | 1.94e-02 | 9.94e-03 | 32 |
| hsa0001017 | Esophagus | ESCC | Glycolysis / Gluconeogenesis | 42/4205 | 67/8465 | 2.15e-02 | 4.78e-02 | 2.45e-02 | 42 |
| hsa049365 | Oral cavity | OSCC | Alcoholic liver disease | 78/3704 | 142/8465 | 4.53e-03 | 1.12e-02 | 5.68e-03 | 78 |
| hsa0493612 | Oral cavity | OSCC | Alcoholic liver disease | 78/3704 | 142/8465 | 4.53e-03 | 1.12e-02 | 5.68e-03 | 78 |
| Page: 1 |
Top |
Cell-cell communication analysis |
| Identification of potential cell-cell interactions between two cell types and their ligand-receptor pairs for different disease states |
| Ligand | Receptor | LRpair | Pathway | Tissue | Disease Stage |
| Page: 1 |
Top |
Single-cell gene regulatory network inference analysis |
| Find out the significant the regulons (TFs) and the target genes of each regulon across cell types for different disease states |
| TF | Cell Type | Tissue | Disease Stage | Target Gene | RSS | Regulon Activity |
| ∗The dot plots of a searched regulon are shown for all cell subpopulations in each disease state of each tissue based on the regulon specific score inferred using pySCENIC and by calculating the average expression. |
| Page: 1 |
Top |
Somatic mutation of malignant transformation related genes |
| Annotation of somatic variants for genes involved in malignant transformation |
| Hugo Symbol | Variant Class | Variant Classification | dbSNP RS | HGVSc | HGVSp | HGVSp Short | SWISSPROT | BIOTYPE | SIFT | PolyPhen | Tumor Sample Barcode | Tissue | Histology | Sex | Age | Stage | Therapy Types | Drugs | Outcome |
| ADH7 | SNV | Missense_Mutation | c.943N>T | p.Pro315Ser | p.P315S | P40394 | protein_coding | tolerated(0.17) | possibly_damaging(0.503) | TCGA-BH-A18M-01 | Breast | breast invasive carcinoma | Female | <65 | III/IV | Unknown | Unknown | SD | |
| ADH7 | SNV | Missense_Mutation | c.632N>T | p.Pro211Leu | p.P211L | P40394 | protein_coding | deleterious(0.01) | possibly_damaging(0.616) | TCGA-EW-A1OY-01 | Breast | breast invasive carcinoma | Female | <65 | I/II | Chemotherapy | doxorubicin | SD | |
| ADH7 | insertion | Frame_Shift_Ins | novel | c.232_233insC | p.Met78ThrfsTer12 | p.M78Tfs*12 | P40394 | protein_coding | TCGA-BH-A0AY-01 | Breast | breast invasive carcinoma | Female | <65 | I/II | Chemotherapy | SD | |||
| ADH7 | deletion | Frame_Shift_Del | novel | c.479delN | p.Phe160SerfsTer2 | p.F160Sfs*2 | P40394 | protein_coding | TCGA-EW-A2FV-01 | Breast | breast invasive carcinoma | Female | <65 | III/IV | Chemotherapy | docetaxel | SD | ||
| ADH7 | SNV | Missense_Mutation | rs759568380 | c.172C>T | p.Arg58Cys | p.R58C | P40394 | protein_coding | deleterious(0.04) | possibly_damaging(0.606) | TCGA-2W-A8YY-01 | Cervix | cervical & endocervical cancer | Female | <65 | I/II | Chemotherapy | cisplatin | CR |
| ADH7 | SNV | Missense_Mutation | c.472N>A | p.His158Asn | p.H158N | P40394 | protein_coding | deleterious(0.04) | benign(0.04) | TCGA-EA-A3QE-01 | Cervix | cervical & endocervical cancer | Female | <65 | I/II | Unknown | Unknown | SD | |
| ADH7 | SNV | Missense_Mutation | c.170N>G | p.Val57Gly | p.V57G | P40394 | protein_coding | deleterious(0) | probably_damaging(0.99) | TCGA-AA-A010-01 | Colorectum | colon adenocarcinoma | Female | <65 | I/II | Chemotherapy | folinic | CR | |
| ADH7 | SNV | Missense_Mutation | rs760167786 | c.893N>T | p.Ala298Val | p.A298V | P40394 | protein_coding | deleterious(0.02) | probably_damaging(0.971) | TCGA-AZ-4315-01 | Colorectum | colon adenocarcinoma | Male | <65 | I/II | Unknown | Unknown | SD |
| ADH7 | SNV | Missense_Mutation | rs147020637 | c.374N>A | p.Arg125His | p.R125H | P40394 | protein_coding | tolerated(0.44) | benign(0.013) | TCGA-AZ-4315-01 | Colorectum | colon adenocarcinoma | Male | <65 | I/II | Unknown | Unknown | SD |
| ADH7 | SNV | Missense_Mutation | rs147020637 | c.374N>A | p.Arg125His | p.R125H | P40394 | protein_coding | tolerated(0.44) | benign(0.013) | TCGA-D5-6930-01 | Colorectum | colon adenocarcinoma | Male | >=65 | I/II | Unknown | Unknown | SD |
| Page: 1 2 3 4 5 |
Top |
Related drugs of malignant transformation related genes |
| Identification of chemicals and drugs interact with genes involved in malignant transfromation |
| (DGIdb 4.0) |
| Entrez ID | Symbol | Category | Interaction Types | Drug Claim Name | Drug Name | PMIDs |
| 131 | ADH7 | DRUGGABLE GENOME, ENZYME | anthracyclines and related substances | 23441093,21900104 |
| Page: 1 |

Copyright 2023-Present -The University of Texas Health Science Center at Houston |