
|
|||||
|
 | |
| |
| |
| |
| |
| |
|
Gene: ADH5 |
Gene summary for ADH5 |
| Gene information | Species | Human | Gene symbol | ADH5 | Gene ID | 128 |
| Gene name | alcohol dehydrogenase 5 (class III), chi polypeptide | |
| Gene Alias | ADH-3 | |
| Cytomap | 4q23 | |
| Gene Type | protein-coding | GO ID | GO:0001523 | UniProtAcc | P11766 |
Top |
Malignant transformation analysis |
| Identification of the aberrant gene expression in precancerous and cancerous lesions by comparing the gene expression of stem-like cells in diseased tissues with normal stem cells |
| Entrez ID | Symbol | Replicates | Species | Organ | Tissue | Adj P-value | Log2FC | Malignancy |
| 128 | ADH5 | HTA11_78_2000001011 | Human | Colorectum | AD | 5.29e-03 | 4.82e-01 | -0.1088 |
| 128 | ADH5 | HTA11_347_2000001011 | Human | Colorectum | AD | 1.01e-13 | 6.02e-01 | -0.1954 |
| 128 | ADH5 | HTA11_99999970781_79442 | Human | Colorectum | MSS | 1.34e-25 | 9.87e-01 | 0.294 |
| 128 | ADH5 | A015-C-203 | Human | Colorectum | FAP | 8.94e-08 | -1.74e-01 | -0.1294 |
| 128 | ADH5 | A002-C-201 | Human | Colorectum | FAP | 4.32e-05 | -2.33e-01 | 0.0324 |
| 128 | ADH5 | A001-C-108 | Human | Colorectum | FAP | 4.38e-08 | -2.65e-01 | -0.0272 |
| 128 | ADH5 | A002-C-205 | Human | Colorectum | FAP | 5.01e-08 | -2.64e-01 | -0.1236 |
| 128 | ADH5 | A015-C-005 | Human | Colorectum | FAP | 2.13e-03 | -2.59e-01 | -0.0336 |
| 128 | ADH5 | A015-C-006 | Human | Colorectum | FAP | 8.41e-05 | -2.71e-01 | -0.0994 |
| 128 | ADH5 | A015-C-106 | Human | Colorectum | FAP | 6.23e-05 | -2.25e-01 | -0.0511 |
| 128 | ADH5 | A002-C-114 | Human | Colorectum | FAP | 7.79e-04 | -1.97e-01 | -0.1561 |
| 128 | ADH5 | A015-C-104 | Human | Colorectum | FAP | 2.36e-10 | -1.91e-01 | -0.1899 |
| 128 | ADH5 | A001-C-014 | Human | Colorectum | FAP | 5.58e-09 | -2.69e-01 | 0.0135 |
| 128 | ADH5 | A002-C-016 | Human | Colorectum | FAP | 3.56e-05 | -1.65e-01 | 0.0521 |
| 128 | ADH5 | A015-C-002 | Human | Colorectum | FAP | 1.28e-04 | -3.05e-01 | -0.0763 |
| 128 | ADH5 | A001-C-203 | Human | Colorectum | FAP | 1.69e-02 | -1.86e-01 | -0.0481 |
| 128 | ADH5 | A002-C-116 | Human | Colorectum | FAP | 3.04e-10 | -2.51e-01 | -0.0452 |
| 128 | ADH5 | A014-C-008 | Human | Colorectum | FAP | 3.87e-03 | -1.77e-01 | -0.191 |
| 128 | ADH5 | A018-E-020 | Human | Colorectum | FAP | 1.93e-05 | -2.13e-01 | -0.2034 |
| 128 | ADH5 | F034 | Human | Colorectum | FAP | 1.07e-08 | -2.66e-01 | -0.0665 |
| Page: 1 2 3 4 5 6 7 8 9 |
| Tissue | Expression Dynamics | Abbreviation |
| Colorectum (GSE201348) |  | FAP: Familial adenomatous polyposis |
| CRC: Colorectal cancer | ||
| Colorectum (HTA11) |  | AD: Adenomas |
| SER: Sessile serrated lesions | ||
| MSI-H: Microsatellite-high colorectal cancer | ||
| MSS: Microsatellite stable colorectal cancer | ||
| Endometrium | 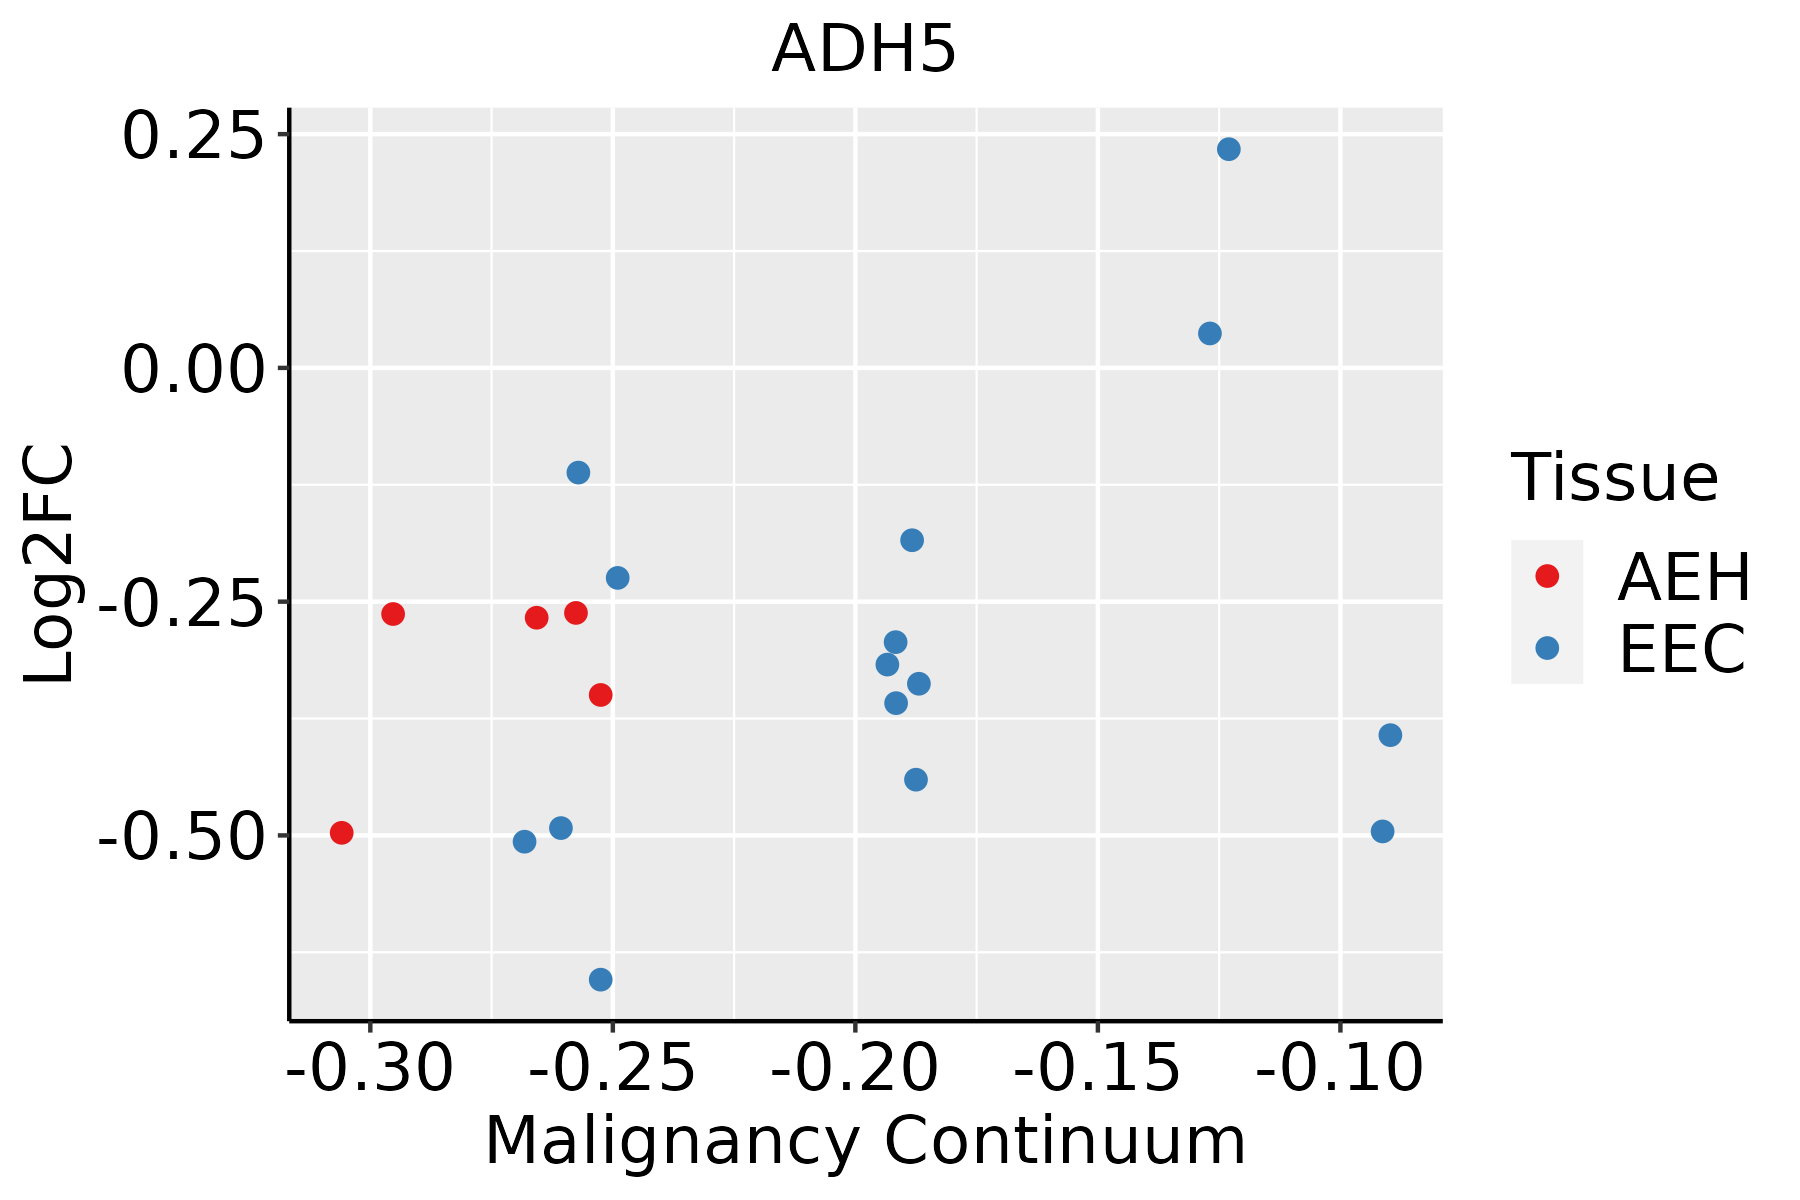 | AEH: Atypical endometrial hyperplasia |
| EEC: Endometrioid Cancer | ||
| Esophagus | 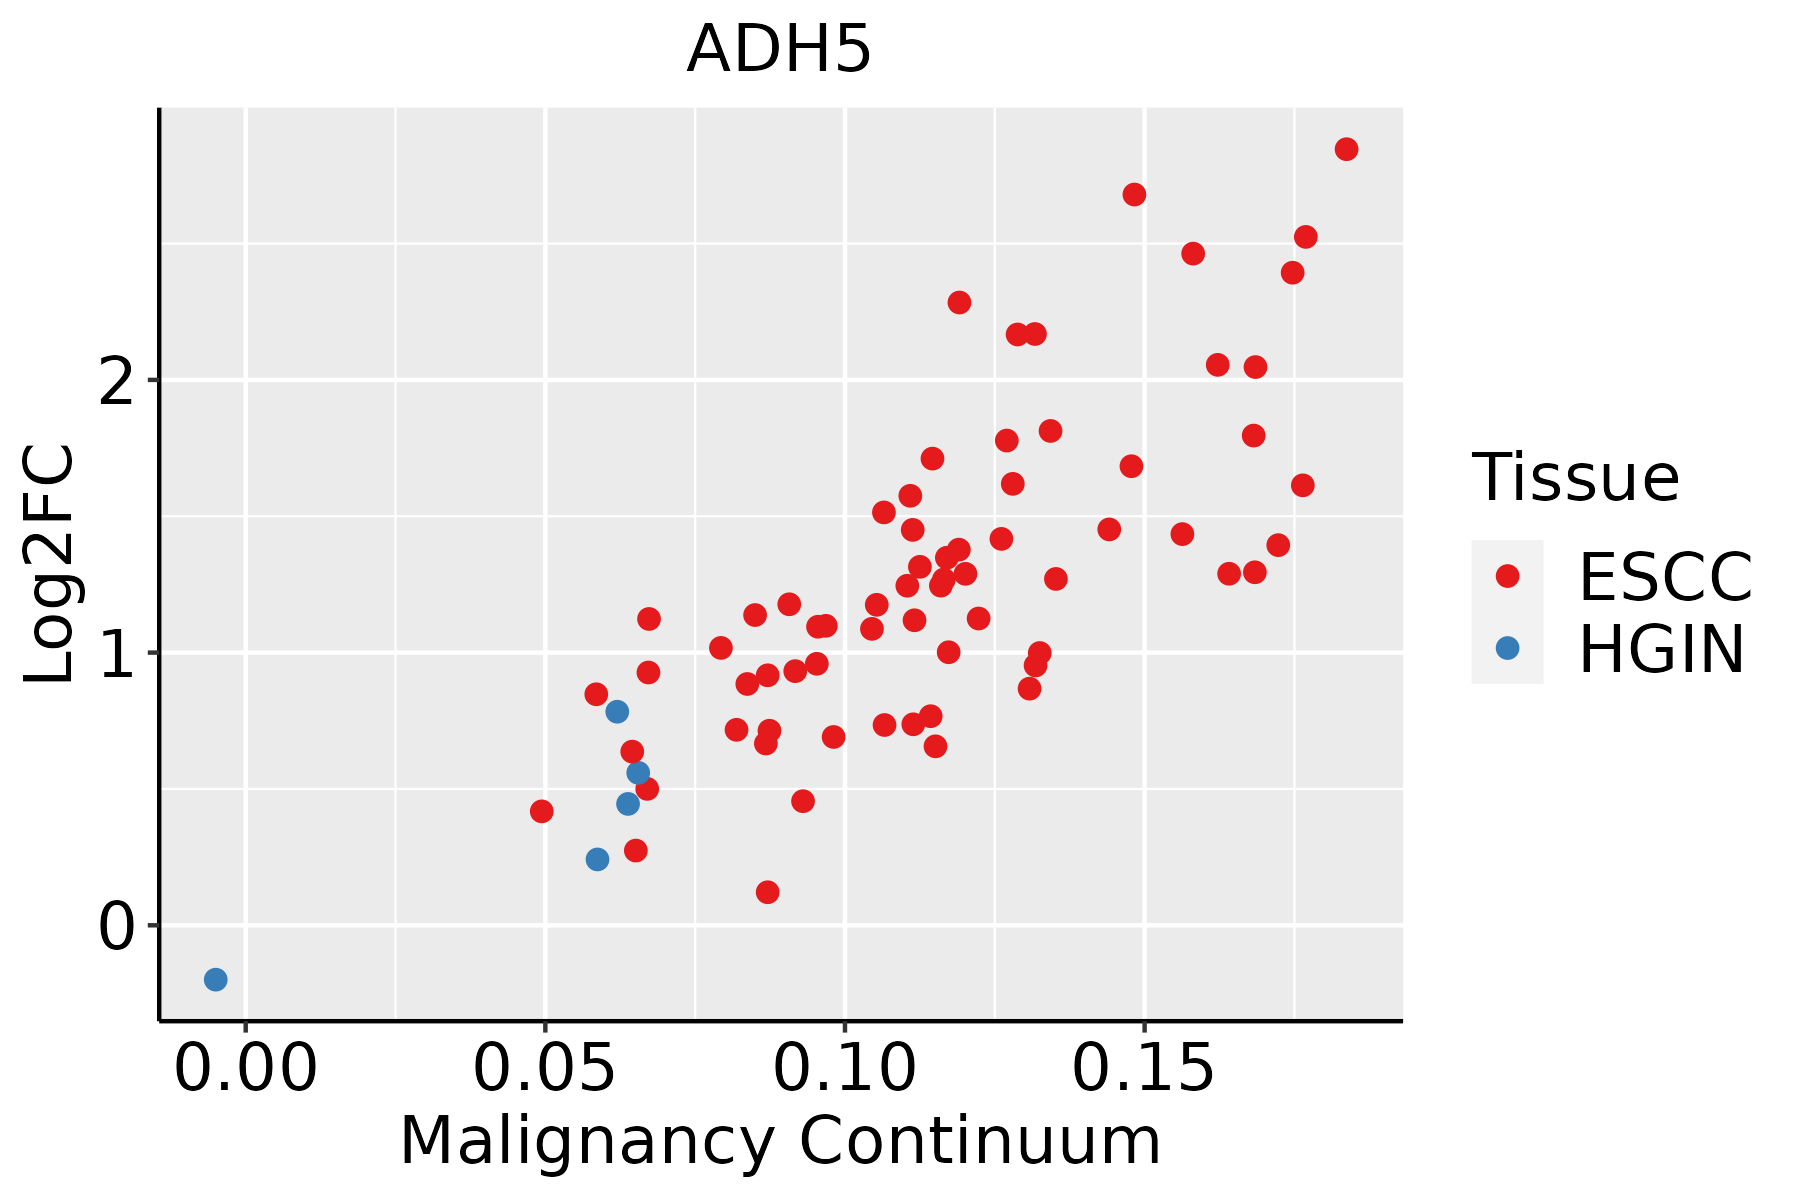 | ESCC: Esophageal squamous cell carcinoma |
| HGIN: High-grade intraepithelial neoplasias | ||
| LGIN: Low-grade intraepithelial neoplasias | ||
| Liver | 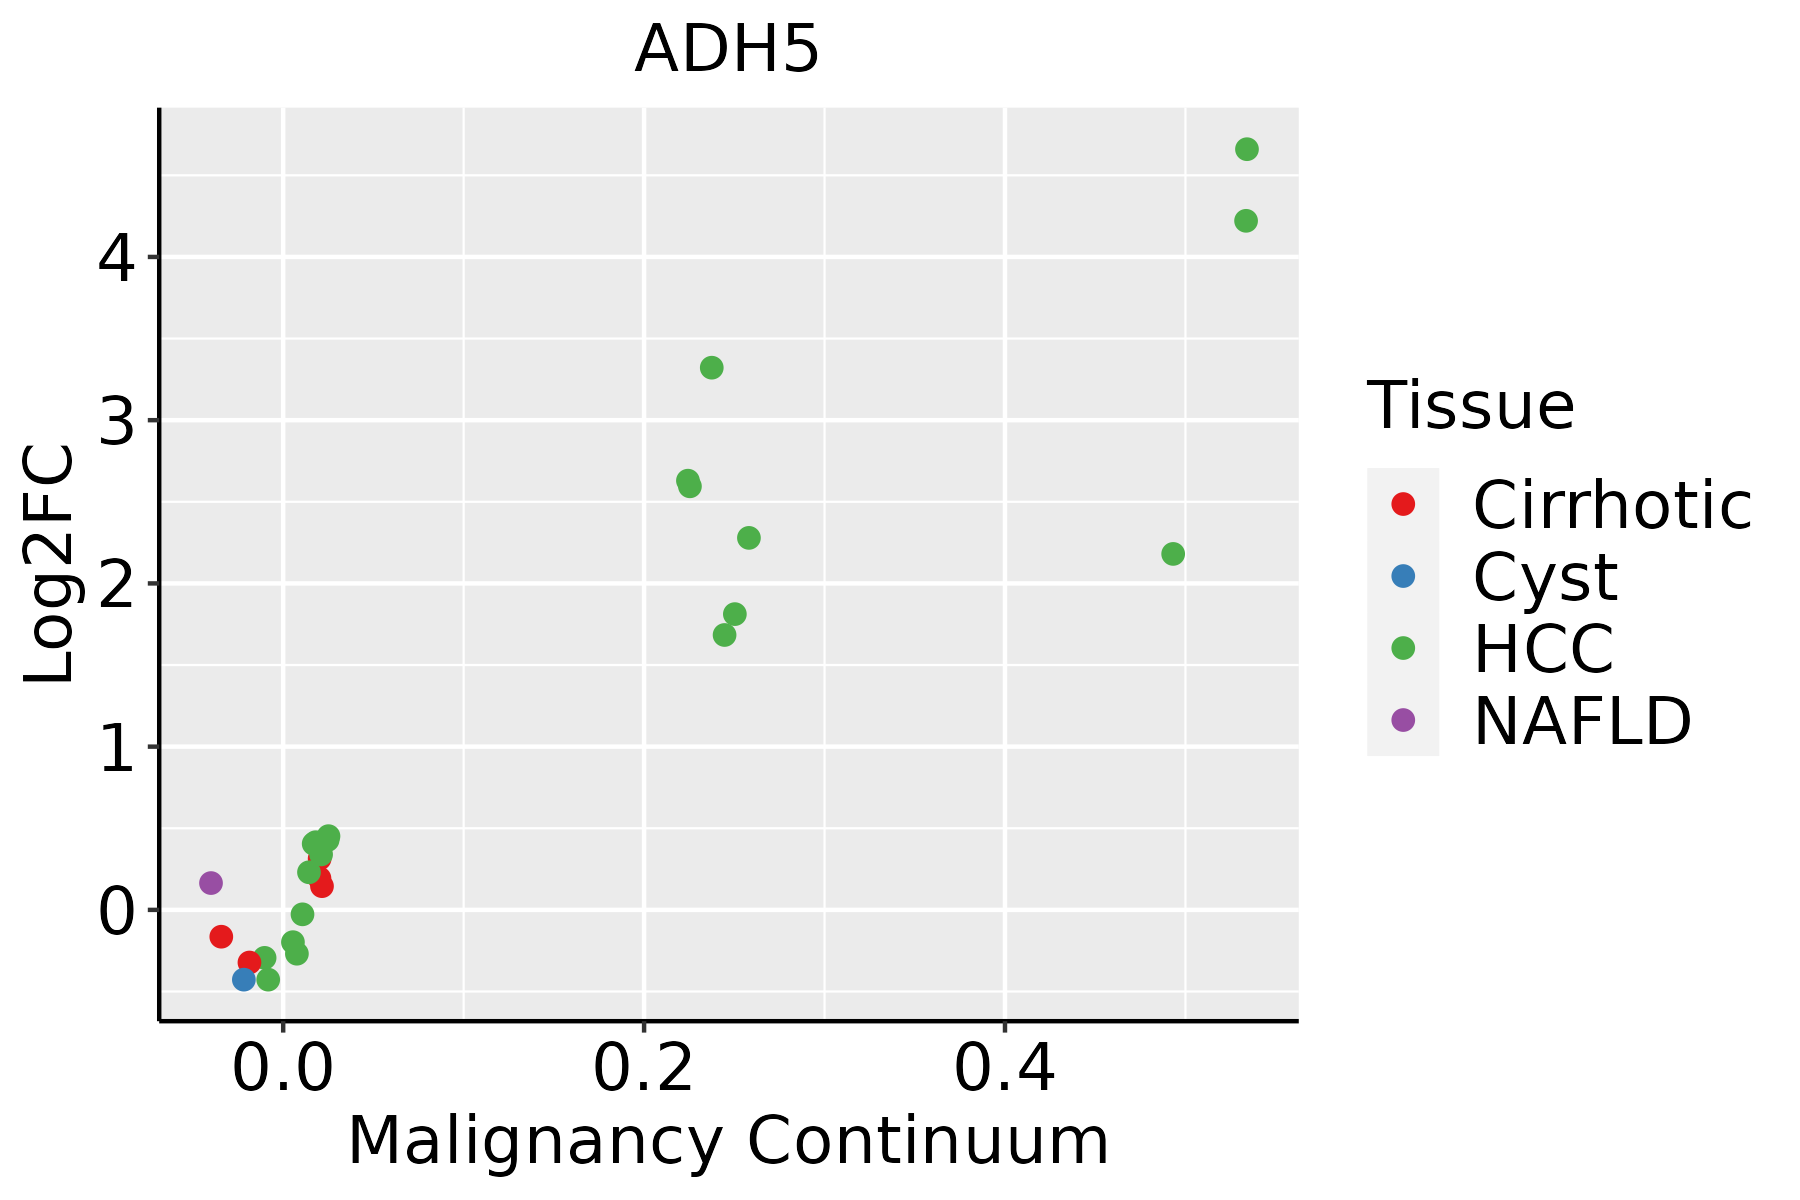 | HCC: Hepatocellular carcinoma |
| NAFLD: Non-alcoholic fatty liver disease | ||
| Oral Cavity | 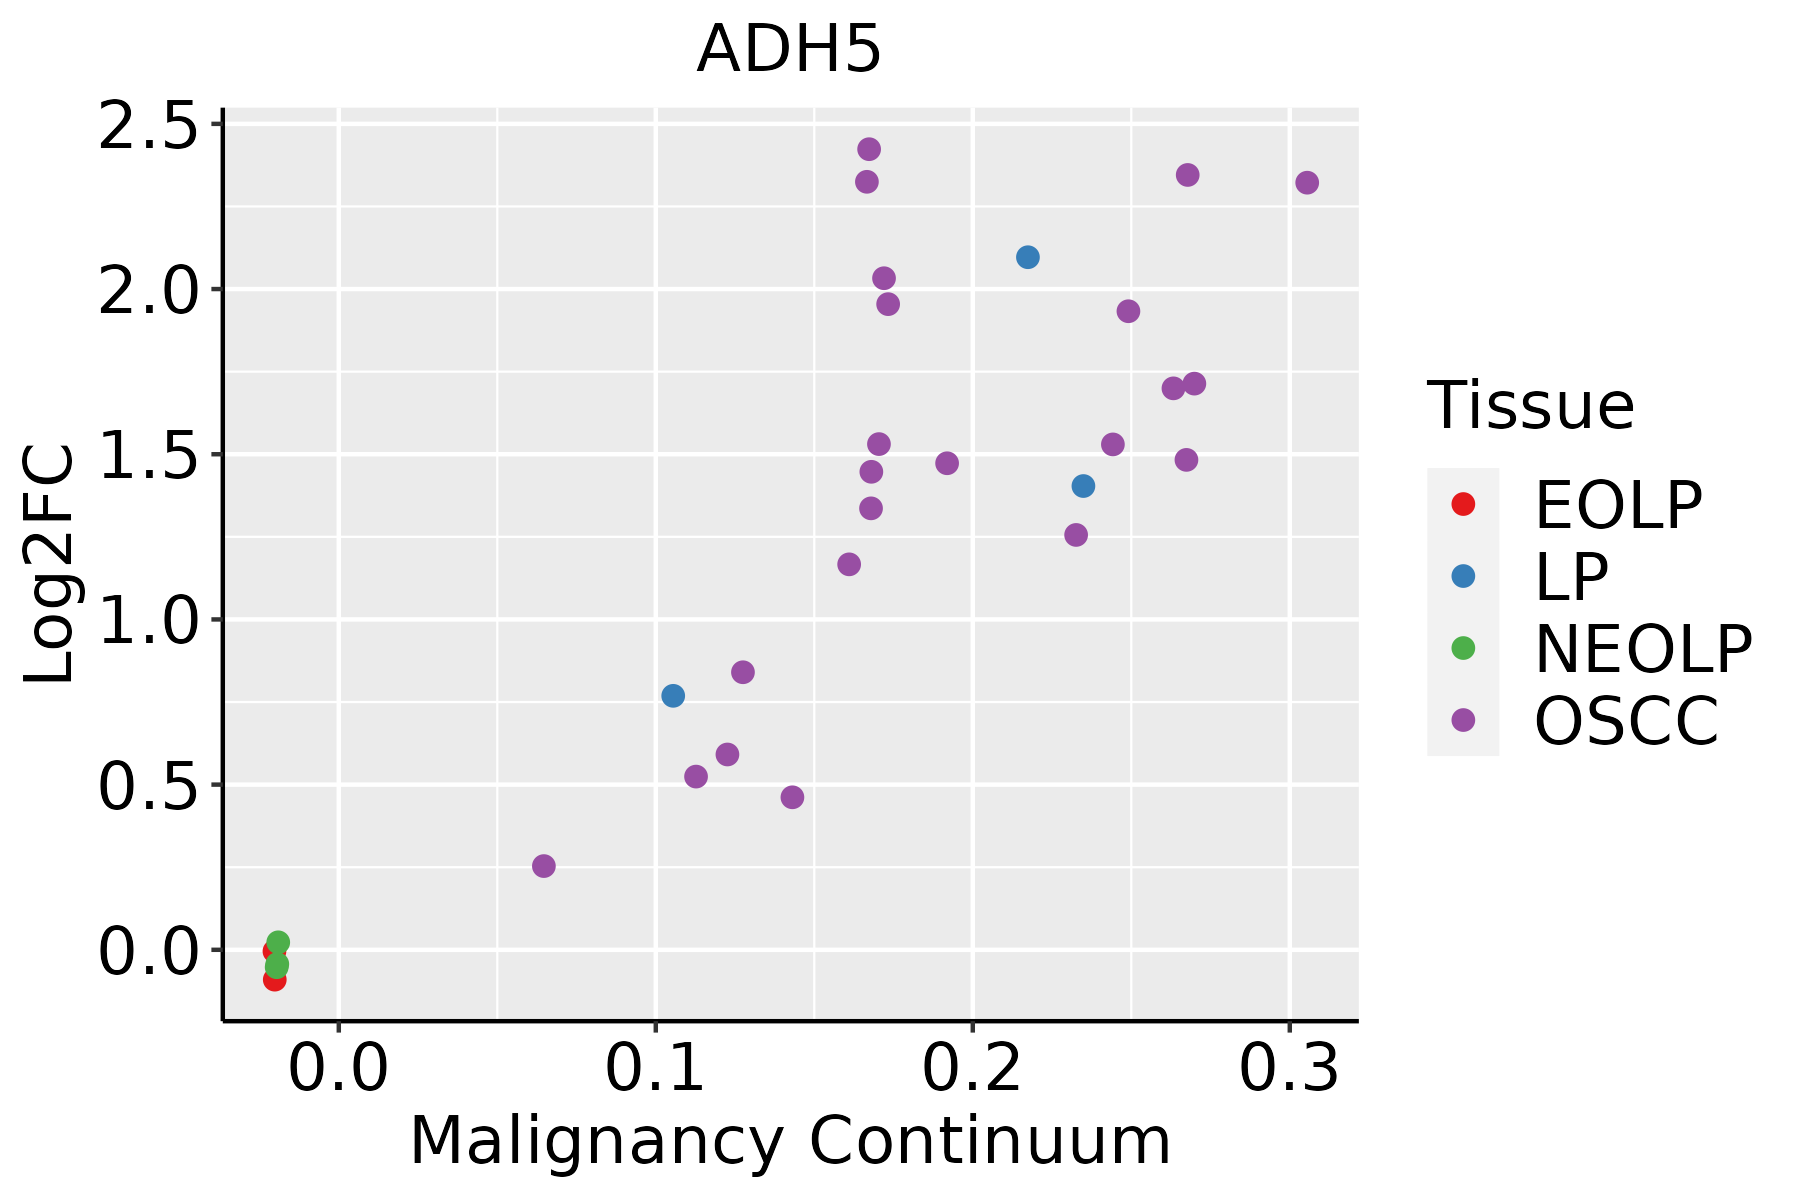 | EOLP: Erosive Oral lichen planus |
| LP: leukoplakia | ||
| NEOLP: Non-erosive oral lichen planus | ||
| OSCC: Oral squamous cell carcinoma | ||
| Prostate |  | BPH: Benign Prostatic Hyperplasia |
| Skin | 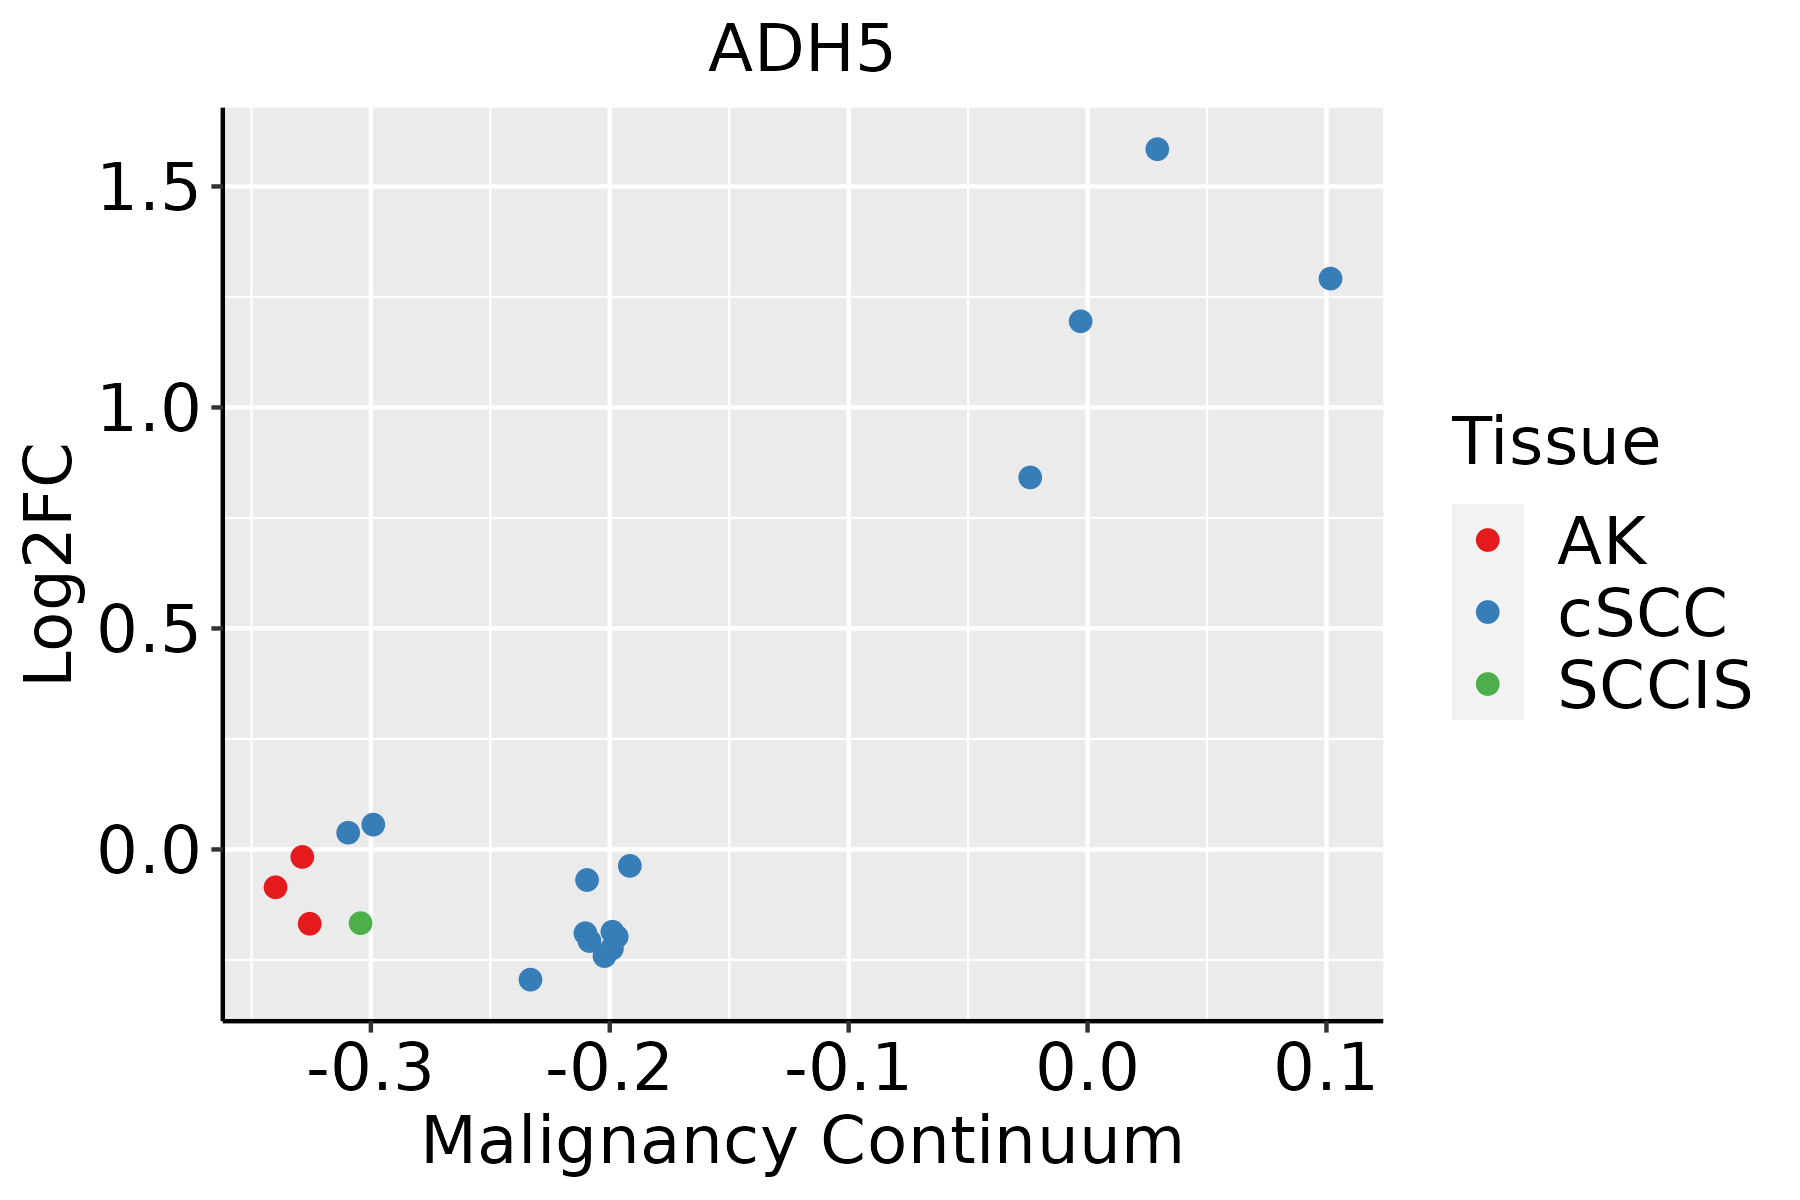 | AK: Actinic keratosis |
| cSCC: Cutaneous squamous cell carcinoma | ||
| SCCIS:squamous cell carcinoma in situ | ||
| Thyroid | 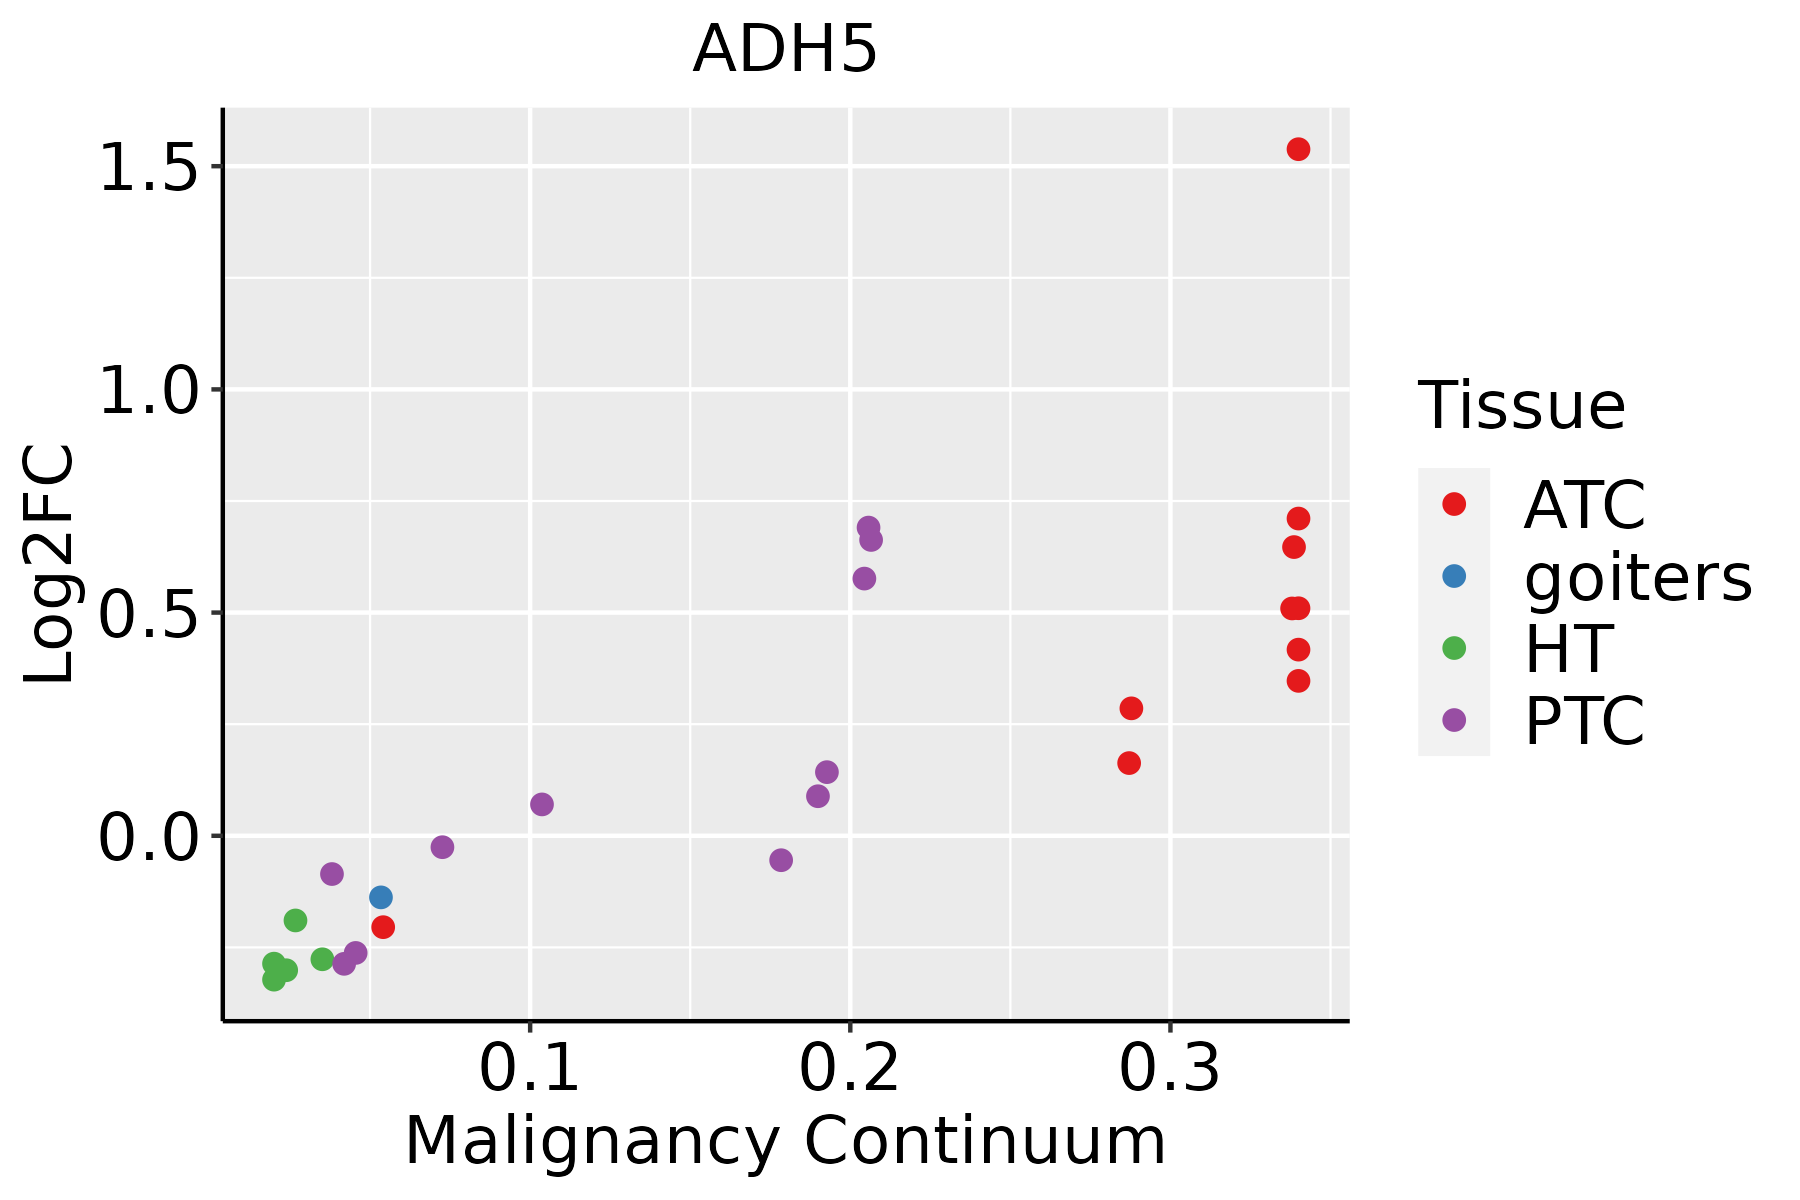 | ATC: Anaplastic thyroid cancer |
| HT: Hashimoto's thyroiditis | ||
| PTC: Papillary thyroid cancer |
| ∗log2FC in expression of this searched gene in stem-like cells from each diseased tissue sample relative to stem-like cells in normal samples in each tissue plotted against the malignancy continuum. Samples are colored based on if they are from different disease stage. |
Top |
Malignant transformation related pathway analysis |
| Find out the enriched GO biological processes and KEGG pathways involved in transition from healthy to precancer to cancer |
| Tissue | Disease Stage | Enriched GO biological Processes |
| Colorectum | AD |  |
| Colorectum | SER |  |
| Colorectum | MSS |  |
| Colorectum | MSI-H |  |
| Colorectum | FAP |  |
| ∗Top 15 enriched GO BP terms are showed in the bar plot of each disease state in each tissue. Each row represents a significant GO biological process which is colored according to the -log10(p.adjust). |
| Page: 1 2 3 4 5 6 7 8 9 |
| GO ID | Tissue | Disease Stage | Description | Gene Ratio | Bg Ratio | pvalue | p.adjust | Count |
| GO:0006091 | Colorectum | AD | generation of precursor metabolites and energy | 209/3918 | 490/18723 | 3.17e-28 | 6.61e-25 | 209 |
| GO:0022900 | Colorectum | AD | electron transport chain | 89/3918 | 175/18723 | 1.42e-18 | 8.91e-16 | 89 |
| GO:0044282 | Colorectum | AD | small molecule catabolic process | 118/3918 | 376/18723 | 1.05e-06 | 3.55e-05 | 118 |
| GO:0009636 | Colorectum | AD | response to toxic substance | 88/3918 | 262/18723 | 1.12e-06 | 3.72e-05 | 88 |
| GO:0019395 | Colorectum | AD | fatty acid oxidation | 40/3918 | 103/18723 | 2.43e-05 | 4.69e-04 | 40 |
| GO:0006066 | Colorectum | AD | alcohol metabolic process | 106/3918 | 353/18723 | 3.02e-05 | 5.57e-04 | 106 |
| GO:0098754 | Colorectum | AD | detoxification | 53/3918 | 152/18723 | 4.63e-05 | 7.98e-04 | 53 |
| GO:0006631 | Colorectum | AD | fatty acid metabolic process | 114/3918 | 390/18723 | 5.58e-05 | 9.44e-04 | 114 |
| GO:0034440 | Colorectum | AD | lipid oxidation | 40/3918 | 108/18723 | 8.52e-05 | 1.32e-03 | 40 |
| GO:0097237 | Colorectum | AD | cellular response to toxic substance | 44/3918 | 124/18723 | 1.24e-04 | 1.80e-03 | 44 |
| GO:0030258 | Colorectum | AD | lipid modification | 67/3918 | 212/18723 | 1.66e-04 | 2.27e-03 | 67 |
| GO:1990748 | Colorectum | AD | cellular detoxification | 41/3918 | 116/18723 | 2.29e-04 | 2.97e-03 | 41 |
| GO:0034308 | Colorectum | AD | primary alcohol metabolic process | 35/3918 | 102/18723 | 1.16e-03 | 1.05e-02 | 35 |
| GO:0006067 | Colorectum | AD | ethanol metabolic process | 11/3918 | 21/18723 | 1.43e-03 | 1.22e-02 | 11 |
| GO:0006081 | Colorectum | AD | cellular aldehyde metabolic process | 22/3918 | 60/18723 | 3.64e-03 | 2.60e-02 | 22 |
| GO:00060912 | Colorectum | MSS | generation of precursor metabolites and energy | 186/3467 | 490/18723 | 1.14e-24 | 2.15e-21 | 186 |
| GO:00229002 | Colorectum | MSS | electron transport chain | 83/3467 | 175/18723 | 2.06e-18 | 1.17e-15 | 83 |
| GO:00096362 | Colorectum | MSS | response to toxic substance | 73/3467 | 262/18723 | 1.26e-04 | 1.94e-03 | 73 |
| GO:00060662 | Colorectum | MSS | alcohol metabolic process | 92/3467 | 353/18723 | 2.57e-04 | 3.46e-03 | 92 |
| GO:00442822 | Colorectum | MSS | small molecule catabolic process | 94/3467 | 376/18723 | 9.85e-04 | 9.86e-03 | 94 |
| Page: 1 2 3 4 5 6 7 8 9 10 11 |
| Pathway ID | Tissue | Disease Stage | Description | Gene Ratio | Bg Ratio | pvalue | p.adjust | qvalue | Count |
| hsa01200 | Colorectum | AD | Carbon metabolism | 55/2092 | 115/8465 | 5.53e-08 | 8.42e-07 | 5.37e-07 | 55 |
| hsa00620 | Colorectum | AD | Pyruvate metabolism | 28/2092 | 47/8465 | 3.71e-07 | 5.41e-06 | 3.45e-06 | 28 |
| hsa00010 | Colorectum | AD | Glycolysis / Gluconeogenesis | 34/2092 | 67/8465 | 3.63e-06 | 4.34e-05 | 2.77e-05 | 34 |
| hsa00071 | Colorectum | AD | Fatty acid degradation | 20/2092 | 43/8465 | 1.50e-03 | 8.69e-03 | 5.54e-03 | 20 |
| hsa012001 | Colorectum | AD | Carbon metabolism | 55/2092 | 115/8465 | 5.53e-08 | 8.42e-07 | 5.37e-07 | 55 |
| hsa006201 | Colorectum | AD | Pyruvate metabolism | 28/2092 | 47/8465 | 3.71e-07 | 5.41e-06 | 3.45e-06 | 28 |
| hsa000101 | Colorectum | AD | Glycolysis / Gluconeogenesis | 34/2092 | 67/8465 | 3.63e-06 | 4.34e-05 | 2.77e-05 | 34 |
| hsa000711 | Colorectum | AD | Fatty acid degradation | 20/2092 | 43/8465 | 1.50e-03 | 8.69e-03 | 5.54e-03 | 20 |
| hsa006204 | Colorectum | MSS | Pyruvate metabolism | 24/1875 | 47/8465 | 1.25e-05 | 1.35e-04 | 8.27e-05 | 24 |
| hsa012004 | Colorectum | MSS | Carbon metabolism | 43/1875 | 115/8465 | 1.37e-04 | 1.17e-03 | 7.19e-04 | 43 |
| hsa000104 | Colorectum | MSS | Glycolysis / Gluconeogenesis | 28/1875 | 67/8465 | 2.36e-04 | 1.81e-03 | 1.11e-03 | 28 |
| hsa000714 | Colorectum | MSS | Fatty acid degradation | 17/1875 | 43/8465 | 7.50e-03 | 2.86e-02 | 1.75e-02 | 17 |
| hsa006205 | Colorectum | MSS | Pyruvate metabolism | 24/1875 | 47/8465 | 1.25e-05 | 1.35e-04 | 8.27e-05 | 24 |
| hsa012005 | Colorectum | MSS | Carbon metabolism | 43/1875 | 115/8465 | 1.37e-04 | 1.17e-03 | 7.19e-04 | 43 |
| hsa000105 | Colorectum | MSS | Glycolysis / Gluconeogenesis | 28/1875 | 67/8465 | 2.36e-04 | 1.81e-03 | 1.11e-03 | 28 |
| hsa000715 | Colorectum | MSS | Fatty acid degradation | 17/1875 | 43/8465 | 7.50e-03 | 2.86e-02 | 1.75e-02 | 17 |
| hsa012006 | Colorectum | FAP | Carbon metabolism | 38/1404 | 115/8465 | 1.04e-05 | 1.44e-04 | 8.76e-05 | 38 |
| hsa000106 | Colorectum | FAP | Glycolysis / Gluconeogenesis | 24/1404 | 67/8465 | 1.05e-04 | 9.46e-04 | 5.76e-04 | 24 |
| hsa006206 | Colorectum | FAP | Pyruvate metabolism | 17/1404 | 47/8465 | 9.18e-04 | 5.20e-03 | 3.16e-03 | 17 |
| hsa000716 | Colorectum | FAP | Fatty acid degradation | 15/1404 | 43/8465 | 2.73e-03 | 1.23e-02 | 7.50e-03 | 15 |
| Page: 1 2 3 4 |
Top |
Cell-cell communication analysis |
| Identification of potential cell-cell interactions between two cell types and their ligand-receptor pairs for different disease states |
| Ligand | Receptor | LRpair | Pathway | Tissue | Disease Stage |
| Page: 1 |
Top |
Single-cell gene regulatory network inference analysis |
| Find out the significant the regulons (TFs) and the target genes of each regulon across cell types for different disease states |
| TF | Cell Type | Tissue | Disease Stage | Target Gene | RSS | Regulon Activity |
| ∗The dot plots of a searched regulon are shown for all cell subpopulations in each disease state of each tissue based on the regulon specific score inferred using pySCENIC and by calculating the average expression. |
| Page: 1 |
Top |
Somatic mutation of malignant transformation related genes |
| Annotation of somatic variants for genes involved in malignant transformation |
| Hugo Symbol | Variant Class | Variant Classification | dbSNP RS | HGVSc | HGVSp | HGVSp Short | SWISSPROT | BIOTYPE | SIFT | PolyPhen | Tumor Sample Barcode | Tissue | Histology | Sex | Age | Stage | Therapy Types | Drugs | Outcome |
| ADH5 | SNV | Missense_Mutation | novel | c.700G>A | p.Glu234Lys | p.E234K | P11766 | protein_coding | tolerated(0.85) | benign(0.007) | TCGA-BH-A2L8-01 | Breast | breast invasive carcinoma | Female | <65 | I/II | Chemotherapy | cytoxan | CR |
| ADH5 | SNV | Missense_Mutation | c.253N>A | p.Ala85Thr | p.A85T | P11766 | protein_coding | tolerated(0.06) | benign(0.001) | TCGA-D8-A1Y0-01 | Breast | breast invasive carcinoma | Female | >=65 | III/IV | Chemotherapy | cyclophosphamide+methotrexatum+fluorouracillum | SD | |
| ADH5 | SNV | Missense_Mutation | novel | c.373G>A | p.Asp125Asn | p.D125N | P11766 | protein_coding | deleterious(0.03) | benign(0.429) | TCGA-PE-A5DE-01 | Breast | breast invasive carcinoma | Female | <65 | I/II | Chemotherapy | taxotere | CR |
| ADH5 | insertion | Frame_Shift_Ins | novel | c.616_617insAATGC | p.Ala206GlufsTer54 | p.A206Efs*54 | P11766 | protein_coding | TCGA-A8-A07R-01 | Breast | breast invasive carcinoma | Female | >=65 | III/IV | Ancillary | zoledronic | SD | ||
| ADH5 | insertion | Frame_Shift_Ins | novel | c.614_615insTCAGATTA | p.Leu205PhefsTer56 | p.L205Ffs*56 | P11766 | protein_coding | TCGA-A8-A07R-01 | Breast | breast invasive carcinoma | Female | >=65 | III/IV | Ancillary | zoledronic | SD | ||
| ADH5 | insertion | Nonsense_Mutation | novel | c.385_386insAAGAAAATGCTCATT | p.Arg129delinsLysGluAsnAlaHisTer | p.R129delinsKENAH* | P11766 | protein_coding | TCGA-BH-A0HF-01 | Breast | breast invasive carcinoma | Female | >=65 | I/II | Hormone Therapy | arimidex | SD | ||
| ADH5 | SNV | Missense_Mutation | c.521N>A | p.Cys174Tyr | p.C174Y | P11766 | protein_coding | deleterious(0) | probably_damaging(1) | TCGA-AA-3973-01 | Colorectum | colon adenocarcinoma | Male | >=65 | III/IV | Targeted Molecular therapy | bevacizumab | SD | |
| ADH5 | SNV | Missense_Mutation | novel | c.305N>G | p.Phe102Cys | p.F102C | P11766 | protein_coding | deleterious(0.01) | probably_damaging(0.991) | TCGA-AA-3977-01 | Colorectum | colon adenocarcinoma | Male | >=65 | I/II | Unknown | Unknown | SD |
| ADH5 | SNV | Missense_Mutation | novel | c.328N>A | p.Leu110Ile | p.L110I | P11766 | protein_coding | deleterious(0.03) | possibly_damaging(0.817) | TCGA-AZ-4315-01 | Colorectum | colon adenocarcinoma | Male | <65 | I/II | Unknown | Unknown | SD |
| ADH5 | SNV | Missense_Mutation | novel | c.306N>G | p.Phe102Leu | p.F102L | P11766 | protein_coding | deleterious(0.03) | benign(0.163) | TCGA-CA-6717-01 | Colorectum | colon adenocarcinoma | Male | <65 | I/II | Chemotherapy | oxaliplatin | CR |
| Page: 1 2 3 4 |
Top |
Related drugs of malignant transformation related genes |
| Identification of chemicals and drugs interact with genes involved in malignant transfromation |
| (DGIdb 4.0) |
| Entrez ID | Symbol | Category | Interaction Types | Drug Claim Name | Drug Name | PMIDs |
| Page: 1 |

Copyright 2023-Present -The University of Texas Health Science Center at Houston |