
|
|||||
|
 | |
| |
| |
| |
| |
| |
|
Gene: ADH4 |
Gene summary for ADH4 |
| Gene information | Species | Human | Gene symbol | ADH4 | Gene ID | 127 |
| Gene name | alcohol dehydrogenase 4 (class II), pi polypeptide | |
| Gene Alias | ADH-2 | |
| Cytomap | 4q23 | |
| Gene Type | protein-coding | GO ID | GO:0001523 | UniProtAcc | P08319 |
Top |
Malignant transformation analysis |
| Identification of the aberrant gene expression in precancerous and cancerous lesions by comparing the gene expression of stem-like cells in diseased tissues with normal stem cells |
| Entrez ID | Symbol | Replicates | Species | Organ | Tissue | Adj P-value | Log2FC | Malignancy |
| 127 | ADH4 | NAFLD1 | Human | Liver | NAFLD | 1.06e-04 | 1.01e-01 | -0.04 |
| 127 | ADH4 | HCC1_Meng | Human | Liver | HCC | 6.63e-21 | -5.33e-01 | 0.0246 |
| 127 | ADH4 | HCC2_Meng | Human | Liver | HCC | 4.78e-18 | -5.28e-01 | 0.0107 |
| 127 | ADH4 | cirrhotic1 | Human | Liver | Cirrhotic | 1.13e-15 | -5.20e-01 | 0.0202 |
| 127 | ADH4 | cirrhotic2 | Human | Liver | Cirrhotic | 3.38e-14 | -4.93e-01 | 0.0201 |
| 127 | ADH4 | cirrhotic3 | Human | Liver | Cirrhotic | 1.86e-09 | -5.36e-01 | 0.0215 |
| 127 | ADH4 | HCC1 | Human | Liver | HCC | 4.25e-23 | 5.03e+00 | 0.5336 |
| 127 | ADH4 | Pt13.a | Human | Liver | HCC | 1.76e-24 | -1.74e-01 | 0.021 |
| 127 | ADH4 | Pt13.b | Human | Liver | HCC | 9.59e-21 | -2.81e-01 | 0.0251 |
| 127 | ADH4 | Pt14.b | Human | Liver | HCC | 2.21e-04 | -2.50e-01 | 0.018 |
| 127 | ADH4 | Pt14.d | Human | Liver | HCC | 6.44e-16 | -1.97e-01 | 0.0143 |
| 127 | ADH4 | S028 | Human | Liver | HCC | 2.43e-04 | -5.36e-01 | 0.2503 |
| 127 | ADH4 | S029 | Human | Liver | HCC | 3.60e-02 | -5.25e-01 | 0.2581 |
| 127 | ADH4 | Pat01-B | Human | Stomach | GC | 6.89e-20 | 3.87e-01 | 0.5754 |
| 127 | ADH4 | Pat03-B | Human | Stomach | GC | 5.81e-13 | 3.30e-01 | 0.3693 |
| 127 | ADH4 | Pat13-B | Human | Stomach | GC | 1.74e-02 | 1.41e-01 | 0.0555 |
| 127 | ADH4 | Pat17-B | Human | Stomach | GC | 8.40e-04 | 1.60e-01 | 0.3109 |
| 127 | ADH4 | SIM_2 | Human | Stomach | SIM | 4.35e-07 | 2.61e-01 | 0.3139 |
| Page: 1 |
| Tissue | Expression Dynamics | Abbreviation |
| GC | 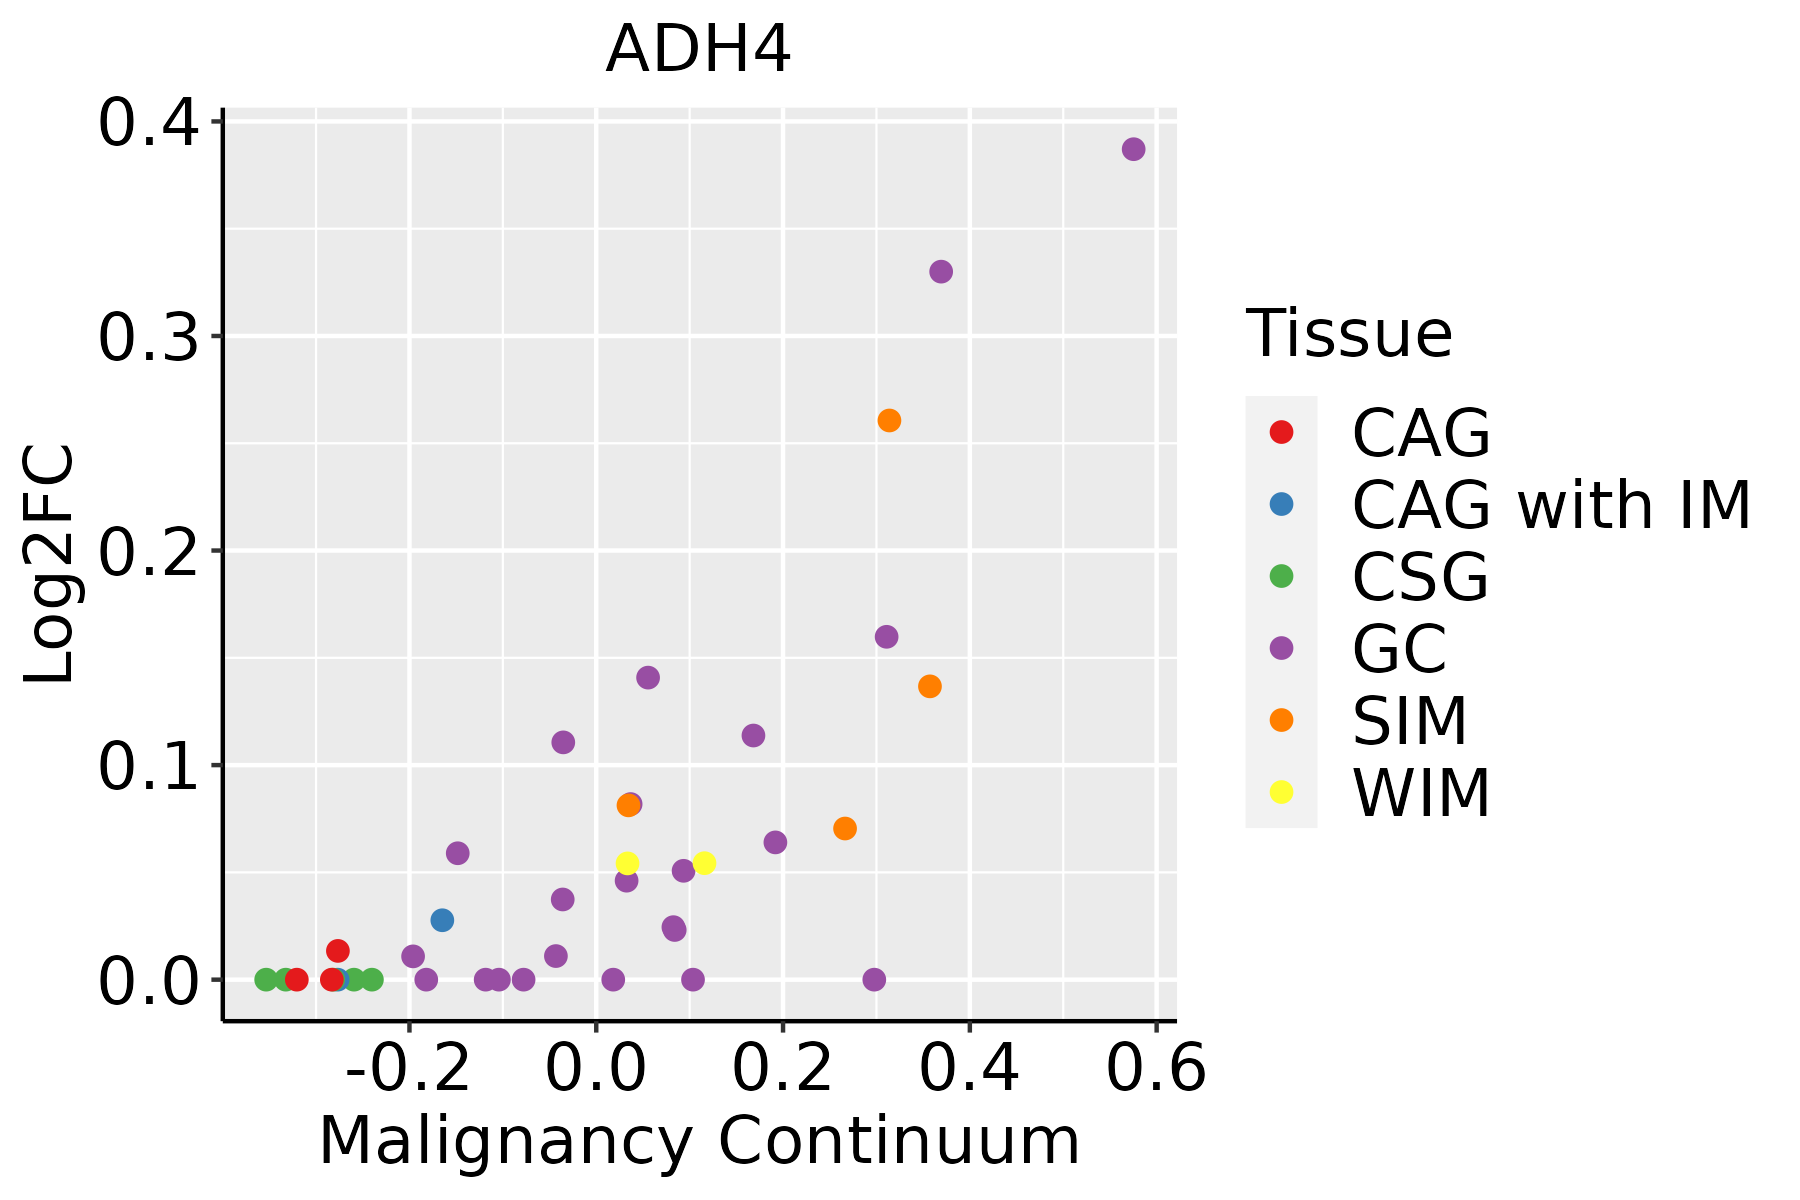 | CAG: Chronic atrophic gastritis |
| CAG with IM: Chronic atrophic gastritis with intestinal metaplasia | ||
| CSG: Chronic superficial gastritis | ||
| GC: Gastric cancer | ||
| SIM: Severe intestinal metaplasia | ||
| WIM: Wild intestinal metaplasia | ||
| Liver | 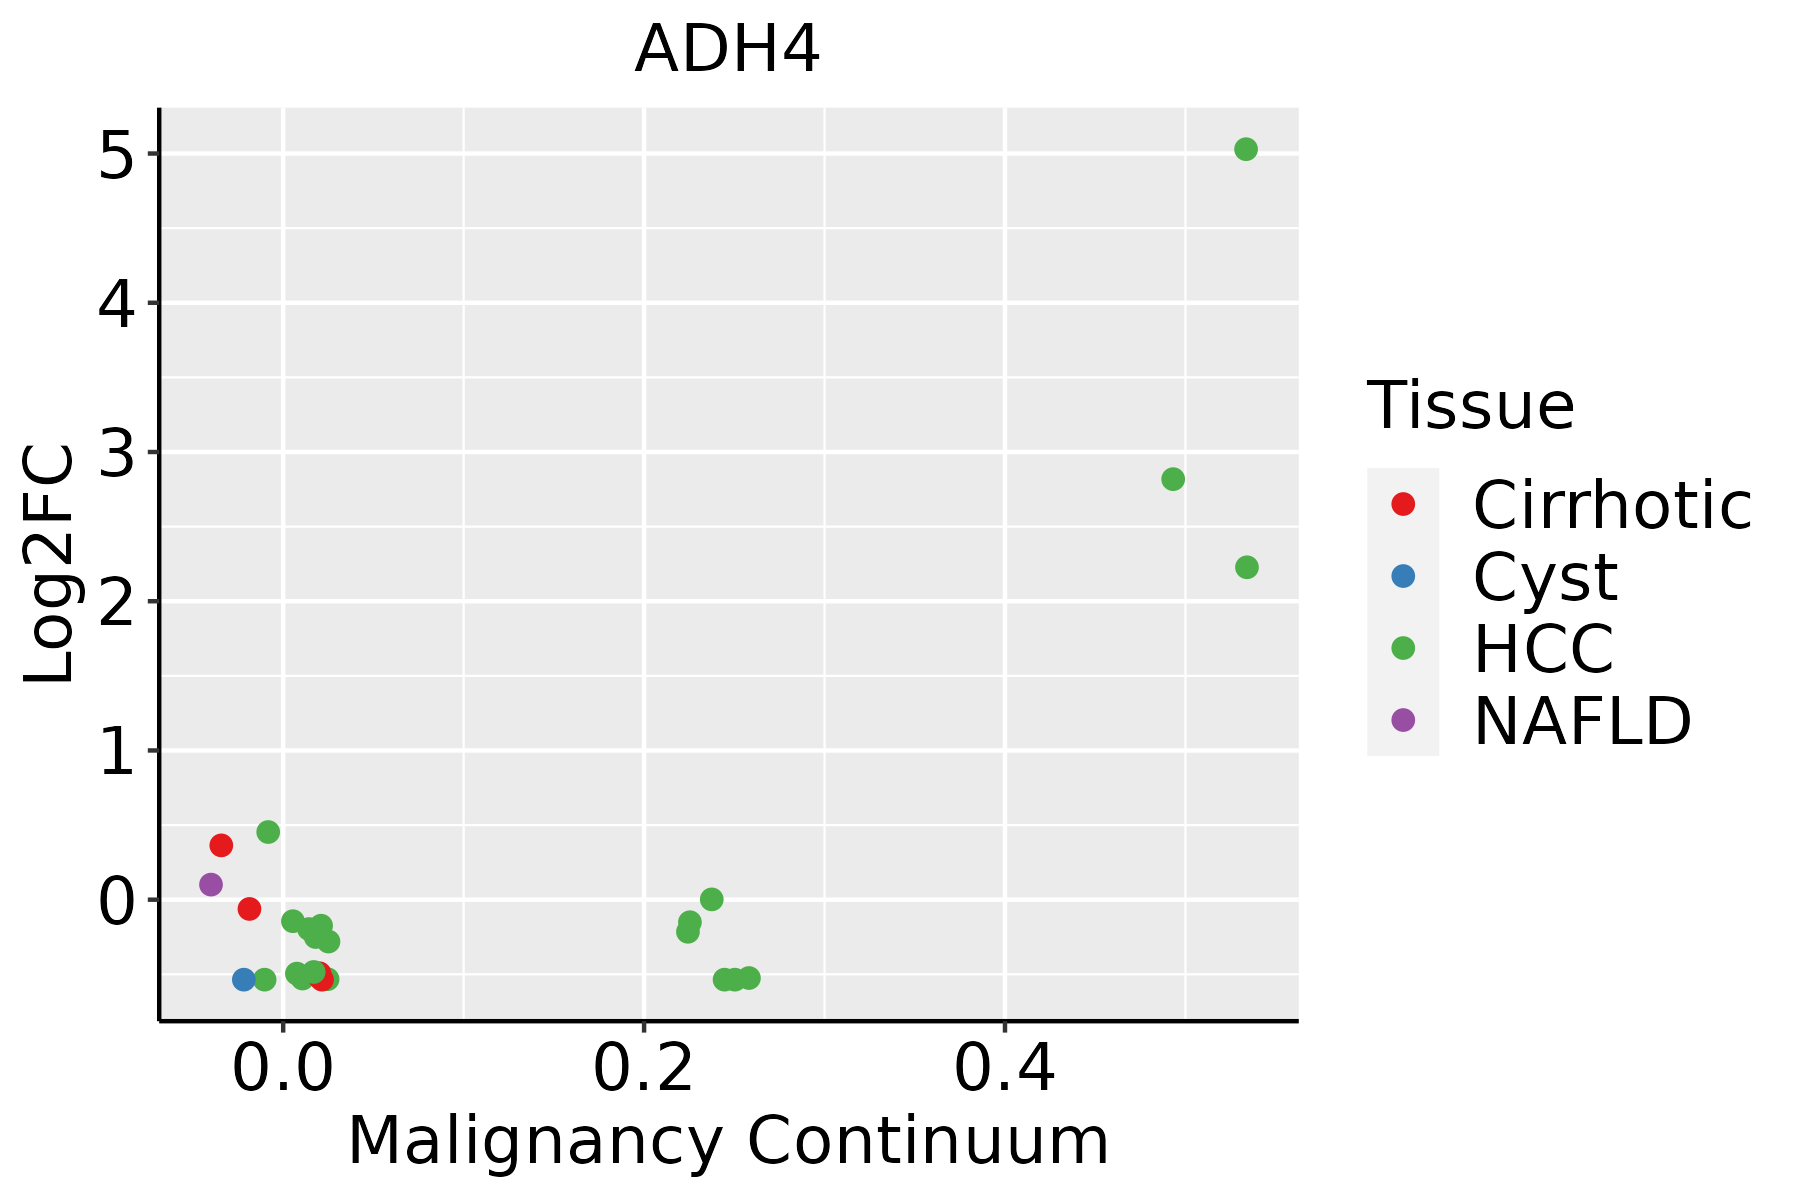 | HCC: Hepatocellular carcinoma |
| NAFLD: Non-alcoholic fatty liver disease |
| ∗log2FC in expression of this searched gene in stem-like cells from each diseased tissue sample relative to stem-like cells in normal samples in each tissue plotted against the malignancy continuum. Samples are colored based on if they are from different disease stage. |
Top |
Malignant transformation related pathway analysis |
| Find out the enriched GO biological processes and KEGG pathways involved in transition from healthy to precancer to cancer |
| Tissue | Disease Stage | Enriched GO biological Processes |
| Colorectum | AD |  |
| Colorectum | SER |  |
| Colorectum | MSS |  |
| Colorectum | MSI-H |  |
| Colorectum | FAP |  |
| ∗Top 15 enriched GO BP terms are showed in the bar plot of each disease state in each tissue. Each row represents a significant GO biological process which is colored according to the -log10(p.adjust). |
| Page: 1 2 3 4 5 6 7 8 9 |
| GO ID | Tissue | Disease Stage | Description | Gene Ratio | Bg Ratio | pvalue | p.adjust | Count |
| GO:00442825 | Liver | NAFLD | small molecule catabolic process | 91/1882 | 376/18723 | 8.96e-16 | 1.31e-12 | 91 |
| GO:00066316 | Liver | NAFLD | fatty acid metabolic process | 92/1882 | 390/18723 | 3.38e-15 | 3.29e-12 | 92 |
| GO:00193956 | Liver | NAFLD | fatty acid oxidation | 33/1882 | 103/18723 | 7.58e-10 | 1.53e-07 | 33 |
| GO:00344405 | Liver | NAFLD | lipid oxidation | 33/1882 | 108/18723 | 2.96e-09 | 4.56e-07 | 33 |
| GO:00302585 | Liver | NAFLD | lipid modification | 49/1882 | 212/18723 | 1.97e-08 | 2.17e-06 | 49 |
| GO:00060917 | Liver | NAFLD | generation of precursor metabolites and energy | 84/1882 | 490/18723 | 7.03e-07 | 3.95e-05 | 84 |
| GO:00060666 | Liver | NAFLD | alcohol metabolic process | 62/1882 | 353/18723 | 9.01e-06 | 2.96e-04 | 62 |
| GO:01202545 | Liver | NAFLD | olefinic compound metabolic process | 28/1882 | 153/18723 | 1.28e-03 | 1.45e-02 | 28 |
| GO:00424452 | Liver | NAFLD | hormone metabolic process | 36/1882 | 218/18723 | 1.98e-03 | 1.98e-02 | 36 |
| GO:00421803 | Liver | NAFLD | cellular ketone metabolic process | 35/1882 | 211/18723 | 2.09e-03 | 2.06e-02 | 35 |
| GO:00096367 | Liver | NAFLD | response to toxic substance | 41/1882 | 262/18723 | 2.83e-03 | 2.57e-02 | 41 |
| GO:000609112 | Liver | Cirrhotic | generation of precursor metabolites and energy | 238/4634 | 490/18723 | 6.85e-31 | 1.07e-27 | 238 |
| GO:000663112 | Liver | Cirrhotic | fatty acid metabolic process | 165/4634 | 390/18723 | 1.29e-14 | 1.26e-12 | 165 |
| GO:004428211 | Liver | Cirrhotic | small molecule catabolic process | 151/4634 | 376/18723 | 2.20e-11 | 1.34e-09 | 151 |
| GO:000606612 | Liver | Cirrhotic | alcohol metabolic process | 141/4634 | 353/18723 | 1.57e-10 | 8.03e-09 | 141 |
| GO:001939512 | Liver | Cirrhotic | fatty acid oxidation | 53/4634 | 103/18723 | 4.73e-09 | 1.88e-07 | 53 |
| GO:003444011 | Liver | Cirrhotic | lipid oxidation | 53/4634 | 108/18723 | 3.85e-08 | 1.27e-06 | 53 |
| GO:000963612 | Liver | Cirrhotic | response to toxic substance | 104/4634 | 262/18723 | 5.63e-08 | 1.74e-06 | 104 |
| GO:004218011 | Liver | Cirrhotic | cellular ketone metabolic process | 80/4634 | 211/18723 | 1.40e-05 | 1.95e-04 | 80 |
| GO:00987547 | Liver | Cirrhotic | detoxification | 60/4634 | 152/18723 | 4.09e-05 | 4.86e-04 | 60 |
| Page: 1 2 3 4 5 |
| Pathway ID | Tissue | Disease Stage | Description | Gene Ratio | Bg Ratio | pvalue | p.adjust | qvalue | Count |
| hsa000718 | Liver | NAFLD | Fatty acid degradation | 13/1043 | 43/8465 | 1.46e-03 | 1.71e-02 | 1.38e-02 | 13 |
| hsa0007111 | Liver | NAFLD | Fatty acid degradation | 13/1043 | 43/8465 | 1.46e-03 | 1.71e-02 | 1.38e-02 | 13 |
| hsa0007121 | Liver | Cirrhotic | Fatty acid degradation | 29/2530 | 43/8465 | 3.87e-07 | 4.95e-06 | 3.05e-06 | 29 |
| hsa006208 | Liver | Cirrhotic | Pyruvate metabolism | 29/2530 | 47/8465 | 5.90e-06 | 5.95e-05 | 3.67e-05 | 29 |
| hsa04936 | Liver | Cirrhotic | Alcoholic liver disease | 60/2530 | 142/8465 | 1.07e-03 | 5.85e-03 | 3.61e-03 | 60 |
| hsa000109 | Liver | Cirrhotic | Glycolysis / Gluconeogenesis | 32/2530 | 67/8465 | 1.50e-03 | 7.80e-03 | 4.81e-03 | 32 |
| hsa0007131 | Liver | Cirrhotic | Fatty acid degradation | 29/2530 | 43/8465 | 3.87e-07 | 4.95e-06 | 3.05e-06 | 29 |
| hsa0062011 | Liver | Cirrhotic | Pyruvate metabolism | 29/2530 | 47/8465 | 5.90e-06 | 5.95e-05 | 3.67e-05 | 29 |
| hsa049361 | Liver | Cirrhotic | Alcoholic liver disease | 60/2530 | 142/8465 | 1.07e-03 | 5.85e-03 | 3.61e-03 | 60 |
| hsa0001012 | Liver | Cirrhotic | Glycolysis / Gluconeogenesis | 32/2530 | 67/8465 | 1.50e-03 | 7.80e-03 | 4.81e-03 | 32 |
| hsa0062021 | Liver | HCC | Pyruvate metabolism | 37/4020 | 47/8465 | 1.10e-05 | 8.03e-05 | 4.46e-05 | 37 |
| hsa0007141 | Liver | HCC | Fatty acid degradation | 33/4020 | 43/8465 | 8.41e-05 | 4.27e-04 | 2.37e-04 | 33 |
| hsa049362 | Liver | HCC | Alcoholic liver disease | 89/4020 | 142/8465 | 1.73e-04 | 8.53e-04 | 4.75e-04 | 89 |
| hsa0001022 | Liver | HCC | Glycolysis / Gluconeogenesis | 43/4020 | 67/8465 | 4.26e-03 | 1.29e-02 | 7.15e-03 | 43 |
| hsa0062031 | Liver | HCC | Pyruvate metabolism | 37/4020 | 47/8465 | 1.10e-05 | 8.03e-05 | 4.46e-05 | 37 |
| hsa0007151 | Liver | HCC | Fatty acid degradation | 33/4020 | 43/8465 | 8.41e-05 | 4.27e-04 | 2.37e-04 | 33 |
| hsa049363 | Liver | HCC | Alcoholic liver disease | 89/4020 | 142/8465 | 1.73e-04 | 8.53e-04 | 4.75e-04 | 89 |
| hsa0001032 | Liver | HCC | Glycolysis / Gluconeogenesis | 43/4020 | 67/8465 | 4.26e-03 | 1.29e-02 | 7.15e-03 | 43 |
| hsa000108 | Stomach | GC | Glycolysis / Gluconeogenesis | 14/708 | 67/8465 | 1.08e-03 | 7.69e-03 | 5.41e-03 | 14 |
| hsa00980 | Stomach | GC | Metabolism of xenobiotics by cytochrome P450 | 15/708 | 78/8465 | 1.77e-03 | 1.16e-02 | 8.15e-03 | 15 |
| Page: 1 2 |
Top |
Cell-cell communication analysis |
| Identification of potential cell-cell interactions between two cell types and their ligand-receptor pairs for different disease states |
| Ligand | Receptor | LRpair | Pathway | Tissue | Disease Stage |
| Page: 1 |
Top |
Single-cell gene regulatory network inference analysis |
| Find out the significant the regulons (TFs) and the target genes of each regulon across cell types for different disease states |
| TF | Cell Type | Tissue | Disease Stage | Target Gene | RSS | Regulon Activity |
| ∗The dot plots of a searched regulon are shown for all cell subpopulations in each disease state of each tissue based on the regulon specific score inferred using pySCENIC and by calculating the average expression. |
| Page: 1 |
Top |
Somatic mutation of malignant transformation related genes |
| Annotation of somatic variants for genes involved in malignant transformation |
| Hugo Symbol | Variant Class | Variant Classification | dbSNP RS | HGVSc | HGVSp | HGVSp Short | SWISSPROT | BIOTYPE | SIFT | PolyPhen | Tumor Sample Barcode | Tissue | Histology | Sex | Age | Stage | Therapy Types | Drugs | Outcome |
| ADH4 | SNV | Missense_Mutation | novel | c.677G>A | p.Gly226Glu | p.G226E | P08319 | protein_coding | deleterious(0) | probably_damaging(1) | TCGA-AN-A046-01 | Breast | breast invasive carcinoma | Female | >=65 | I/II | Unknown | Unknown | SD |
| ADH4 | SNV | Missense_Mutation | novel | c.566N>A | p.Ala189Glu | p.A189E | P08319 | protein_coding | deleterious(0) | probably_damaging(0.993) | TCGA-OL-A5RU-01 | Breast | breast invasive carcinoma | Female | <65 | I/II | Chemotherapy | cyclophosphamide | CR |
| ADH4 | SNV | Missense_Mutation | novel | c.559N>A | p.Asp187Asn | p.D187N | P08319 | protein_coding | tolerated(0.14) | benign(0.25) | TCGA-C5-A905-01 | Cervix | cervical & endocervical cancer | Female | <65 | I/II | Unknown | Unknown | SD |
| ADH4 | SNV | Missense_Mutation | c.1153G>C | p.Asp385His | p.D385H | P08319 | protein_coding | tolerated(0.06) | benign(0.142) | TCGA-DR-A0ZM-01 | Cervix | cervical & endocervical cancer | Female | <65 | III/IV | Unspecific | Cisplatin | SD | |
| ADH4 | SNV | Missense_Mutation | novel | c.495N>A | p.Phe165Leu | p.F165L | P08319 | protein_coding | tolerated(0.06) | benign(0.224) | TCGA-AA-3984-01 | Colorectum | colon adenocarcinoma | Female | <65 | I/II | Unknown | Unknown | SD |
| ADH4 | SNV | Missense_Mutation | novel | c.1029N>A | p.Phe343Leu | p.F343L | P08319 | protein_coding | tolerated(0.59) | benign(0.057) | TCGA-AG-A002-01 | Colorectum | rectum adenocarcinoma | Male | <65 | I/II | Unknown | Unknown | SD |
| ADH4 | SNV | Missense_Mutation | novel | c.1089G>T | p.Lys363Asn | p.K363N | P08319 | protein_coding | tolerated(0.09) | benign(0.024) | TCGA-A5-A0G1-01 | Endometrium | uterine corpus endometrioid carcinoma | Female | >=65 | I/II | Unknown | Unknown | SD |
| ADH4 | SNV | Missense_Mutation | c.220N>A | p.Asp74Asn | p.D74N | P08319 | protein_coding | tolerated(0.36) | benign(0.003) | TCGA-A5-A2K5-01 | Endometrium | uterine corpus endometrioid carcinoma | Female | >=65 | I/II | Unknown | Unknown | SD | |
| ADH4 | SNV | Missense_Mutation | novel | c.643N>G | p.Thr215Ala | p.T215A | P08319 | protein_coding | tolerated(0.07) | benign(0.005) | TCGA-AJ-A3EL-01 | Endometrium | uterine corpus endometrioid carcinoma | Female | <65 | I/II | Unknown | Unknown | SD |
| ADH4 | SNV | Missense_Mutation | novel | c.1046N>T | p.Ser349Ile | p.S349I | P08319 | protein_coding | deleterious(0.01) | probably_damaging(0.956) | TCGA-AP-A1DK-01 | Endometrium | uterine corpus endometrioid carcinoma | Female | <65 | I/II | Unknown | Unknown | SD |
| Page: 1 2 3 4 |
Top |
Related drugs of malignant transformation related genes |
| Identification of chemicals and drugs interact with genes involved in malignant transfromation |
| (DGIdb 4.0) |
| Entrez ID | Symbol | Category | Interaction Types | Drug Claim Name | Drug Name | PMIDs |
| 127 | ADH4 | DRUGGABLE GENOME, ENZYME | ETHANOL | ALCOHOL | 3610585 |
| Page: 1 |

Copyright 2023-Present -The University of Texas Health Science Center at Houston |