
|
|||||
|
 | |
| |
| |
| |
| |
| |
|
Gene: ADH1C |
Gene summary for ADH1C |
| Gene information | Species | Human | Gene symbol | ADH1C | Gene ID | 126 |
| Gene name | alcohol dehydrogenase 1C (class I), gamma polypeptide | |
| Gene Alias | ADH3 | |
| Cytomap | 4q23 | |
| Gene Type | protein-coding | GO ID | GO:0001523 | UniProtAcc | P00326 |
Top |
Malignant transformation analysis |
| Identification of the aberrant gene expression in precancerous and cancerous lesions by comparing the gene expression of stem-like cells in diseased tissues with normal stem cells |
| Entrez ID | Symbol | Replicates | Species | Organ | Tissue | Adj P-value | Log2FC | Malignancy |
| 126 | ADH1C | HTA11_3410_2000001011 | Human | Colorectum | AD | 2.98e-34 | 7.35e-01 | 0.0155 |
| 126 | ADH1C | HTA11_2487_2000001011 | Human | Colorectum | SER | 2.96e-22 | 1.02e+00 | -0.1808 |
| 126 | ADH1C | HTA11_2951_2000001011 | Human | Colorectum | AD | 1.37e-13 | 8.34e-01 | 0.0216 |
| 126 | ADH1C | HTA11_1938_2000001011 | Human | Colorectum | AD | 5.71e-13 | 1.01e+00 | -0.0811 |
| 126 | ADH1C | HTA11_78_2000001011 | Human | Colorectum | AD | 3.29e-37 | 2.10e+00 | -0.1088 |
| 126 | ADH1C | HTA11_347_2000001011 | Human | Colorectum | AD | 3.28e-94 | 2.38e+00 | -0.1954 |
| 126 | ADH1C | HTA11_411_2000001011 | Human | Colorectum | SER | 2.24e-10 | 1.11e+00 | -0.2602 |
| 126 | ADH1C | HTA11_3361_2000001011 | Human | Colorectum | AD | 3.18e-24 | 8.92e-01 | -0.1207 |
| 126 | ADH1C | HTA11_83_2000001011 | Human | Colorectum | SER | 3.39e-47 | 2.22e+00 | -0.1526 |
| 126 | ADH1C | HTA11_696_2000001011 | Human | Colorectum | AD | 9.32e-35 | 9.98e-01 | -0.1464 |
| 126 | ADH1C | HTA11_866_2000001011 | Human | Colorectum | AD | 4.66e-31 | 8.33e-01 | -0.1001 |
| 126 | ADH1C | HTA11_1391_2000001011 | Human | Colorectum | AD | 2.80e-51 | 1.94e+00 | -0.059 |
| 126 | ADH1C | HTA11_2992_2000001011 | Human | Colorectum | SER | 5.35e-10 | 8.78e-01 | -0.1706 |
| 126 | ADH1C | HTA11_5212_2000001011 | Human | Colorectum | AD | 7.74e-19 | 1.04e+00 | -0.2061 |
| 126 | ADH1C | HTA11_5216_2000001011 | Human | Colorectum | SER | 9.51e-21 | 1.59e+00 | -0.1462 |
| 126 | ADH1C | HTA11_546_2000001011 | Human | Colorectum | AD | 7.27e-32 | 1.56e+00 | -0.0842 |
| 126 | ADH1C | HTA11_9341_2000001011 | Human | Colorectum | SER | 1.01e-19 | 1.31e+00 | -0.00410000000000005 |
| 126 | ADH1C | HTA11_7862_2000001011 | Human | Colorectum | AD | 3.52e-54 | 2.25e+00 | -0.0179 |
| 126 | ADH1C | HTA11_866_3004761011 | Human | Colorectum | AD | 6.68e-29 | 8.14e-01 | 0.096 |
| 126 | ADH1C | HTA11_4255_2000001011 | Human | Colorectum | SER | 9.39e-15 | 1.26e+00 | 0.0446 |
| Page: 1 2 3 4 5 |
| Tissue | Expression Dynamics | Abbreviation |
| Colorectum (GSE201348) |  | FAP: Familial adenomatous polyposis |
| CRC: Colorectal cancer | ||
| Colorectum (HTA11) |  | AD: Adenomas |
| SER: Sessile serrated lesions | ||
| MSI-H: Microsatellite-high colorectal cancer | ||
| MSS: Microsatellite stable colorectal cancer | ||
| Esophagus |  | ESCC: Esophageal squamous cell carcinoma |
| HGIN: High-grade intraepithelial neoplasias | ||
| LGIN: Low-grade intraepithelial neoplasias | ||
| GC |  | CAG: Chronic atrophic gastritis |
| CAG with IM: Chronic atrophic gastritis with intestinal metaplasia | ||
| CSG: Chronic superficial gastritis | ||
| GC: Gastric cancer | ||
| SIM: Severe intestinal metaplasia | ||
| WIM: Wild intestinal metaplasia | ||
| Oral Cavity | 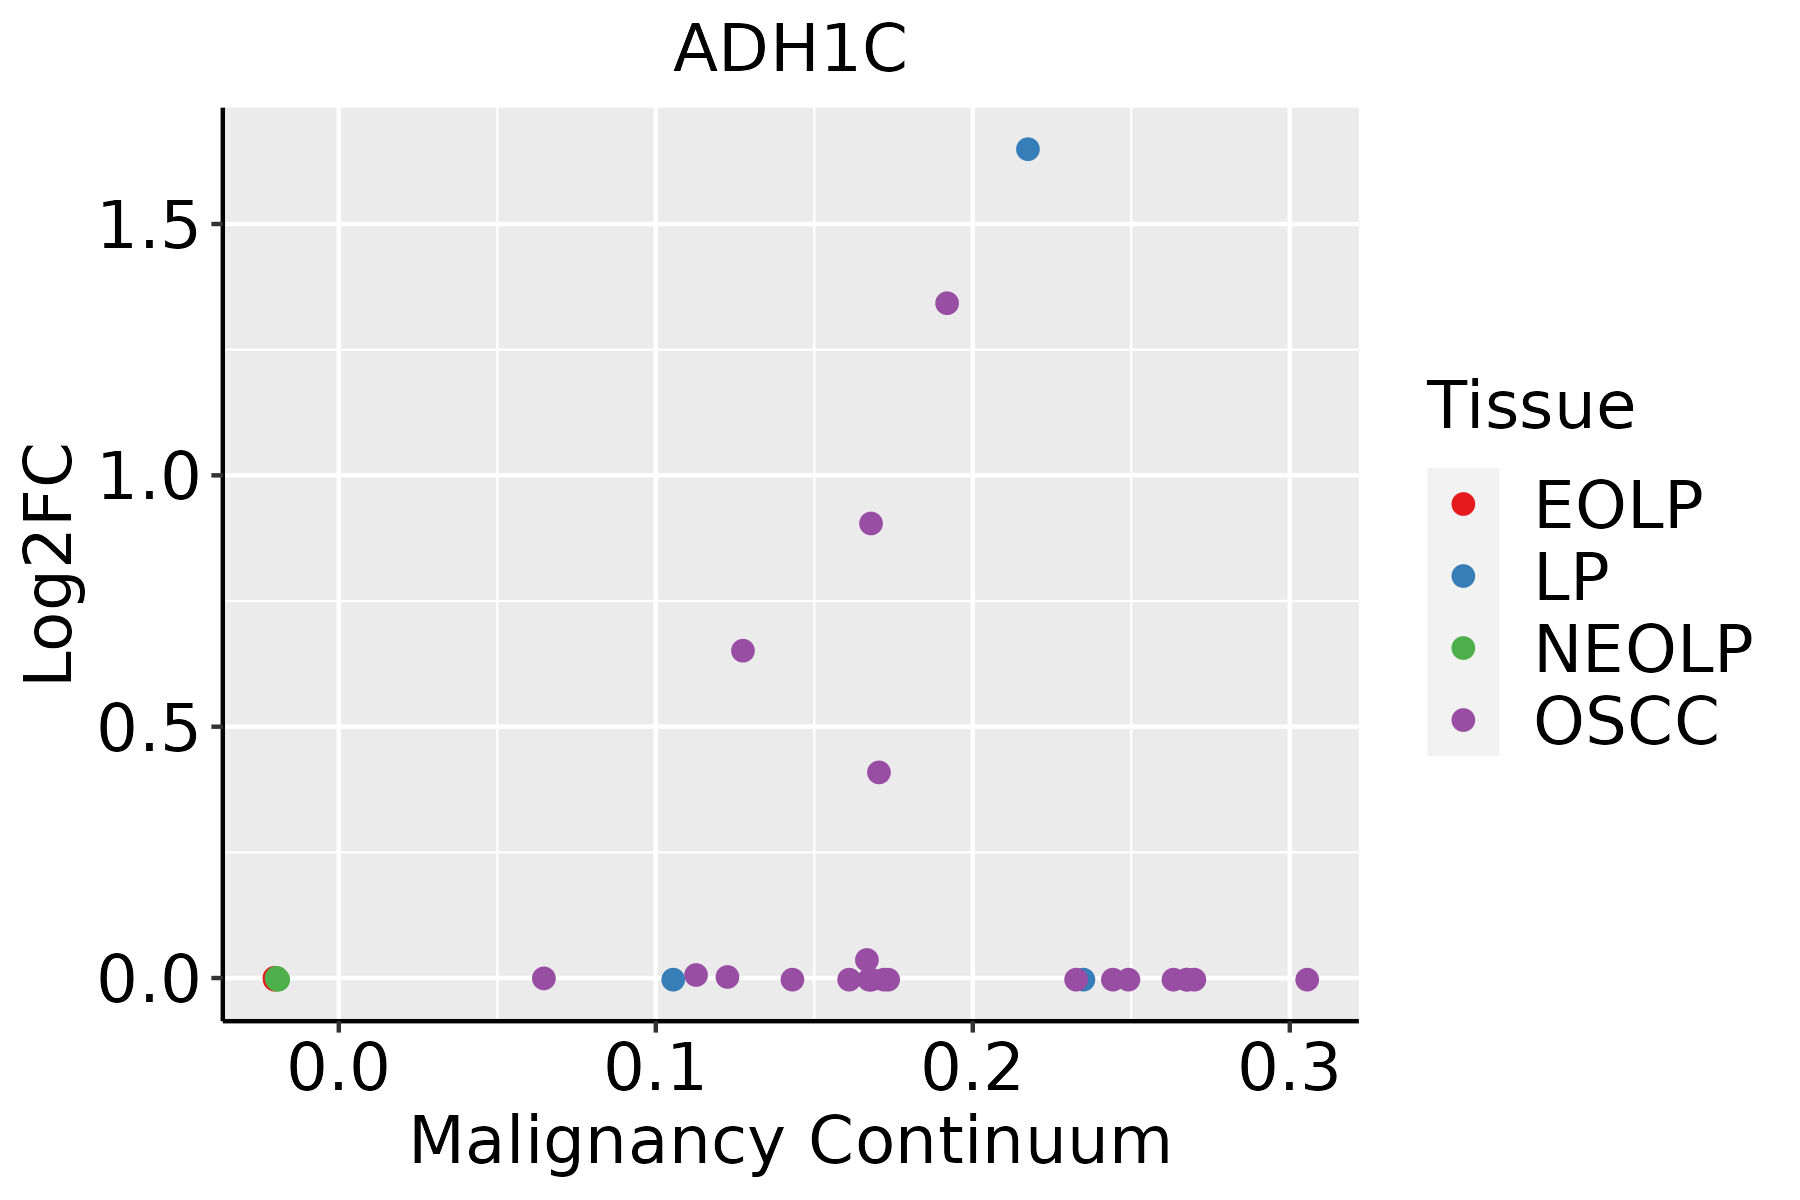 | EOLP: Erosive Oral lichen planus |
| LP: leukoplakia | ||
| NEOLP: Non-erosive oral lichen planus | ||
| OSCC: Oral squamous cell carcinoma |
| ∗log2FC in expression of this searched gene in stem-like cells from each diseased tissue sample relative to stem-like cells in normal samples in each tissue plotted against the malignancy continuum. Samples are colored based on if they are from different disease stage. |
Top |
Malignant transformation related pathway analysis |
| Find out the enriched GO biological processes and KEGG pathways involved in transition from healthy to precancer to cancer |
| Tissue | Disease Stage | Enriched GO biological Processes |
| Colorectum | AD |  |
| Colorectum | SER |  |
| Colorectum | MSS |  |
| Colorectum | MSI-H |  |
| Colorectum | FAP |  |
| ∗Top 15 enriched GO BP terms are showed in the bar plot of each disease state in each tissue. Each row represents a significant GO biological process which is colored according to the -log10(p.adjust). |
| Page: 1 2 3 4 5 6 7 8 9 |
| GO ID | Tissue | Disease Stage | Description | Gene Ratio | Bg Ratio | pvalue | p.adjust | Count |
| GO:0006091 | Colorectum | AD | generation of precursor metabolites and energy | 209/3918 | 490/18723 | 3.17e-28 | 6.61e-25 | 209 |
| GO:0006066 | Colorectum | AD | alcohol metabolic process | 106/3918 | 353/18723 | 3.02e-05 | 5.57e-04 | 106 |
| GO:0034308 | Colorectum | AD | primary alcohol metabolic process | 35/3918 | 102/18723 | 1.16e-03 | 1.05e-02 | 35 |
| GO:0006067 | Colorectum | AD | ethanol metabolic process | 11/3918 | 21/18723 | 1.43e-03 | 1.22e-02 | 11 |
| GO:00060911 | Colorectum | SER | generation of precursor metabolites and energy | 168/2897 | 490/18723 | 1.39e-25 | 1.70e-22 | 168 |
| GO:00060661 | Colorectum | SER | alcohol metabolic process | 79/2897 | 353/18723 | 3.50e-04 | 5.50e-03 | 79 |
| GO:00343081 | Colorectum | SER | primary alcohol metabolic process | 26/2897 | 102/18723 | 5.87e-03 | 4.29e-02 | 26 |
| GO:00060912 | Colorectum | MSS | generation of precursor metabolites and energy | 186/3467 | 490/18723 | 1.14e-24 | 2.15e-21 | 186 |
| GO:00060662 | Colorectum | MSS | alcohol metabolic process | 92/3467 | 353/18723 | 2.57e-04 | 3.46e-03 | 92 |
| GO:000609120 | Esophagus | HGIN | generation of precursor metabolites and energy | 145/2587 | 490/18723 | 3.41e-20 | 2.04e-17 | 145 |
| GO:0006091110 | Esophagus | ESCC | generation of precursor metabolites and energy | 331/8552 | 490/18723 | 3.86e-23 | 8.45e-21 | 331 |
| GO:00060668 | Esophagus | ESCC | alcohol metabolic process | 202/8552 | 353/18723 | 7.32e-06 | 7.26e-05 | 202 |
| GO:000609118 | Oral cavity | OSCC | generation of precursor metabolites and energy | 286/7305 | 490/18723 | 1.45e-18 | 1.71e-16 | 286 |
| GO:00060667 | Oral cavity | OSCC | alcohol metabolic process | 179/7305 | 353/18723 | 4.54e-06 | 5.21e-05 | 179 |
| GO:00067203 | Oral cavity | OSCC | isoprenoid metabolic process | 59/7305 | 116/18723 | 6.18e-03 | 2.33e-02 | 59 |
| GO:00060916 | Stomach | GC | generation of precursor metabolites and energy | 88/1159 | 490/18723 | 6.82e-20 | 9.27e-17 | 88 |
| GO:0120254 | Stomach | GC | olefinic compound metabolic process | 25/1159 | 153/18723 | 7.68e-06 | 2.77e-04 | 25 |
| GO:00343084 | Stomach | GC | primary alcohol metabolic process | 19/1159 | 102/18723 | 1.40e-05 | 4.54e-04 | 19 |
| GO:00060665 | Stomach | GC | alcohol metabolic process | 41/1159 | 353/18723 | 7.85e-05 | 1.68e-03 | 41 |
| GO:0042445 | Stomach | GC | hormone metabolic process | 29/1159 | 218/18723 | 8.22e-05 | 1.75e-03 | 29 |
| Page: 1 2 3 |
| Pathway ID | Tissue | Disease Stage | Description | Gene Ratio | Bg Ratio | pvalue | p.adjust | qvalue | Count |
| hsa00620 | Colorectum | AD | Pyruvate metabolism | 28/2092 | 47/8465 | 3.71e-07 | 5.41e-06 | 3.45e-06 | 28 |
| hsa00010 | Colorectum | AD | Glycolysis / Gluconeogenesis | 34/2092 | 67/8465 | 3.63e-06 | 4.34e-05 | 2.77e-05 | 34 |
| hsa00071 | Colorectum | AD | Fatty acid degradation | 20/2092 | 43/8465 | 1.50e-03 | 8.69e-03 | 5.54e-03 | 20 |
| hsa006201 | Colorectum | AD | Pyruvate metabolism | 28/2092 | 47/8465 | 3.71e-07 | 5.41e-06 | 3.45e-06 | 28 |
| hsa000101 | Colorectum | AD | Glycolysis / Gluconeogenesis | 34/2092 | 67/8465 | 3.63e-06 | 4.34e-05 | 2.77e-05 | 34 |
| hsa000711 | Colorectum | AD | Fatty acid degradation | 20/2092 | 43/8465 | 1.50e-03 | 8.69e-03 | 5.54e-03 | 20 |
| hsa006202 | Colorectum | SER | Pyruvate metabolism | 22/1580 | 47/8465 | 9.62e-06 | 1.33e-04 | 9.67e-05 | 22 |
| hsa000102 | Colorectum | SER | Glycolysis / Gluconeogenesis | 24/1580 | 67/8465 | 6.62e-04 | 5.36e-03 | 3.89e-03 | 24 |
| hsa000712 | Colorectum | SER | Fatty acid degradation | 15/1580 | 43/8465 | 8.60e-03 | 4.26e-02 | 3.09e-02 | 15 |
| hsa006203 | Colorectum | SER | Pyruvate metabolism | 22/1580 | 47/8465 | 9.62e-06 | 1.33e-04 | 9.67e-05 | 22 |
| hsa000103 | Colorectum | SER | Glycolysis / Gluconeogenesis | 24/1580 | 67/8465 | 6.62e-04 | 5.36e-03 | 3.89e-03 | 24 |
| hsa000713 | Colorectum | SER | Fatty acid degradation | 15/1580 | 43/8465 | 8.60e-03 | 4.26e-02 | 3.09e-02 | 15 |
| hsa006204 | Colorectum | MSS | Pyruvate metabolism | 24/1875 | 47/8465 | 1.25e-05 | 1.35e-04 | 8.27e-05 | 24 |
| hsa000104 | Colorectum | MSS | Glycolysis / Gluconeogenesis | 28/1875 | 67/8465 | 2.36e-04 | 1.81e-03 | 1.11e-03 | 28 |
| hsa000714 | Colorectum | MSS | Fatty acid degradation | 17/1875 | 43/8465 | 7.50e-03 | 2.86e-02 | 1.75e-02 | 17 |
| hsa006205 | Colorectum | MSS | Pyruvate metabolism | 24/1875 | 47/8465 | 1.25e-05 | 1.35e-04 | 8.27e-05 | 24 |
| hsa000105 | Colorectum | MSS | Glycolysis / Gluconeogenesis | 28/1875 | 67/8465 | 2.36e-04 | 1.81e-03 | 1.11e-03 | 28 |
| hsa000715 | Colorectum | MSS | Fatty acid degradation | 17/1875 | 43/8465 | 7.50e-03 | 2.86e-02 | 1.75e-02 | 17 |
| hsa0062010 | Esophagus | HGIN | Pyruvate metabolism | 16/1383 | 47/8465 | 2.27e-03 | 1.95e-02 | 1.55e-02 | 16 |
| hsa0062013 | Esophagus | HGIN | Pyruvate metabolism | 16/1383 | 47/8465 | 2.27e-03 | 1.95e-02 | 1.55e-02 | 16 |
| Page: 1 2 |
Top |
Cell-cell communication analysis |
| Identification of potential cell-cell interactions between two cell types and their ligand-receptor pairs for different disease states |
| Ligand | Receptor | LRpair | Pathway | Tissue | Disease Stage |
| Page: 1 |
Top |
Single-cell gene regulatory network inference analysis |
| Find out the significant the regulons (TFs) and the target genes of each regulon across cell types for different disease states |
| TF | Cell Type | Tissue | Disease Stage | Target Gene | RSS | Regulon Activity |
| ∗The dot plots of a searched regulon are shown for all cell subpopulations in each disease state of each tissue based on the regulon specific score inferred using pySCENIC and by calculating the average expression. |
| Page: 1 |
Top |
Somatic mutation of malignant transformation related genes |
| Annotation of somatic variants for genes involved in malignant transformation |
| Hugo Symbol | Variant Class | Variant Classification | dbSNP RS | HGVSc | HGVSp | HGVSp Short | SWISSPROT | BIOTYPE | SIFT | PolyPhen | Tumor Sample Barcode | Tissue | Histology | Sex | Age | Stage | Therapy Types | Drugs | Outcome |
| ADH1C | SNV | Missense_Mutation | novel | c.1112N>T | p.Thr371Ile | p.T371I | P00326 | protein_coding | deleterious(0.02) | benign(0.316) | TCGA-AC-A23H-01 | Breast | breast invasive carcinoma | Female | >=65 | I/II | Unknown | Unknown | PD |
| ADH1C | SNV | Missense_Mutation | novel | c.386G>A | p.Arg129Lys | p.R129K | P00326 | protein_coding | deleterious(0.03) | benign(0.003) | TCGA-AN-A0AL-01 | Breast | breast invasive carcinoma | Female | <65 | III/IV | Unknown | Unknown | SD |
| ADH1C | SNV | Missense_Mutation | novel | c.212N>A | p.Ala71Asp | p.A71D | P00326 | protein_coding | deleterious(0) | possibly_damaging(0.75) | TCGA-BH-A0B1-01 | Breast | breast invasive carcinoma | Female | >=65 | I/II | Chemotherapy | adriamycin | SD |
| ADH1C | SNV | Missense_Mutation | rs778107991 | c.941N>T | p.Thr314Met | p.T314M | P00326 | protein_coding | deleterious(0.05) | possibly_damaging(0.63) | TCGA-BH-A204-01 | Breast | breast invasive carcinoma | Female | >=65 | I/II | Unknown | Unknown | SD |
| ADH1C | SNV | Missense_Mutation | novel | c.286N>A | p.Pro96Thr | p.P96T | P00326 | protein_coding | deleterious(0) | probably_damaging(0.995) | TCGA-D8-A1XM-01 | Breast | breast invasive carcinoma | Female | <65 | I/II | Unknown | Unknown | SD |
| ADH1C | deletion | Frame_Shift_Del | novel | c.18delN | p.Val7Ter | p.V7* | P00326 | protein_coding | TCGA-A7-A13E-01 | Breast | breast invasive carcinoma | Female | <65 | I/II | Targeted Molecular therapy | bevacizumab | PD | ||
| ADH1C | deletion | Frame_Shift_Del | novel | c.317delN | p.Asn106ThrfsTer8 | p.N106Tfs*8 | P00326 | protein_coding | TCGA-EW-A2FV-01 | Breast | breast invasive carcinoma | Female | <65 | III/IV | Chemotherapy | docetaxel | SD | ||
| ADH1C | SNV | Missense_Mutation | rs759025388 | c.142C>T | p.Arg48Cys | p.R48C | P00326 | protein_coding | tolerated(0.06) | benign(0.029) | TCGA-2W-A8YY-01 | Cervix | cervical & endocervical cancer | Female | <65 | I/II | Chemotherapy | cisplatin | CR |
| ADH1C | SNV | Missense_Mutation | novel | c.797C>T | p.Ser266Leu | p.S266L | P00326 | protein_coding | deleterious(0) | probably_damaging(0.932) | TCGA-ZJ-AB0H-01 | Cervix | cervical & endocervical cancer | Female | <65 | III/IV | Unknown | Unknown | SD |
| ADH1C | SNV | Missense_Mutation | novel | c.952N>A | p.Ala318Thr | p.A318T | P00326 | protein_coding | tolerated(1) | benign(0.058) | TCGA-A6-5660-01 | Colorectum | colon adenocarcinoma | Male | >=65 | III/IV | Ancillary | leucovorin | SD |
| Page: 1 2 3 4 5 6 7 |
Top |
Related drugs of malignant transformation related genes |
| Identification of chemicals and drugs interact with genes involved in malignant transfromation |
| (DGIdb 4.0) |
| Entrez ID | Symbol | Category | Interaction Types | Drug Claim Name | Drug Name | PMIDs |
| 126 | ADH1C | ENZYME, DRUGGABLE GENOME | FOMEPIZOLE | FOMEPIZOLE | ||
| 126 | ADH1C | ENZYME, DRUGGABLE GENOME | cyclophosphamide | CYCLOPHOSPHAMIDE | 24533712 | |
| 126 | ADH1C | ENZYME, DRUGGABLE GENOME | inhibitor | CHEMBL1308 | FOMEPIZOLE | |
| 126 | ADH1C | ENZYME, DRUGGABLE GENOME | cisplatin | CISPLATIN | 24533712 | |
| 126 | ADH1C | ENZYME, DRUGGABLE GENOME | FOMEPIZOLE | FOMEPIZOLE | ||
| 126 | ADH1C | ENZYME, DRUGGABLE GENOME | RETINOIC ACID | 11959987 | ||
| 126 | ADH1C | ENZYME, DRUGGABLE GENOME | abacavir | ABACAVIR | 24625462 | |
| 126 | ADH1C | ENZYME, DRUGGABLE GENOME | ethanol | ALCOHOL | 14693654,32451486 |
| Page: 1 |

Copyright 2023-Present -The University of Texas Health Science Center at Houston |