
|
|||||
|
 | |
| |
| |
| |
| |
| |
|
Gene: ADGRV1 |
Gene summary for ADGRV1 |
| Gene information | Species | Human | Gene symbol | ADGRV1 | Gene ID | 84059 |
| Gene name | adhesion G protein-coupled receptor V1 | |
| Gene Alias | FEB4 | |
| Cytomap | 5q14.3 | |
| Gene Type | protein-coding | GO ID | GO:0001503 | UniProtAcc | Q8WXG9 |
Top |
Malignant transformation analysis |
| Identification of the aberrant gene expression in precancerous and cancerous lesions by comparing the gene expression of stem-like cells in diseased tissues with normal stem cells |
| Entrez ID | Symbol | Replicates | Species | Organ | Tissue | Adj P-value | Log2FC | Malignancy |
| 84059 | ADGRV1 | LZE4T | Human | Esophagus | ESCC | 8.22e-04 | 1.65e-01 | 0.0811 |
| 84059 | ADGRV1 | LZE7T | Human | Esophagus | ESCC | 6.18e-06 | 3.83e-01 | 0.0667 |
| 84059 | ADGRV1 | LZE8T | Human | Esophagus | ESCC | 1.11e-11 | 2.79e-01 | 0.067 |
| 84059 | ADGRV1 | LZE20T | Human | Esophagus | ESCC | 1.31e-02 | 1.17e-01 | 0.0662 |
| 84059 | ADGRV1 | LZE24T | Human | Esophagus | ESCC | 6.82e-35 | 1.06e+00 | 0.0596 |
| 84059 | ADGRV1 | P1T-E | Human | Esophagus | ESCC | 4.15e-02 | 2.66e-01 | 0.0875 |
| 84059 | ADGRV1 | P2T-E | Human | Esophagus | ESCC | 7.00e-20 | 2.94e-01 | 0.1177 |
| 84059 | ADGRV1 | P4T-E | Human | Esophagus | ESCC | 9.59e-03 | 8.85e-02 | 0.1323 |
| 84059 | ADGRV1 | P5T-E | Human | Esophagus | ESCC | 3.55e-03 | 3.59e-02 | 0.1327 |
| 84059 | ADGRV1 | P8T-E | Human | Esophagus | ESCC | 4.73e-21 | 3.77e-01 | 0.0889 |
| 84059 | ADGRV1 | P9T-E | Human | Esophagus | ESCC | 3.37e-07 | 1.61e-01 | 0.1131 |
| 84059 | ADGRV1 | P10T-E | Human | Esophagus | ESCC | 4.72e-08 | 1.79e-01 | 0.116 |
| 84059 | ADGRV1 | P11T-E | Human | Esophagus | ESCC | 6.72e-11 | 4.91e-01 | 0.1426 |
| 84059 | ADGRV1 | P12T-E | Human | Esophagus | ESCC | 1.05e-17 | 3.65e-01 | 0.1122 |
| 84059 | ADGRV1 | P15T-E | Human | Esophagus | ESCC | 1.67e-09 | 2.47e-01 | 0.1149 |
| 84059 | ADGRV1 | P16T-E | Human | Esophagus | ESCC | 4.83e-11 | 5.56e-02 | 0.1153 |
| 84059 | ADGRV1 | P20T-E | Human | Esophagus | ESCC | 1.39e-40 | 7.93e-01 | 0.1124 |
| 84059 | ADGRV1 | P21T-E | Human | Esophagus | ESCC | 7.10e-07 | 6.09e-02 | 0.1617 |
| 84059 | ADGRV1 | P22T-E | Human | Esophagus | ESCC | 6.93e-16 | 2.55e-01 | 0.1236 |
| 84059 | ADGRV1 | P23T-E | Human | Esophagus | ESCC | 1.48e-09 | 3.40e-01 | 0.108 |
| Page: 1 2 3 4 5 |
| Tissue | Expression Dynamics | Abbreviation |
| Esophagus | 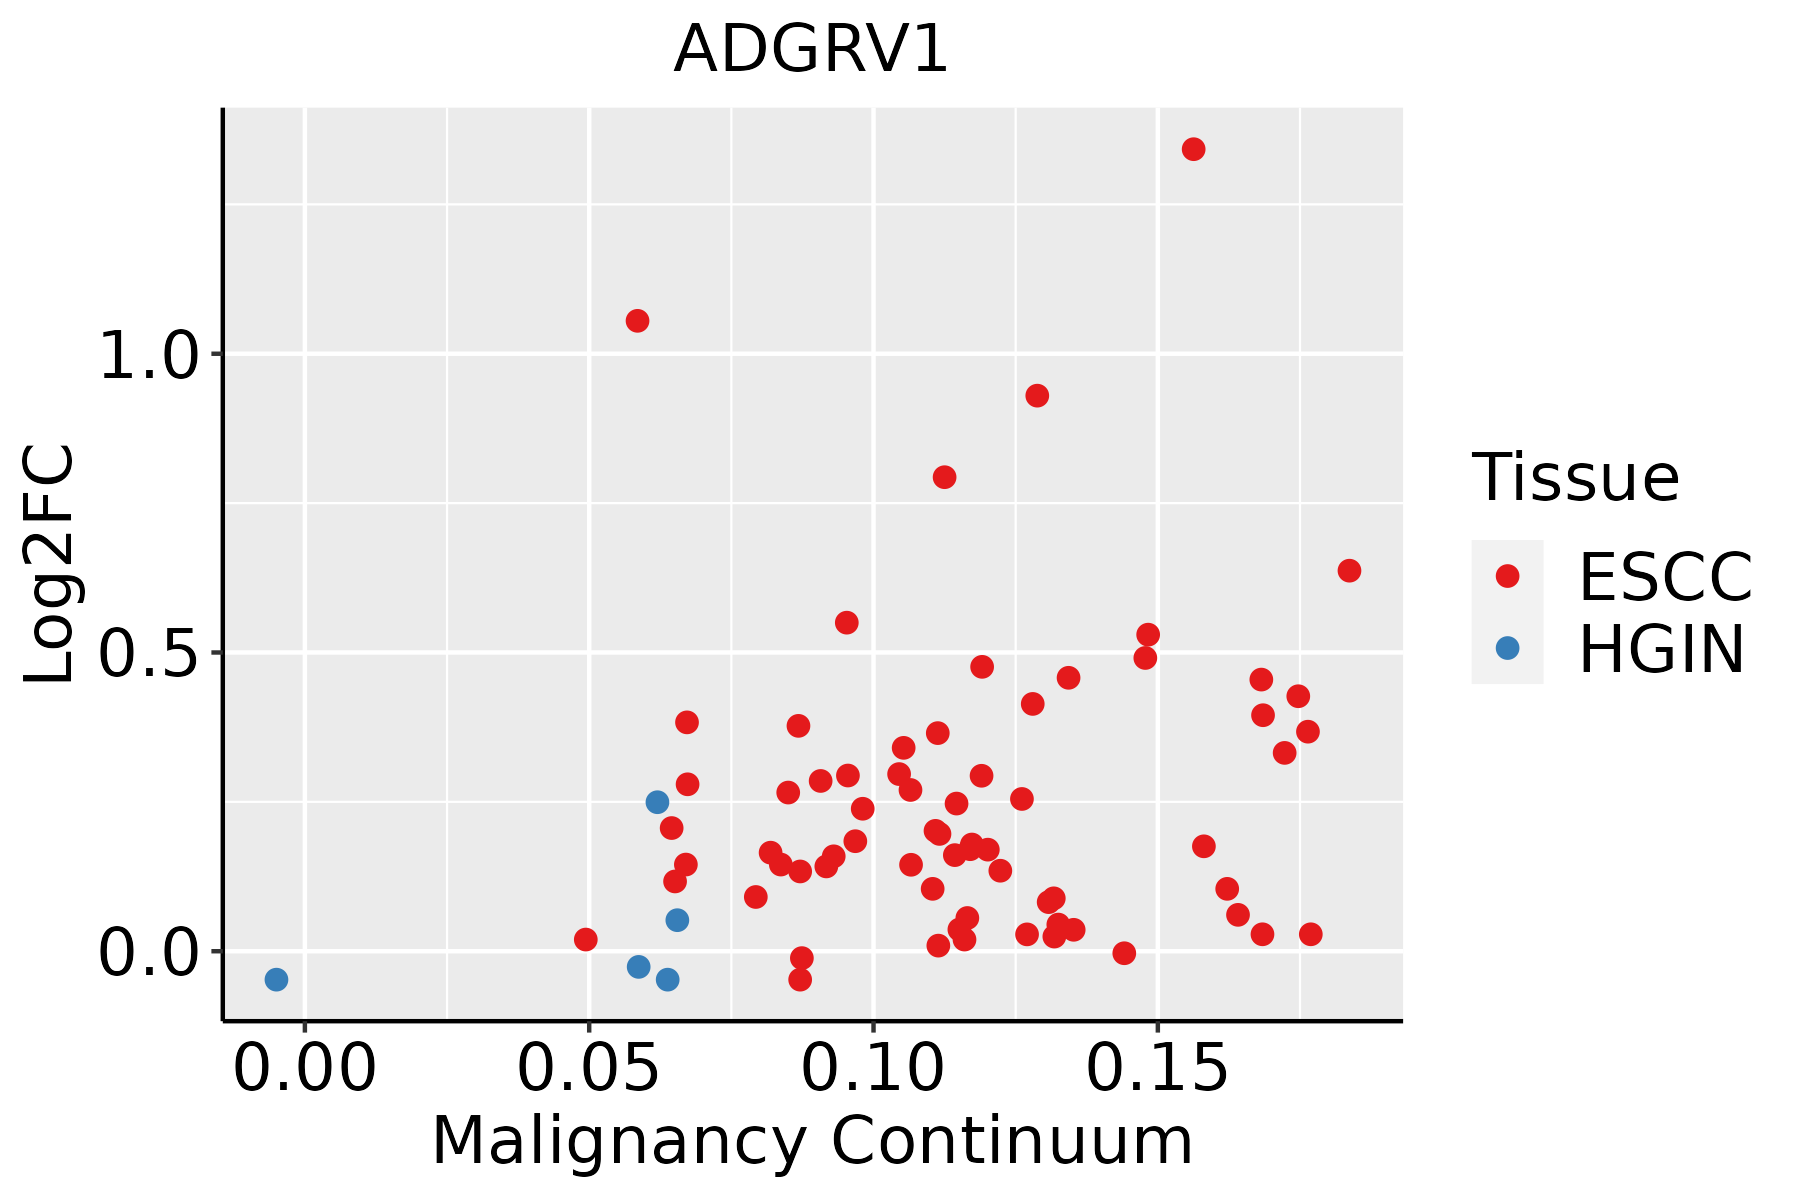 | ESCC: Esophageal squamous cell carcinoma |
| HGIN: High-grade intraepithelial neoplasias | ||
| LGIN: Low-grade intraepithelial neoplasias | ||
| Lung | 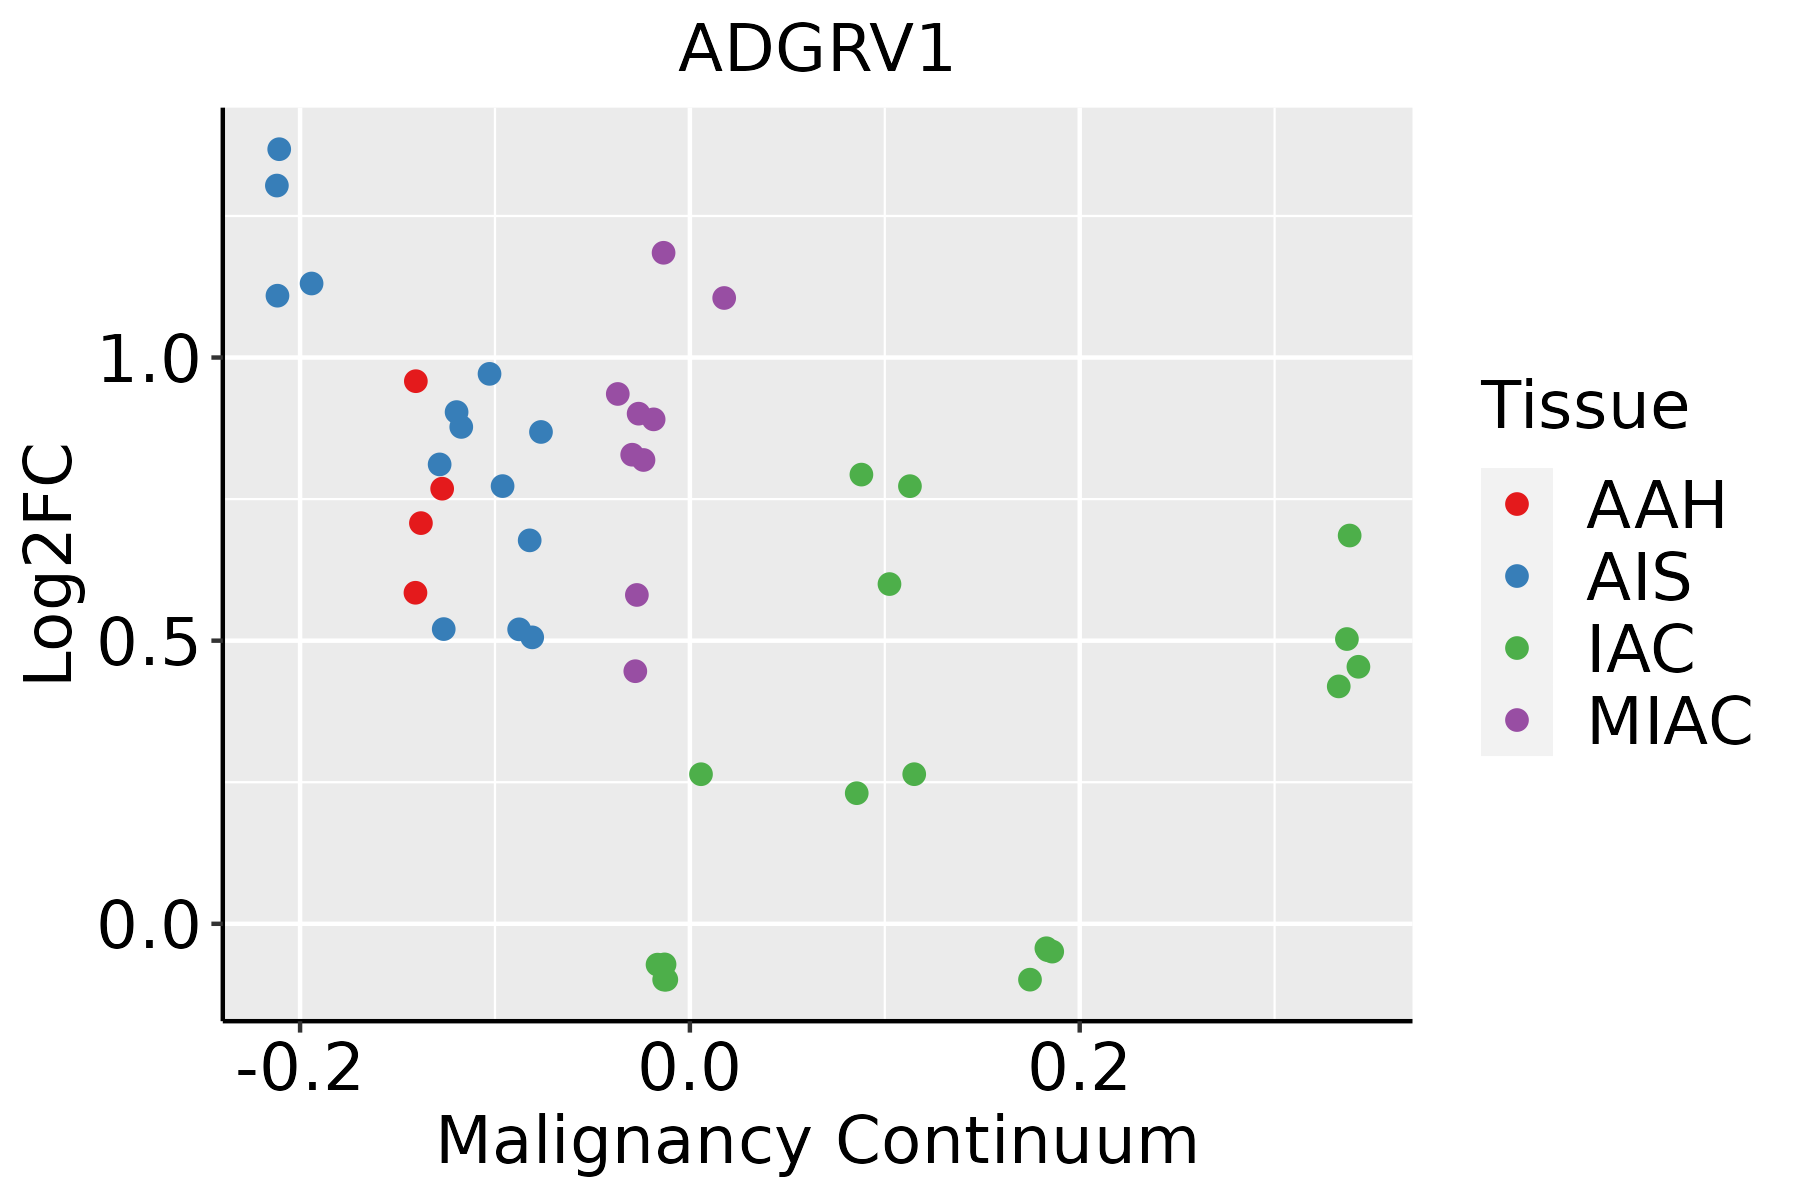 | AAH: Atypical adenomatous hyperplasia |
| AIS: Adenocarcinoma in situ | ||
| IAC: Invasive lung adenocarcinoma | ||
| MIA: Minimally invasive adenocarcinoma | ||
| Oral Cavity |  | EOLP: Erosive Oral lichen planus |
| LP: leukoplakia | ||
| NEOLP: Non-erosive oral lichen planus | ||
| OSCC: Oral squamous cell carcinoma |
| ∗log2FC in expression of this searched gene in stem-like cells from each diseased tissue sample relative to stem-like cells in normal samples in each tissue plotted against the malignancy continuum. Samples are colored based on if they are from different disease stage. |
Top |
Malignant transformation related pathway analysis |
| Find out the enriched GO biological processes and KEGG pathways involved in transition from healthy to precancer to cancer |
| Tissue | Disease Stage | Enriched GO biological Processes |
| Colorectum | AD |  |
| Colorectum | SER |  |
| Colorectum | MSS |  |
| Colorectum | MSI-H |  |
| Colorectum | FAP |  |
| ∗Top 15 enriched GO BP terms are showed in the bar plot of each disease state in each tissue. Each row represents a significant GO biological process which is colored according to the -log10(p.adjust). |
| Page: 1 2 3 4 5 6 7 8 9 |
| GO ID | Tissue | Disease Stage | Description | Gene Ratio | Bg Ratio | pvalue | p.adjust | Count |
| GO:0031647111 | Esophagus | ESCC | regulation of protein stability | 223/8552 | 298/18723 | 5.76e-25 | 1.52e-22 | 223 |
| GO:000150317 | Esophagus | ESCC | ossification | 232/8552 | 408/18723 | 3.00e-06 | 3.40e-05 | 232 |
| GO:001003827 | Esophagus | ESCC | response to metal ion | 208/8552 | 373/18723 | 5.02e-05 | 3.90e-04 | 208 |
| GO:000961216 | Esophagus | ESCC | response to mechanical stimulus | 124/8552 | 216/18723 | 3.30e-04 | 1.94e-03 | 124 |
| GO:007124117 | Esophagus | ESCC | cellular response to inorganic substance | 125/8552 | 226/18723 | 2.17e-03 | 9.67e-03 | 125 |
| GO:00316478 | Lung | IAC | regulation of protein stability | 62/2061 | 298/18723 | 5.37e-07 | 3.32e-05 | 62 |
| GO:00515924 | Lung | IAC | response to calcium ion | 31/2061 | 149/18723 | 3.47e-04 | 5.42e-03 | 31 |
| GO:00100388 | Lung | IAC | response to metal ion | 61/2061 | 373/18723 | 1.02e-03 | 1.22e-02 | 61 |
| GO:00096125 | Lung | IAC | response to mechanical stimulus | 39/2061 | 216/18723 | 1.29e-03 | 1.45e-02 | 39 |
| GO:00018947 | Lung | IAC | tissue homeostasis | 46/2061 | 268/18723 | 1.50e-03 | 1.60e-02 | 46 |
| GO:00602497 | Lung | IAC | anatomical structure homeostasis | 51/2061 | 314/18723 | 2.91e-03 | 2.61e-02 | 51 |
| GO:003164713 | Lung | AIS | regulation of protein stability | 62/1849 | 298/18723 | 1.06e-08 | 1.63e-06 | 62 |
| GO:005159212 | Lung | AIS | response to calcium ion | 30/1849 | 149/18723 | 1.18e-04 | 2.72e-03 | 30 |
| GO:001003813 | Lung | AIS | response to metal ion | 57/1849 | 373/18723 | 5.80e-04 | 9.01e-03 | 57 |
| GO:000189412 | Lung | AIS | tissue homeostasis | 41/1849 | 268/18723 | 3.13e-03 | 3.01e-02 | 41 |
| GO:000189422 | Lung | AAH | tissue homeostasis | 21/613 | 268/18723 | 2.12e-04 | 1.16e-02 | 21 |
| GO:006024912 | Lung | AAH | anatomical structure homeostasis | 23/613 | 314/18723 | 2.89e-04 | 1.45e-02 | 23 |
| GO:003164723 | Lung | MIAC | regulation of protein stability | 36/967 | 298/18723 | 1.93e-06 | 2.42e-04 | 36 |
| GO:001003823 | Lung | MIAC | response to metal ion | 36/967 | 373/18723 | 2.40e-04 | 8.06e-03 | 36 |
| GO:005159222 | Lung | MIAC | response to calcium ion | 18/967 | 149/18723 | 6.87e-04 | 1.59e-02 | 18 |
| Page: 1 2 |
| Pathway ID | Tissue | Disease Stage | Description | Gene Ratio | Bg Ratio | pvalue | p.adjust | qvalue | Count |
| Page: 1 |
Top |
Cell-cell communication analysis |
| Identification of potential cell-cell interactions between two cell types and their ligand-receptor pairs for different disease states |
| Ligand | Receptor | LRpair | Pathway | Tissue | Disease Stage |
| Page: 1 |
Top |
Single-cell gene regulatory network inference analysis |
| Find out the significant the regulons (TFs) and the target genes of each regulon across cell types for different disease states |
| TF | Cell Type | Tissue | Disease Stage | Target Gene | RSS | Regulon Activity |
| ∗The dot plots of a searched regulon are shown for all cell subpopulations in each disease state of each tissue based on the regulon specific score inferred using pySCENIC and by calculating the average expression. |
| Page: 1 |
Top |
Somatic mutation of malignant transformation related genes |
| Annotation of somatic variants for genes involved in malignant transformation |
| Hugo Symbol | Variant Class | Variant Classification | dbSNP RS | HGVSc | HGVSp | HGVSp Short | SWISSPROT | BIOTYPE | SIFT | PolyPhen | Tumor Sample Barcode | Tissue | Histology | Sex | Age | Stage | Therapy Types | Drugs | Outcome |
| ADGRV1 | SNV | Missense_Mutation | novel | c.5062G>A | p.Glu1688Lys | p.E1688K | Q8WXG9 | protein_coding | tolerated(0.08) | possibly_damaging(0.867) | TCGA-5L-AAT0-01 | Breast | breast invasive carcinoma | Female | <65 | I/II | Hormone Therapy | tamoxiphen | SD |
| ADGRV1 | SNV | Missense_Mutation | novel | c.16760C>T | p.Ser5587Phe | p.S5587F | Q8WXG9 | protein_coding | deleterious(0) | probably_damaging(0.909) | TCGA-5L-AAT0-01 | Breast | breast invasive carcinoma | Female | <65 | I/II | Hormone Therapy | tamoxiphen | SD |
| ADGRV1 | SNV | Missense_Mutation | novel | c.16592N>T | p.Ser5531Phe | p.S5531F | Q8WXG9 | protein_coding | tolerated(0.27) | benign(0.347) | TCGA-5L-AAT1-01 | Breast | breast invasive carcinoma | Female | <65 | III/IV | Hormone Therapy | letrozol | SD |
| ADGRV1 | SNV | Missense_Mutation | rs876657822 | c.328N>A | p.Glu110Lys | p.E110K | Q8WXG9 | protein_coding | deleterious(0) | probably_damaging(0.942) | TCGA-A2-A04T-01 | Breast | breast invasive carcinoma | Female | <65 | I/II | Chemotherapy | cyclophosphamide | SD |
| ADGRV1 | SNV | Missense_Mutation | novel | c.12487N>T | p.Gly4163Trp | p.G4163W | Q8WXG9 | protein_coding | deleterious(0) | probably_damaging(0.995) | TCGA-A2-A25A-01 | Breast | breast invasive carcinoma | Female | <65 | I/II | Unspecific | Cytoxan | SD |
| ADGRV1 | SNV | Missense_Mutation | rs774378608 | c.11563G>A | p.Glu3855Lys | p.E3855K | Q8WXG9 | protein_coding | tolerated(1) | benign(0) | TCGA-A8-A06U-01 | Breast | breast invasive carcinoma | Female | >=65 | I/II | Unknown | Unknown | SD |
| ADGRV1 | SNV | Missense_Mutation | novel | c.4706N>T | p.Asp1569Val | p.D1569V | Q8WXG9 | protein_coding | deleterious(0) | probably_damaging(1) | TCGA-A8-A07F-01 | Breast | breast invasive carcinoma | Female | >=65 | I/II | Hormone Therapy | tamoxiphen | SD |
| ADGRV1 | SNV | Missense_Mutation | c.13125N>A | p.Asp4375Glu | p.D4375E | Q8WXG9 | protein_coding | tolerated(0.07) | probably_damaging(0.912) | TCGA-A8-A07W-01 | Breast | breast invasive carcinoma | Female | >=65 | III/IV | Hormone Therapy | exemestane | SD | |
| ADGRV1 | SNV | Missense_Mutation | c.13420N>A | p.Asp4474Asn | p.D4474N | Q8WXG9 | protein_coding | deleterious(0.04) | probably_damaging(0.985) | TCGA-A8-A09G-01 | Breast | breast invasive carcinoma | Female | >=65 | III/IV | Unknown | Unknown | SD | |
| ADGRV1 | SNV | Missense_Mutation | c.8145N>G | p.Ile2715Met | p.I2715M | Q8WXG9 | protein_coding | deleterious(0.02) | probably_damaging(0.99) | TCGA-A8-A09Z-01 | Breast | breast invasive carcinoma | Female | >=65 | I/II | Unknown | Unknown | SD |
| Page: 1 2 3 4 5 6 7 8 9 10 11 12 13 14 15 16 17 18 19 20 21 22 23 24 25 26 27 28 29 30 31 32 33 34 35 36 37 38 39 40 41 42 43 44 45 46 47 48 49 50 51 52 53 54 55 56 57 58 59 60 61 62 63 64 65 66 67 68 69 70 71 72 |
Top |
Related drugs of malignant transformation related genes |
| Identification of chemicals and drugs interact with genes involved in malignant transfromation |
| (DGIdb 4.0) |
| Entrez ID | Symbol | Category | Interaction Types | Drug Claim Name | Drug Name | PMIDs |
| 84059 | ADGRV1 | G PROTEIN COUPLED RECEPTOR, TRANSPORTER, CELL SURFACE, KINASE, DRUGGABLE GENOME | opioids | |||
| 84059 | ADGRV1 | G PROTEIN COUPLED RECEPTOR, TRANSPORTER, CELL SURFACE, KINASE, DRUGGABLE GENOME | opioids |
| Page: 1 |

Copyright 2023-Present -The University of Texas Health Science Center at Houston |