
|
|||||
|
 | |
| |
| |
| |
| |
| |
|
Gene: ADGRL3 |
Gene summary for ADGRL3 |
| Gene information | Species | Human | Gene symbol | ADGRL3 | Gene ID | 23284 |
| Gene name | adhesion G protein-coupled receptor L3 | |
| Gene Alias | CIRL3 | |
| Cytomap | 4q13.1 | |
| Gene Type | protein-coding | GO ID | GO:0001764 | UniProtAcc | Q9HAR2 |
Top |
Malignant transformation analysis |
| Identification of the aberrant gene expression in precancerous and cancerous lesions by comparing the gene expression of stem-like cells in diseased tissues with normal stem cells |
| Entrez ID | Symbol | Replicates | Species | Organ | Tissue | Adj P-value | Log2FC | Malignancy |
| 23284 | ADGRL3 | EEC-subject3 | Human | Endometrium | EEC | 1.29e-03 | 3.08e-01 | -0.2525 |
| 23284 | ADGRL3 | P1_S1_AK | Human | Skin | AK | 3.09e-68 | 1.29e+00 | -0.3399 |
| 23284 | ADGRL3 | P2_S3_AK | Human | Skin | AK | 1.25e-59 | 1.11e+00 | -0.3287 |
| 23284 | ADGRL3 | P2_S4_SCCIS | Human | Skin | SCCIS | 2.99e-23 | 5.89e-01 | -0.3043 |
| 23284 | ADGRL3 | P3_S6_AK | Human | Skin | AK | 2.69e-62 | 1.19e+00 | -0.3256 |
| 23284 | ADGRL3 | P4_S8_cSCC | Human | Skin | cSCC | 5.69e-17 | 5.12e-01 | -0.3095 |
| Page: 1 |
| Tissue | Expression Dynamics | Abbreviation |
| Endometrium | 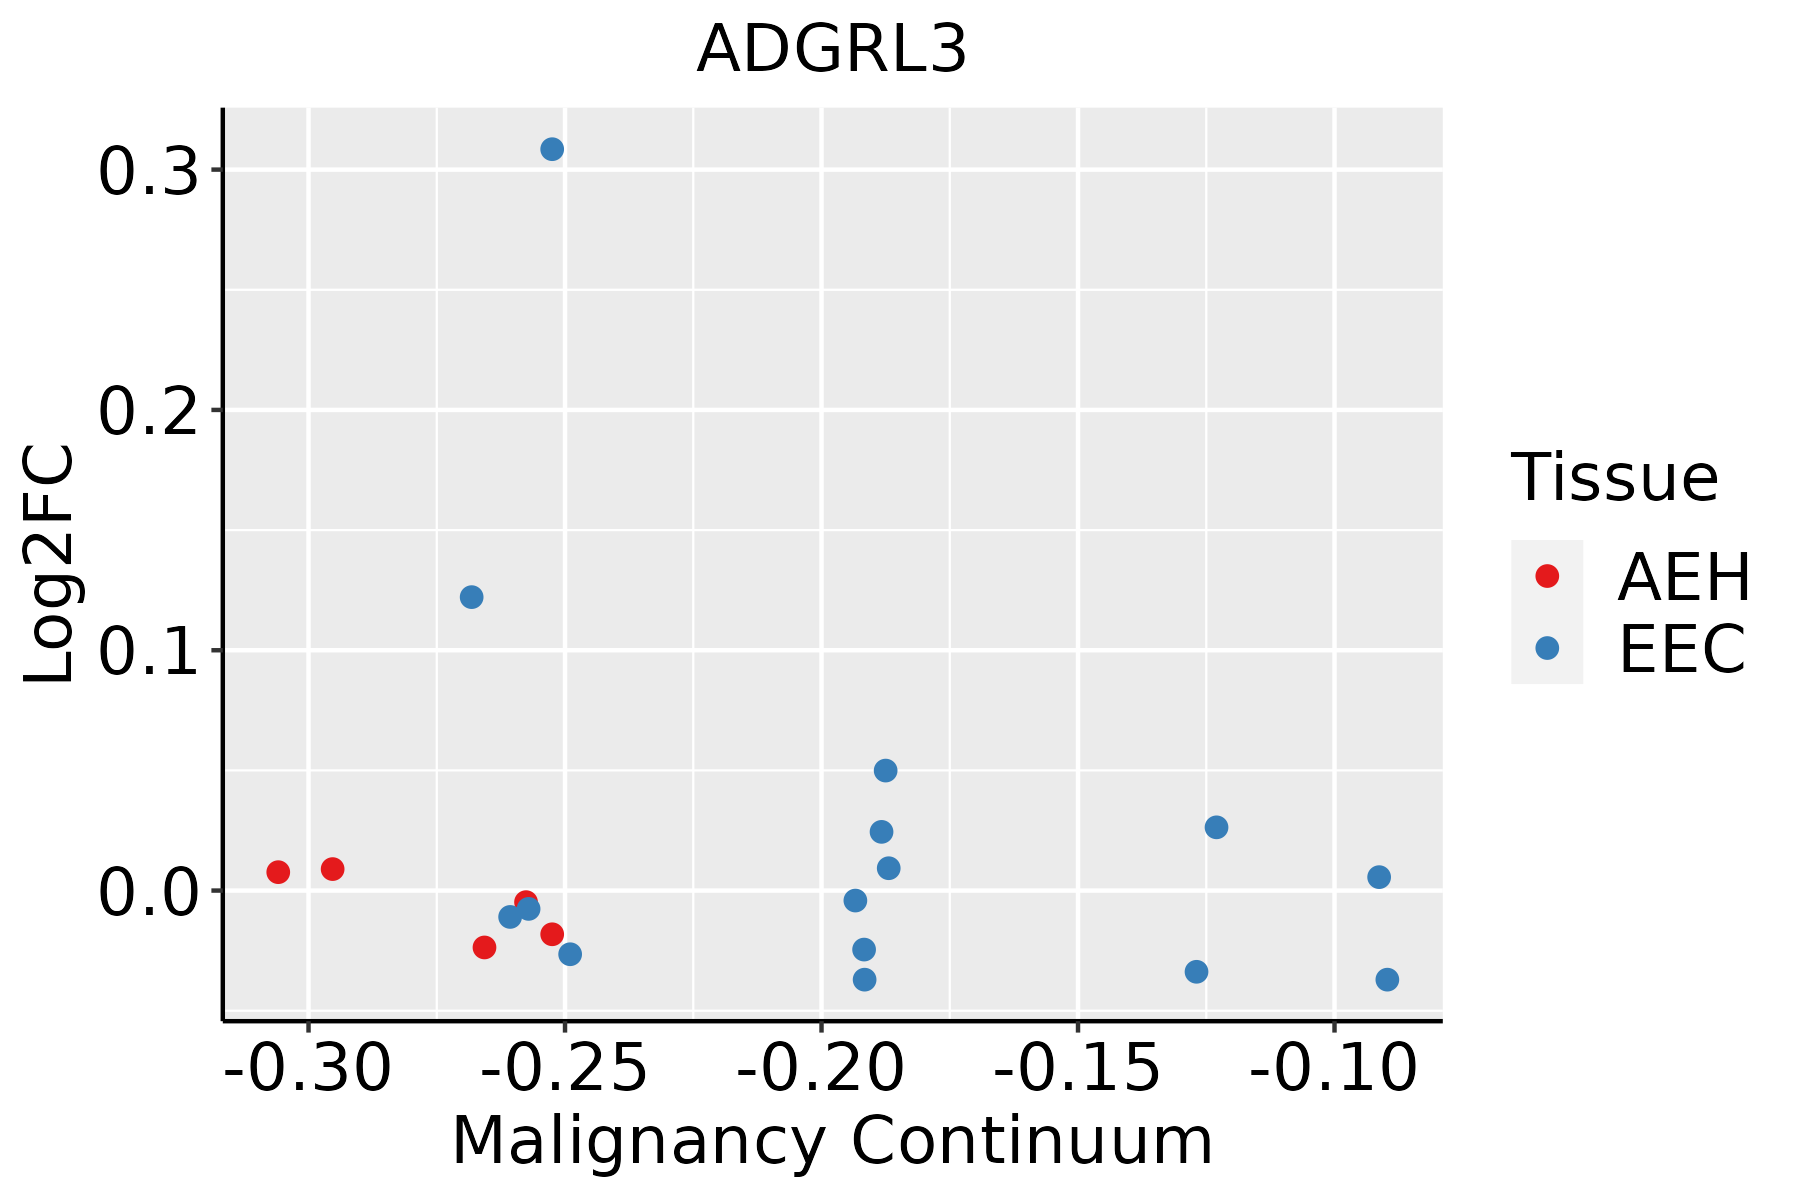 | AEH: Atypical endometrial hyperplasia |
| EEC: Endometrioid Cancer | ||
| Skin | 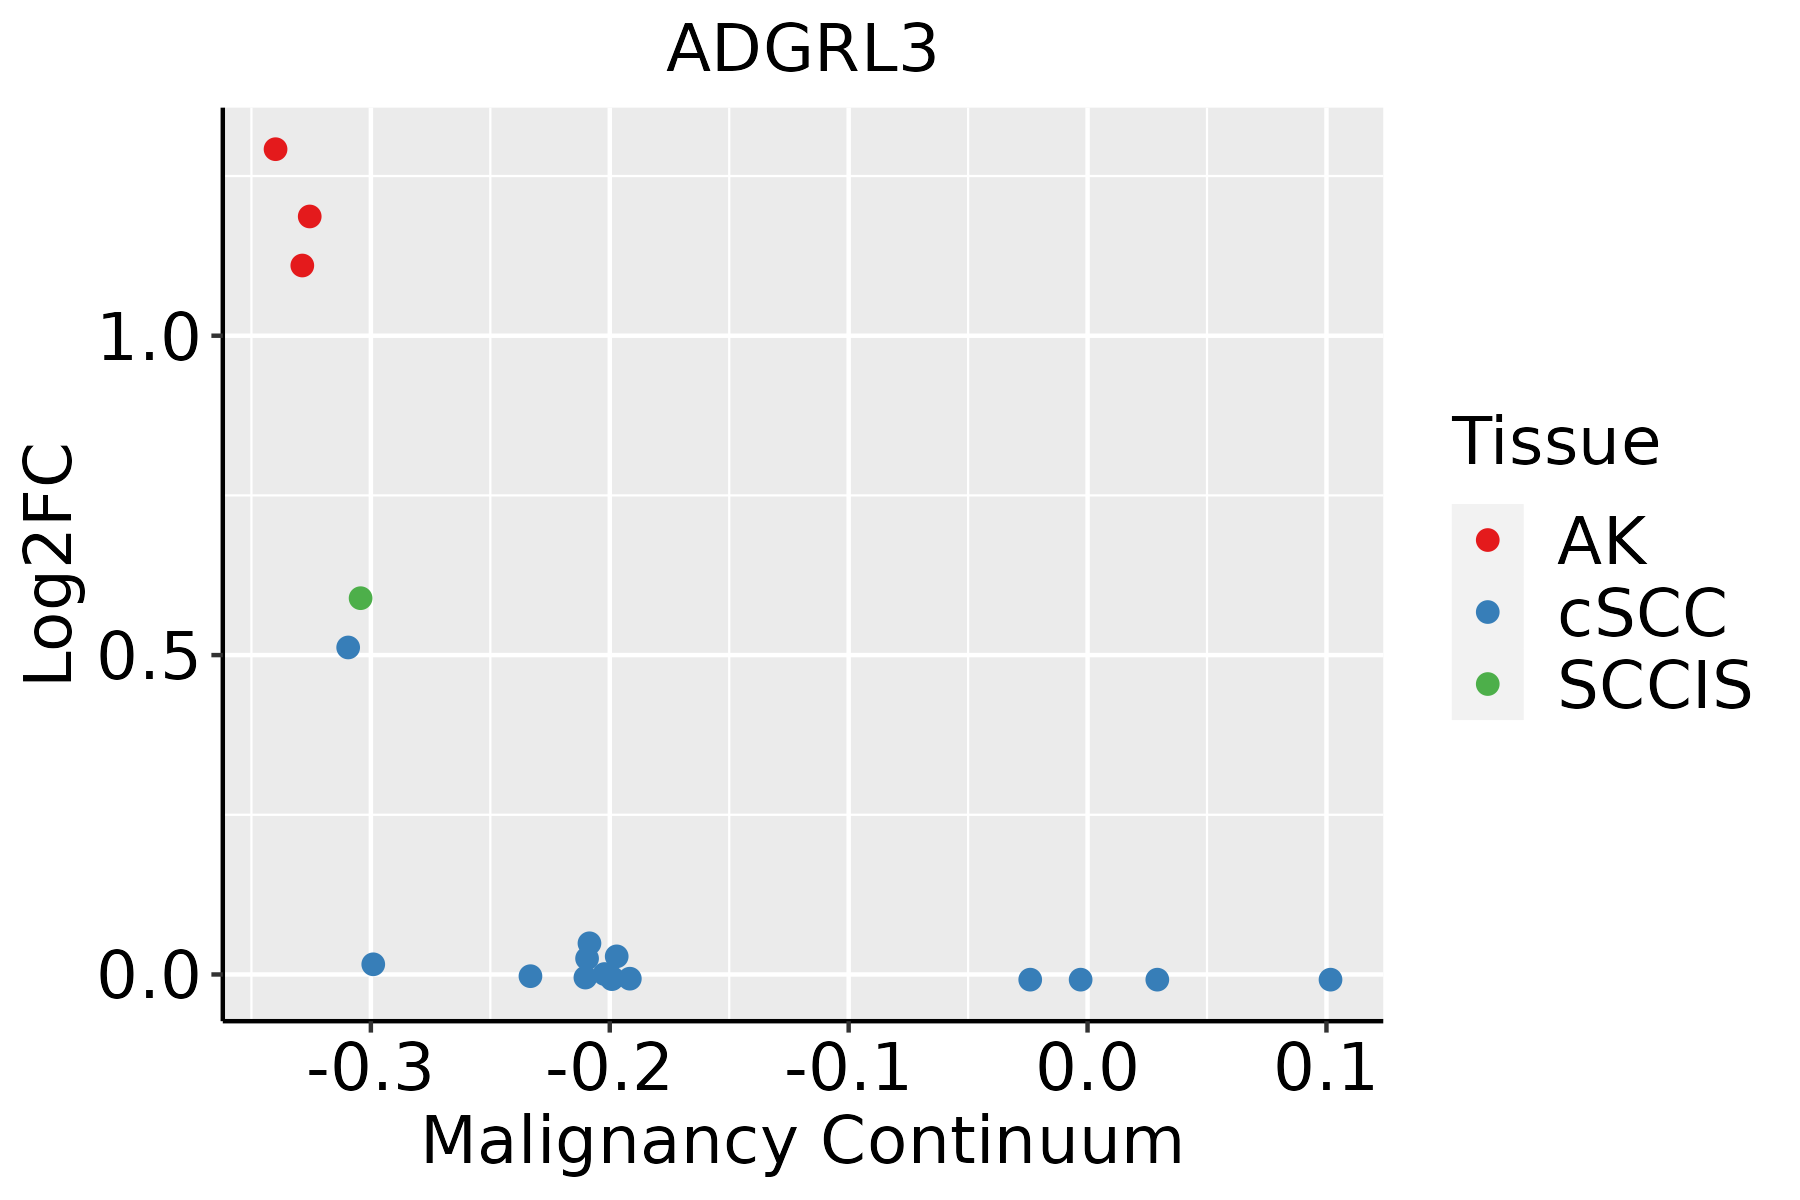 | AK: Actinic keratosis |
| cSCC: Cutaneous squamous cell carcinoma | ||
| SCCIS:squamous cell carcinoma in situ |
| ∗log2FC in expression of this searched gene in stem-like cells from each diseased tissue sample relative to stem-like cells in normal samples in each tissue plotted against the malignancy continuum. Samples are colored based on if they are from different disease stage. |
Top |
Malignant transformation related pathway analysis |
| Find out the enriched GO biological processes and KEGG pathways involved in transition from healthy to precancer to cancer |
| Tissue | Disease Stage | Enriched GO biological Processes |
| Colorectum | AD |  |
| Colorectum | SER |  |
| Colorectum | MSS |  |
| Colorectum | MSI-H |  |
| Colorectum | FAP |  |
| ∗Top 15 enriched GO BP terms are showed in the bar plot of each disease state in each tissue. Each row represents a significant GO biological process which is colored according to the -log10(p.adjust). |
| Page: 1 2 3 4 5 6 7 8 9 |
| GO ID | Tissue | Disease Stage | Description | Gene Ratio | Bg Ratio | pvalue | p.adjust | Count |
| GO:003432914 | Endometrium | EEC | cell junction assembly | 79/2168 | 420/18723 | 8.37e-06 | 1.85e-04 | 79 |
| GO:00017641 | Endometrium | EEC | neuron migration | 33/2168 | 156/18723 | 4.17e-04 | 4.38e-03 | 33 |
| GO:005080812 | Endometrium | EEC | synapse organization | 68/2168 | 426/18723 | 3.73e-03 | 2.49e-02 | 68 |
| GO:003432919 | Skin | AK | cell junction assembly | 86/1910 | 420/18723 | 1.95e-10 | 2.68e-08 | 86 |
| GO:00508088 | Skin | AK | synapse organization | 71/1910 | 426/18723 | 2.21e-05 | 4.07e-04 | 71 |
| GO:00017644 | Skin | AK | neuron migration | 26/1910 | 156/18723 | 8.26e-03 | 4.13e-02 | 26 |
| GO:0034329110 | Skin | SCCIS | cell junction assembly | 52/919 | 420/18723 | 7.89e-10 | 5.23e-07 | 52 |
| GO:005080814 | Skin | SCCIS | synapse organization | 42/919 | 426/18723 | 1.43e-05 | 4.70e-04 | 42 |
| GO:00987421 | Skin | SCCIS | cell-cell adhesion via plasma-membrane adhesion molecules | 26/919 | 273/18723 | 9.83e-04 | 1.23e-02 | 26 |
| Page: 1 |
| Pathway ID | Tissue | Disease Stage | Description | Gene Ratio | Bg Ratio | pvalue | p.adjust | qvalue | Count |
| Page: 1 |
Top |
Cell-cell communication analysis |
| Identification of potential cell-cell interactions between two cell types and their ligand-receptor pairs for different disease states |
| Ligand | Receptor | LRpair | Pathway | Tissue | Disease Stage |
| Page: 1 |
Top |
Single-cell gene regulatory network inference analysis |
| Find out the significant the regulons (TFs) and the target genes of each regulon across cell types for different disease states |
| TF | Cell Type | Tissue | Disease Stage | Target Gene | RSS | Regulon Activity |
| ∗The dot plots of a searched regulon are shown for all cell subpopulations in each disease state of each tissue based on the regulon specific score inferred using pySCENIC and by calculating the average expression. |
| Page: 1 |
Top |
Somatic mutation of malignant transformation related genes |
| Annotation of somatic variants for genes involved in malignant transformation |
| Hugo Symbol | Variant Class | Variant Classification | dbSNP RS | HGVSc | HGVSp | HGVSp Short | SWISSPROT | BIOTYPE | SIFT | PolyPhen | Tumor Sample Barcode | Tissue | Histology | Sex | Age | Stage | Therapy Types | Drugs | Outcome |
| ADGRL3 | SNV | Missense_Mutation | rs758271339 | c.4019N>C | p.His1340Pro | p.H1340P | Q9HAR2 | protein_coding | tolerated(0.23) | benign(0) | TCGA-A2-A0CS-01 | Breast | breast invasive carcinoma | Female | >=65 | III/IV | Hormone Therapy | anastrozole | SD |
| ADGRL3 | SNV | Missense_Mutation | c.2117N>G | p.Thr706Arg | p.T706R | Q9HAR2 | protein_coding | deleterious(0) | probably_damaging(0.999) | TCGA-A2-A0YT-01 | Breast | breast invasive carcinoma | Female | <65 | III/IV | Hormone Therapy | arimidex | SD | |
| ADGRL3 | SNV | Missense_Mutation | novel | c.1897G>T | p.Ala633Ser | p.A633S | Q9HAR2 | protein_coding | tolerated(0.6) | benign(0.301) | TCGA-A2-A25C-01 | Breast | breast invasive carcinoma | Female | <65 | I/II | Chemotherapy | taxotere | SD |
| ADGRL3 | SNV | Missense_Mutation | c.1414N>T | p.Pro472Ser | p.P472S | Q9HAR2 | protein_coding | deleterious(0.02) | benign(0.118) | TCGA-A8-A081-01 | Breast | breast invasive carcinoma | Female | >=65 | I/II | Unknown | Unknown | SD | |
| ADGRL3 | SNV | Missense_Mutation | rs758271339 | c.4019N>C | p.His1340Pro | p.H1340P | Q9HAR2 | protein_coding | tolerated(0.23) | benign(0) | TCGA-AC-A23C-01 | Breast | breast invasive carcinoma | Female | <65 | I/II | Chemotherapy | chemo | CR |
| ADGRL3 | SNV | Missense_Mutation | rs865866030 | c.557N>T | p.Ser186Leu | p.S186L | Q9HAR2 | protein_coding | deleterious(0) | probably_damaging(0.994) | TCGA-AN-A0FD-01 | Breast | breast invasive carcinoma | Female | >=65 | I/II | Unknown | Unknown | SD |
| ADGRL3 | SNV | Missense_Mutation | c.2158N>A | p.Gly720Ser | p.G720S | Q9HAR2 | protein_coding | tolerated(0.59) | benign(0.138) | TCGA-AN-A0FZ-01 | Breast | breast invasive carcinoma | Female | <65 | III/IV | Unknown | Unknown | SD | |
| ADGRL3 | SNV | Missense_Mutation | novel | c.1897N>T | p.Ala633Ser | p.A633S | Q9HAR2 | protein_coding | tolerated(0.6) | benign(0.301) | TCGA-B6-A0I5-01 | Breast | breast invasive carcinoma | Female | <65 | I/II | Unknown | Unknown | SD |
| ADGRL3 | SNV | Missense_Mutation | c.3722N>G | p.Val1241Gly | p.V1241G | Q9HAR2 | protein_coding | tolerated(0.18) | probably_damaging(0.998) | TCGA-B6-A0IN-01 | Breast | breast invasive carcinoma | Female | <65 | I/II | Unknown | Unknown | PD | |
| ADGRL3 | SNV | Missense_Mutation | c.1990C>A | p.Arg664Ser | p.R664S | Q9HAR2 | protein_coding | deleterious(0.02) | benign(0.385) | TCGA-BH-A0E2-01 | Breast | breast invasive carcinoma | Female | <65 | III/IV | Chemotherapy | doxorubicin | SD |
| Page: 1 2 3 4 5 6 7 8 9 10 11 12 13 14 15 16 17 18 19 20 21 22 23 24 25 26 27 28 29 30 31 32 33 34 35 36 |
Top |
Related drugs of malignant transformation related genes |
| Identification of chemicals and drugs interact with genes involved in malignant transfromation |
| (DGIdb 4.0) |
| Entrez ID | Symbol | Category | Interaction Types | Drug Claim Name | Drug Name | PMIDs |
| 23284 | ADGRL3 | G PROTEIN COUPLED RECEPTOR, DRUGGABLE GENOME | nicotine | NICOTINE | ||
| 23284 | ADGRL3 | G PROTEIN COUPLED RECEPTOR, DRUGGABLE GENOME | methylphenidate | METHYLPHENIDATE | 25229170,29230023,22851411,25989180,20157310,22486528 |
| Page: 1 |

Copyright 2023-Present -The University of Texas Health Science Center at Houston |